


Abstract
The linear correlation between 11C-methionine PET and tumor cell density is not well conserved at the tumor border in glioma. A novel imaging analysis method, voxelwise 18F-FDG–11C-methionine PET decoupling analysis (decoupling score), was evaluated to determine whether it could be used to quantitatively assess glioma cell infiltration in MRI-nonenhancing T2 hyperintense lesions. Methods: Data collection was performed in a prospective fashion. Fifty-four MRI-nonenhancing T2 hyperintense specimens were stereotactically obtained from 23 glioma patients by intraoperative navigation guidance. The decoupling score and tumor–to–normal tissue (T/N) ratio of 11C-methionine PET were calculated at each location. Correlations between the tumor cell density at these lesions, decoupling score, and T/N ratio of 11C-methionine PET were then evaluated. Results: Both the decoupling score and the T/N ratio showed a linear correlation with tumor cell density at these specimens (R2 = 0.52 and 0.53, respectively). Use of the decoupling score (cutoff = 3.0) allowed the detection of specimens with a tumor cell density of more than 1,000/mm2, with a sensitivity and specificity of 93.5% and 87.5%, respectively, whereas conventional 11C-methionine PET (cutoff = 1.2 in T/N ratio) was able to detect with a sensitivity and specificity of 87.0% and 87.5%, respectively. Reconstructed images (decoupling map) using the decoupling score enabled the visualization of glioma lesions that were difficult to visualize by 11C-methionine PET alone. Conclusion: The decoupling score showed better performance in detecting glioma cell infiltration than 11C-methionine uptake alone, thus suggesting that 18F-FDG–11C-methionine uptake decoupling analysis is a powerful imaging modality for assessing glioma invasion.
Because glioma cells are invasive, objective and quantitative evaluation of tumor cell invasion into white matter is crucial in glioma treatment. T2 hyperintense brain edema lesions surrounding glioma tumor cores are conventionally considered to be potential areas for tumor cell infiltration (1–3). Although conventional MRI remains the gold standard modality for glioma treatment planning, it has also become clear that conventional T1- or T2-weighted images are insufficient for understanding the biologic characteristics and geometric extension of tumors within the brain (4).
Different imaging methods, such as diffusion tensor MRI (DTI) and amino acid PET, have been proposed to overcome this issue (1–3,5–7). The ability of these 2 imaging modalities to characterize microstructural and metabolic tissue information has led to their use for glioma imaging. For example, the ability of DTI to capture disruption of white matter fiber tracts has been applied to the detection of glioma cell infiltration that is disorganizing fiber tracts into white matter (2,3,8). The results, however, remain controversial, and the clinical value of DTI for glioma invasion detection is considered to be limited (2). Amino acid PET, on the other hand, is considered to show much better performance than DTI.
11C-labeled methionine is the most commonly used amino acid tracer, and various studies have confirmed its clinical value in assessing the biologic characteristics of glioma tissue (5–7,9,10). In addition, the magnitude of tracer accumulation has been shown to reflect tumor cell density within the tumor core of glioma (6). This correlation, however, is not well preserved at the tumor-infiltrated area. Thus, a more robust method is necessary to objectively quantify tumor cell invasion at the tumor periphery (5) because background uptake of 11C-methionine by normal brain tissue overrides tumor cell uptake of the tracer, complicating the setting of a cutoff value for 11C-methionine PET for normal versus tumor-infiltrated areas (7,11).
To overcome these problems, we suggested a voxelwise analysis of 11C-methionine and 18F-FDG uptake in brain edema lesions in both gliomas and meningiomas (10). In that report, we demonstrated that although 11C-methionine and 18F-FDG uptake show linear correlations in both normal brain and non–tumor-infiltrated brain edema (vasogenic edema) caused by meningiomas, this correlation is disrupted in possible tumor-infiltrated brain edema caused by gliomas. The present study focused on this subject and tested the hypothesis that the magnitude of 11C-methionine and 18F-FDG uptake correlation disruption (i.e., decoupling score) reflects the extent of glioma cell infiltration into brain tissue using the image–histology comparison technique.
MATERIALS AND METHODS
Patient Selection
The study was approved by the local ethics committee (registration no. 10168). Written informed consent was obtained from each patient and was found to conform to generally accepted scientific principles and ethical standards. We prospectively collected data from 4 patients with low-grade glioma and 19 patients with high-grade glioma who underwent MRI, 11C-methionine and 18F-FDG PET for presurgical examination, and intraoperative navigation–guided stereotactic tissue sampling between 2010 and 2011. In total, 54 specimens were obtained from this patient population. Detailed information on all 23 patients is shown in Table 1.
Patient Characteristics
PET
PET images were obtained using a SET-3000 GCT/X scanner (Shimadzu Corp.) with gadolinium oxyorthosilicate crystals as emission detectors. The detectors were cylindrically arranged in a 52-mm × 5-ring layout and provided a long axial field of view (total axial field of view, 260 mm). The intrinsic spatial resolution was 3.5 mm in full width at half maximum (FWHM) in-plane and 4.2 mm in FWHM axially (12). For attenuation correction, a transmission scan (3 min), obtained using a 137Cs point source, was started with a bismuth germinate (Bi4Ge3O12) transmission detector ring coaxially attached to the gadolinium oxyorthosilicate emission detector ring. All PET images were reconstructed using the dynamic row-action maximum-likelihood algorithm after 3-dimensional gaussian smoothing with 2 mm in FWHM and Fourier rebinning. Acquired PET raw data were converted off-line to 2-dimensional sinograms using a Fourier rebinning algorithm (13). The scatter component of the radiation was corrected using the hybrid dual-energy window method combined with a convolution-subtraction method (14), and the true scatter-free component of the standard photopeak window (300–700 keV) was estimated on the basis of a sonogram. All PET images were reconstructed in 256 × 256 × 99 anisotropic voxels, with each voxel being 1 × 1 × 2.6 mm.
11C-methionine (111–222 MBq [3–6 mCi]), synthesized according to the method of Berger et al. (15), was injected intravenously. Because the present PET scanner has a high absolute sensitivity (19.0 cps/kBq with a standard energy window), it was possible to shorten the scan time to 12 min for 11C-methionine imaging. A total activity from 20 to 32 min after tracer injection was recorded in 99 transaxial slices from the entire brain and used for image reconstruction. Image qualities of these 12-min images were comparable and identical to those obtained by a conventional 40-min scan using the same equipment (20–60 min after tracer injection) and were justified for use in further analysis (Supplemental Fig. 1; supplemental materials are available online only at http://jnm.snmjournals.org.). For 18F-FDG PET, the amount of 18F-FDG determined in proportion to weight was injected intravenously (3.7 MBq/kg; range, 185–333 MBq). The total activity from 45 to 57 min after tracer injection was used for image reconstruction. The average interval of the 11C-methionine and 18F-FDG PET study was 8.9 d. For the calculation of tumor–to–normal tissue (T/N) ratio, the standardized uptake value of the contralateral tumor-unaffected hemisphere, including both the gray and the white matter, was averaged, and the derived value was used to normalize standardized uptake value in a voxelwise manner, enabling the reconstruction of a T/N ratio image.
Image Fusion and Registration
PET images and contrast-enhanced T1- and plain T2-weighted standard anatomic MR images were all registered in 3 dimensions, using normalized mutual information (NMI) with the Vinci image-analyzing software from Max-Planck Institute for Neurologic Research Cologne (http://www.nf.mpg.de/vinci/). The registration of the images was confirmed visually. The reported registration error for normalized mutual information is less than 1 mm (16). After image registration was completed, all image sets, including the standard anatomic MR images and PET data, were converted to 256 × 256 × 256 isotropic 1 × 1 × 1 mm images, to enable further voxelwise analysis (Fig. 1).

Workflow for calculation and image reconstruction of decoupling score. MR, 18F-FDG PET, and 11C-methionine PET images were registered to same 256 × 256 × 256 image matrix, and then correlation between 11C-methionine and 18F-FDG uptake within normal brain was calculated. Decoupling score at each voxel was then calculated using expected linear regression line of 11C-methionine and 18F-FDG within normal brain. Finally, decoupling score was reconstructed into 3-dimensional image. Met = methionine; Reg = regression.
Data Processing and Region-of-Interest (ROI) Selection
All datasets (standard anatomic images and PET data) were exported to in-house software written in MATLAB 7.6 (The MathWorks) for further analysis. ROIs for normal brain tissue were selected at the contralateral hemisphere of the tumor, including both the gray and the white matter, followed by a full 3-dimensional reconstruction of the decoupling score (decoupling map). For image–tissue comparison, a target voxel of interest was set at the location recorded by the neuronavigation system as the site of tissue sampling. An average value of 3 × 3 × 3 voxels was reported as the obtained value of the target site. These target volumes of interest were all selected within the T2 high-intensity but nonenhancing locations on the MR image.
Decoupling Score Calculation
As shown in Figure 1, 11C-methionine uptake was plotted as a function of 18F-FDG uptake in the normal brain. Linear regression fitting was applied to the data obtained by the ROI placed in the normal brain, which can be expressed as follows:
Next, the magnitude of deviation from this solved linear regression line for any particular voxel (i) can be expressed as follows:
Finally, the decoupling score of each data point was defined as follows:
Stereotactic Tissue Sampling
Thin-slice contrast-enhanced T1-weighted images and PET data were transferred to the neuronavigation system, and biopsy targets were planned for histopathologic examination. Tissue samples were mainly obtained from the tumor periphery for clinical purposes to evaluate viable tumor cells at the resection margin. All tissue-sampling targets were based on contrast-enhanced T1- and the registered T2-weighted MR images, and T2 high-intensity but nonenhancing locations were selected as potential candidates for sampling. These data were used to determine postoperative evaluation but not to determine the extent of resection. In addition, 2 specimens from brain tissue that appeared normal on the MR image were obtained during the approach to the main lesion; both specimens were also negative on 11C-methionine PET images, and histologic evaluation revealed them to be intact brain tissues with cell densities of only 717 and 817 cells/mm2. To minimize the effects of brain shift during resection, biopsies were performed at the earliest stages of surgery. The accuracy of the navigation system was verified by visual confirmation of anatomic landmarks, such as the cortical veins and sulcus. To minimize the influence of brain shift, a Nélaton catheter was inserted under navigation guidance aiming at the planned biopsy site to anchor the target of interest. Subsequently, the targeted area was biopsied by accurately tracing the catheter. Real-time navigation at each biopsy site in the tumor was performed to confirm biopsy position (Fig. 2).

Stereotactic image-histology comparison method. (A) Tissues were sampled under intraoperative neuronavigation guidance to assess tumor cell infiltration at tumor border. Tissues were fixed in formalin, and standard hematoxylin and eosin staining was performed. (B) Values were obtained from 11C-methionine PET and decoupling map at the exactly same location. Average of 3 × 3 × 3 voxels were reported. Gd = gadolinium; WI = weighted image.
Histopathologic Analysis
Formalin-fixed specimens were embedded in paraffin for histopathologic analysis. Hematoxylin- and eosin-stained specimens were evaluated to calculate cell density. Cell counting was performed at ×400 magnification under light microscopy (Nikon), and all cells were counted, except those that were apparently different from tumor cells, such as endothelial cells or lymphocytes. The area for the tumor cell count was 0.0497 mm2, and data for cell density were recorded as means from 3 different locations within each specimen. Our previous study showed that cell densities in non–tumor-infiltrated tissues ranged from 382 to 1,106 cells/mm2 (mean ± SD, 673 ± 219 cells/mm2) (5). Therefore, only lesions with a cell density higher than 1,000 cells/mm2 were considered tumor-infiltrated tissues.
RESULTS
Decoupling Map Reconstruction in MRI-Nonenhancing Lesions
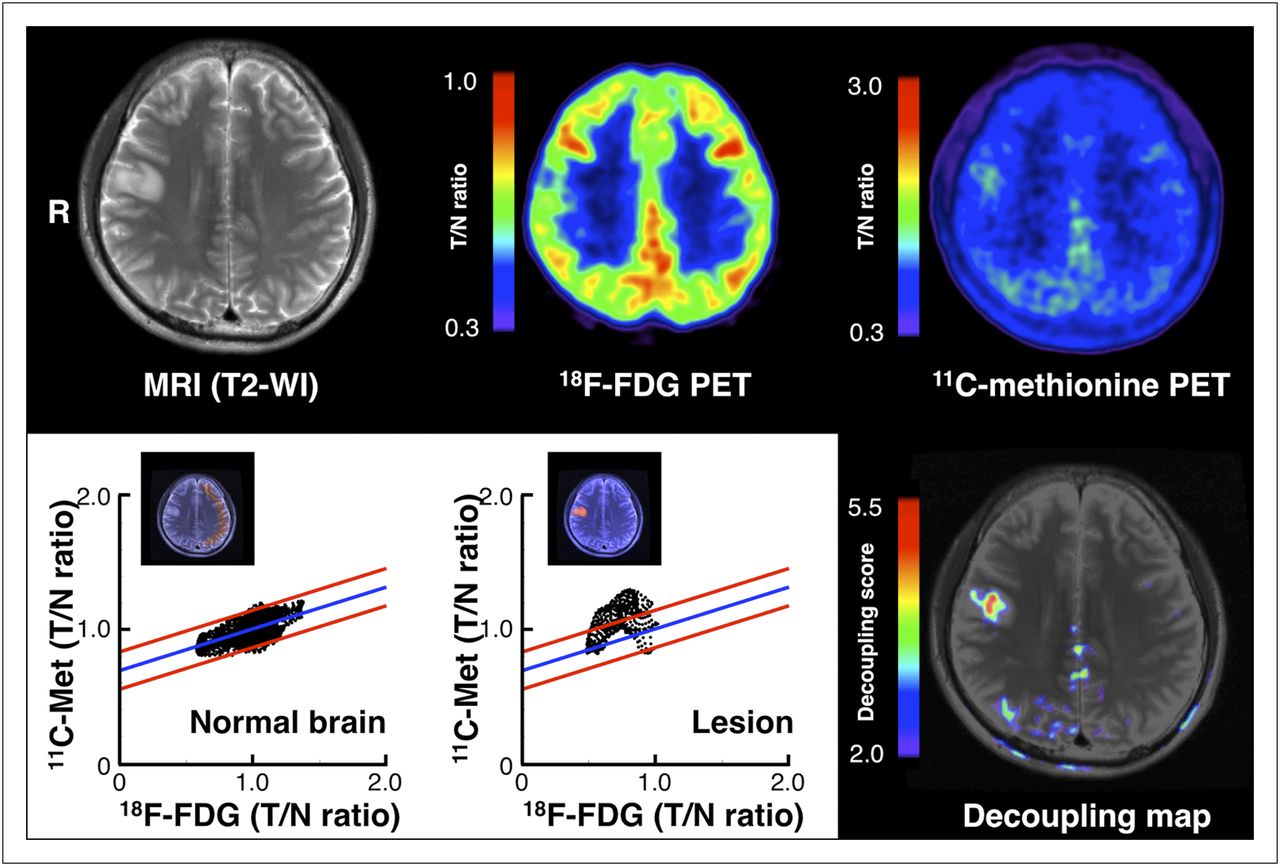
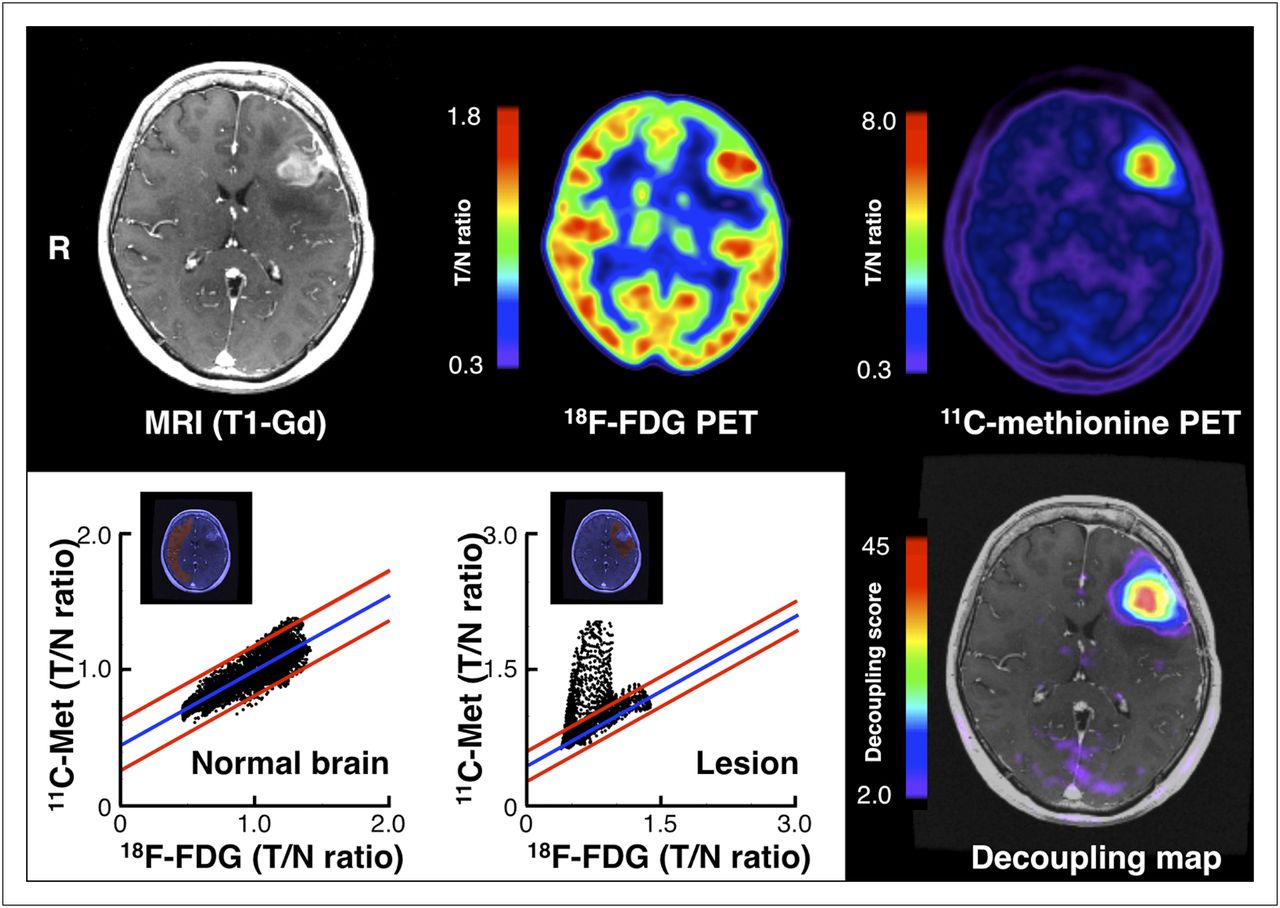
First, we examined the possibility that the decoupling score may be able to visualize the presence of tumor cells in nonenhancing lesions on MR images. As shown in Figure 3, T2 hyperintense lesions were difficult to visualize by 11C-methionine PET alone. The unclear uptake of 11C-methionine near the possible lesions was within the range of normal 11C-methionine uptake (i.e., T/N ratio of ∼1.4). After voxelwise decoupling analysis of 18F-FDG and 11C-methionine was performed, it was confirmed that the linear correlation between 18F-FDG and 11C-methionine uptake was disrupted at the T2 hyperintense lesion. The magnitude of disruption was converted into the decoupling score, as described in the “Materials and Methods” section, followed by image reconstruction. A cutoff value of 2.0 for the decoupling score confirmed the disrupted correlation between 18F-FDG and 11C-methionine uptake at the T2 hyperintense lesion. Surgical removal of this lesion confirmed it to be a World Health Organization grade II diffuse astrocytoma. Figure 4 shows another example in a peritumoral brain edema lesion. When voxelwise decoupling analysis was performed at the nonenhancing T2 hyperintense lesion around the enhancing tumor core, the linear correlation between 18F-FDG and 11C-methionine uptake, which was observed at the normal brain tissue, was disrupted. The magnitude of disruption was converted into the decoupling score, and the decoupling map was reconstructed. As can be seen in the decoupling map in Figure 4, there were areas with high (>2.0) and low (<2.0) decoupling scores within the brain edema lesion, suggesting that the decoupling score can be used to discriminate between brain edema lesions with and without glioma cell infiltration. In addition, global observation of the decoupling map showed that the contralateral tumor–unaffected hemisphere mostly showed the decoupling score to be less than 2.0, except for the cerebellum (because of its high 11C-methionine uptake, compared with the cerebrum) (Supplemental Fig. 2).

Representative case presentation of World Health Organization grade II astrocytoma (case 2). Right frontal high-intensity lesion on T2-weighted image cannot be fully appreciated by 11C-methionoine PET because of background tracer uptake (upper right figure). Correlation between 11C-methionine and 18F-FDG uptake within normal brain was calculated (lower left figure), followed by decoupling score calculation for lesion (lower middle figure). When decoupling score was reconstructed into image (decoupling map), high decoupling scores were seen within lesion (lower right figure). Met = methionine; WI = weighted image.

Representative case of recurrent World Health Organization grade IV glioblastoma (case 21). It is difficult to identify margins of tumor-infiltrated tissue surrounding gadolinium-enhanced lesion at left frontal lobe by observation using 11C-methionoine PET alone (upper right figure). Correlation between 11C-methionine and 18F-FDG uptake within normal brain was calculated (lower left figure), followed by decoupling score calculation of brain edema lesion surrounding gadolinium-enhanced lesion (lower middle figure). When decoupling score was reconstructed into image (decoupling map), a high decoupling score was seen at center of edema lesion, suggesting that outer rim of edema shows less tumor infiltration than inner portion (lower right figure). Gd = gadolinium; Met = methionine.
Linear Correlation of Decoupling Score and Tumor Cell Density
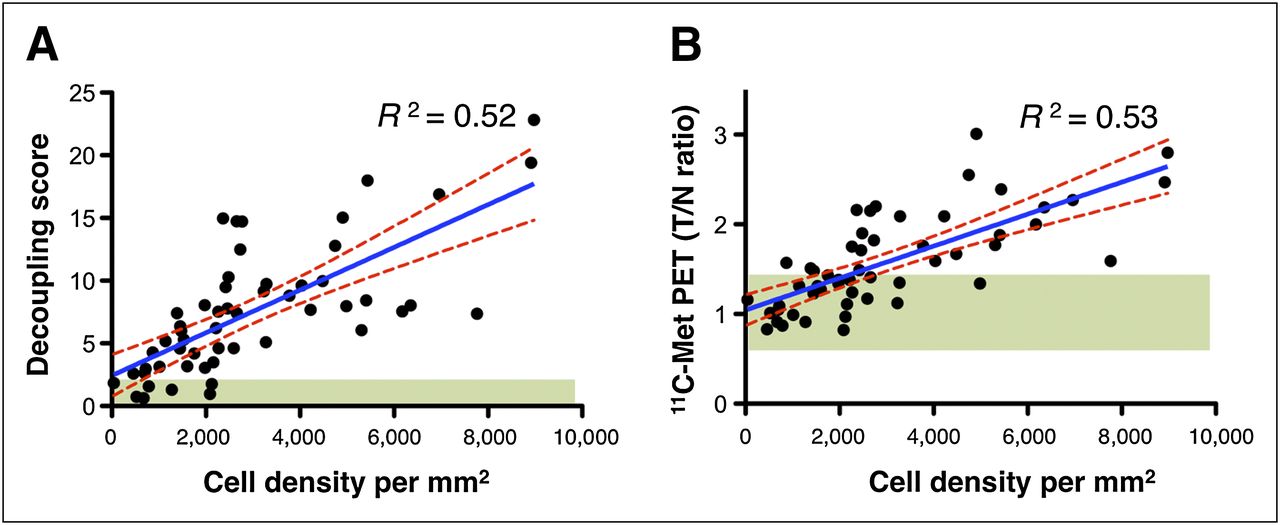
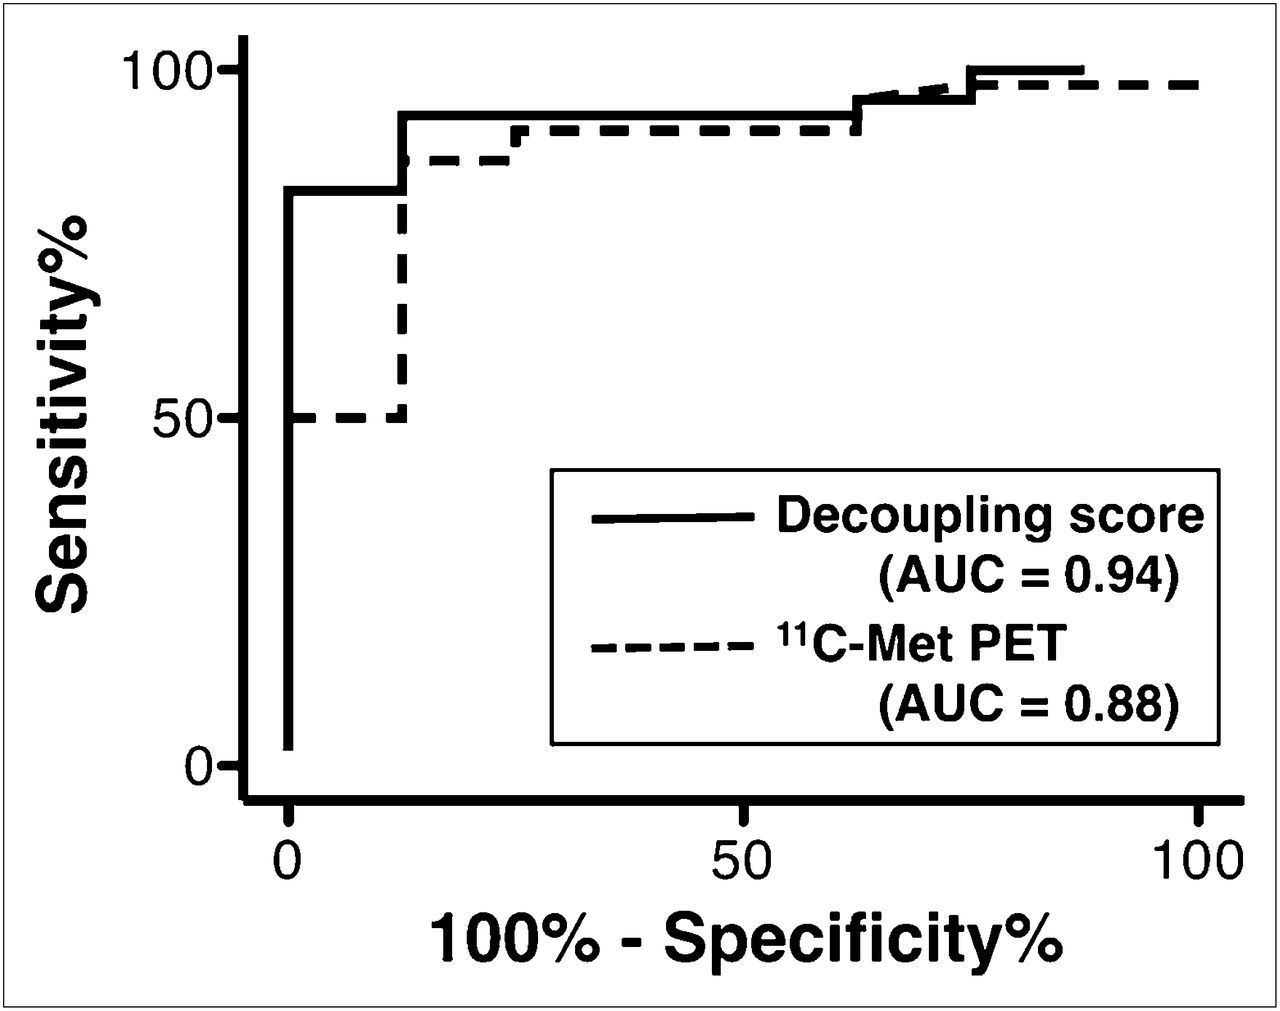
Next, an image–histology correlation analysis was performed to test the hypothesis that the decoupling score is correlated with tumor cell density within the nonenhancing T2 hyperintense lesion in gliomas. Tissue sampling was stereotactically performed using an intraoperative neuronavigation system, recording the sites where the tissues were sampled (Fig. 2). The decoupling score at the target location was also recorded by averaging 3 × 3 × 3 voxels around the target. In total, 54 specimens from 22 patients were analyzed. As shown in Figure 5A, the decoupling score was linearly correlated with tumor cell density at the nonenhancing T2 hyperintense lesion in gliomas. Overall, the average and SD of the decoupling score obtained from 54 locations were 7.53 and 5.07, respectively. Because the decoupling score at the contralateral normal brain is below 2, the cutoff value could be set at 2 to discriminate tumor-infiltrated from noninfiltrated brain tissues. Receiver-operating-characteristic (ROC) analysis for detecting lesions with a cell density of more than 1,000 tumor cells/mm2 using the decoupling score revealed that this score performed best with a cutoff value of 3.0 (sensitivity, 93.5%; specificity, 87.5%), with an area under the curve of 0.94 (Fig. 6). These results suggest that the decoupling score is useful for both qualitative and quantitative assessment of glioma tumor cell infiltration into the brain tissue.

Stereotactic image–histology comparison of the 54 specimens. (A) Correlation between tumor cell density and decoupling score. Tumor cell density and decoupling score shows linear correlation (R2 = 0.52). Green region shows area with decoupling score of less than 2.0. This cutoff enabled 93% of lesions with more than 1,000 tumor cells/mm2 to be successfully identified. (B) Correlation between tumor cell density and T/N ratio of 11C-methionine uptake. Tumor cell density and T/N ratio of 11C-methionine uptake shows linear correlation (R2 = 0.53). Green region shows area with T/N ratio ranging from 0.7 to 1.3. This cutoff enabled 76% of lesions with more than 1,000 tumor cells/mm2 to be successfully identified. Met = methionine.

ROC analysis for detecting lesions with cell density of more than 1,000 tumor cells/mm2 using either decoupling score or T/N ratio of 11C-methionie uptake. Decoupling score showed best performance, with cutoff value of 3.0 (sensitivity, 93.5%; specificity, 87.5%), whereas cutoff value for T/N ratio of 11C-methionine uptake was 1.2 (sensitivity, 87.0%; specificity, 87.5%). AUC = area under the curve; Met = methionine.
Comparison of Decoupling Score and 11C-Methionine PET for Tumor Cell Infiltration Detection in Glioma
Finally, the decoupling score was compared with 11C-methionine PET for the detection of tumor cell infiltration in gliomas. The T/N ratio for 11C-methionine uptake was measured in the same manner as the decoupling score. As shown in Figure 5B, 11C-methionine uptake showed a linear correlation with tumor cell density, as did the decoupling score. Average and SD of the T/N ratio for 11C-methionine uptake obtained from 54 locations were 1.58 and 0.53, respectively. Numerous locations with low cell density, however, accumulated low levels of 11C-methionine, within the range of normal-brain uptake levels (T/N ratio, <1.4). As a consequence, the T/N ratio for 11C-methionine uptake did not perform as well as the decoupling score did in identifying tumor cells of more than 1,000/mm2. ROC analysis showed that the T/N ratio for 11C-methionine uptake performed best at a cutoff value of 1.2 (sensitivity, 87.0%; specificity, 87.5%), with an area under the curve of 0.88 (Fig. 6). This result indicates that the decoupling score is a better surrogate indicator for cell infiltration than 11C-methionine PET alone.
DISCUSSION
Preoperative radiologic assessment of gliomas is crucial for surgical and postsurgical treatment planning. Because both low- and high-grade gliomas are heterogeneous, recognizing the geometric spread of the tumor and identifying the location of highest malignancy within the tumor is required for achieving maximum resection and obtaining the most valuable tissue for accurate diagnosis (17). This information is also crucial for postsurgical adjuvant treatment of gliomas. Defining the area of tumor spread is necessary for treatment planning using both conventional and advanced radiotherapy (18,19). However, retrieving information on biologic characteristics including cell density of the tumor is challenging, particularly in MRI-nonenhancing T2 hyperintense lesions (20).
Several parameters, including fractional anisotropy and apparent diffusion coefficient obtained from DTI, have been assessed for this need (1–3,21,22). The results, however, are controversial and the clinical value of DTI for elucidating the biologic characteristics of glioma is considered to be limited, particularly in areas with low tumor cell density (2). On the other hand, 11C-methionine PET has gained wide interest, because it can provide more direct biologic information on the tumor than MRI (23). Because the amount of accumulated 11C-methionine is correlated with the amount of amino acid transporters within the lesion, the magnitude of 11C-methionine accumulation shows a positive correlation with glioma cell density (7). Our previous reports have suggested that this assumption is true to some extent in both tumor-core and tumor-infiltrative lesions, making 11C-methionine PET a reliable imaging modality for glioma cell detection (5,6). This correlation, however, is not well preserved in tumor-infiltrative lesions (5). One of the major issues is the background uptake of 11C-methionine by normal brain tissue. As can be seen in Figures 3 and 4 and Supplemental Figure 2, normal brain tissue, especially the gray matter, is capable of 11C-methionine uptake up to a T/N ratio of 1.4. The reported ideal cutoff for discriminating normal from tumor-infiltrative lesions ranges from 1.2 to 1.3, which falls within the range of 11C-methionine uptake in normal brain (7,11,24). As shown in Figure 5B, application of these cutoffs will result in pseudonegative and pseudopositive results, thus necessitating a more reliable imaging analysis method for glioma infiltration detection (7,24).
To resolve this issue, 18F-FDG PET was used as a reference for normal-brain tracer uptake. As summarized in Figure 7, uptake of 11C-methionine and 18F-FDG within the normal brain tissue has a linear correlation, supporting the hypothesis that 18F-FDG can indeed be used as a reference index for 11C-methionine uptake in normal brain tissues. By solving the correlation of 18F-FDG and 11C-methionine uptake in the normal brain, the magnitude of decoupling of these 2 tracers can be calculated throughout the entire brain. When brain edema is caused by pure vasogenic effects and no tumor cell infiltration is involved, both 18F-FDG and 11C-methionine uptake will decrease, thereby maintaining these correlations (Fig. 7, vasogenic edema). If there is tumor infiltration involved, this correlation will be disrupted, and 11C-methionine uptake will be higher than expected in normal brain or vasogenic brain edema (Fig. 7, tumor infiltration). This mismatch between the 2 tracers is thought to reflect tumor infiltration, and the data presented in Figure 5A clearly show that the decoupling score is linearly correlated with tumor cell density in MRI-nonenhancing T2 hyperintense lesions. Overall, the role of 18F-FDG PET in calculating the decoupling score is to compensate the 11C-methionine uptake by non–tumor-infiltrated brain tissues and uncover the true 11C-methionine uptake by tumor cells.
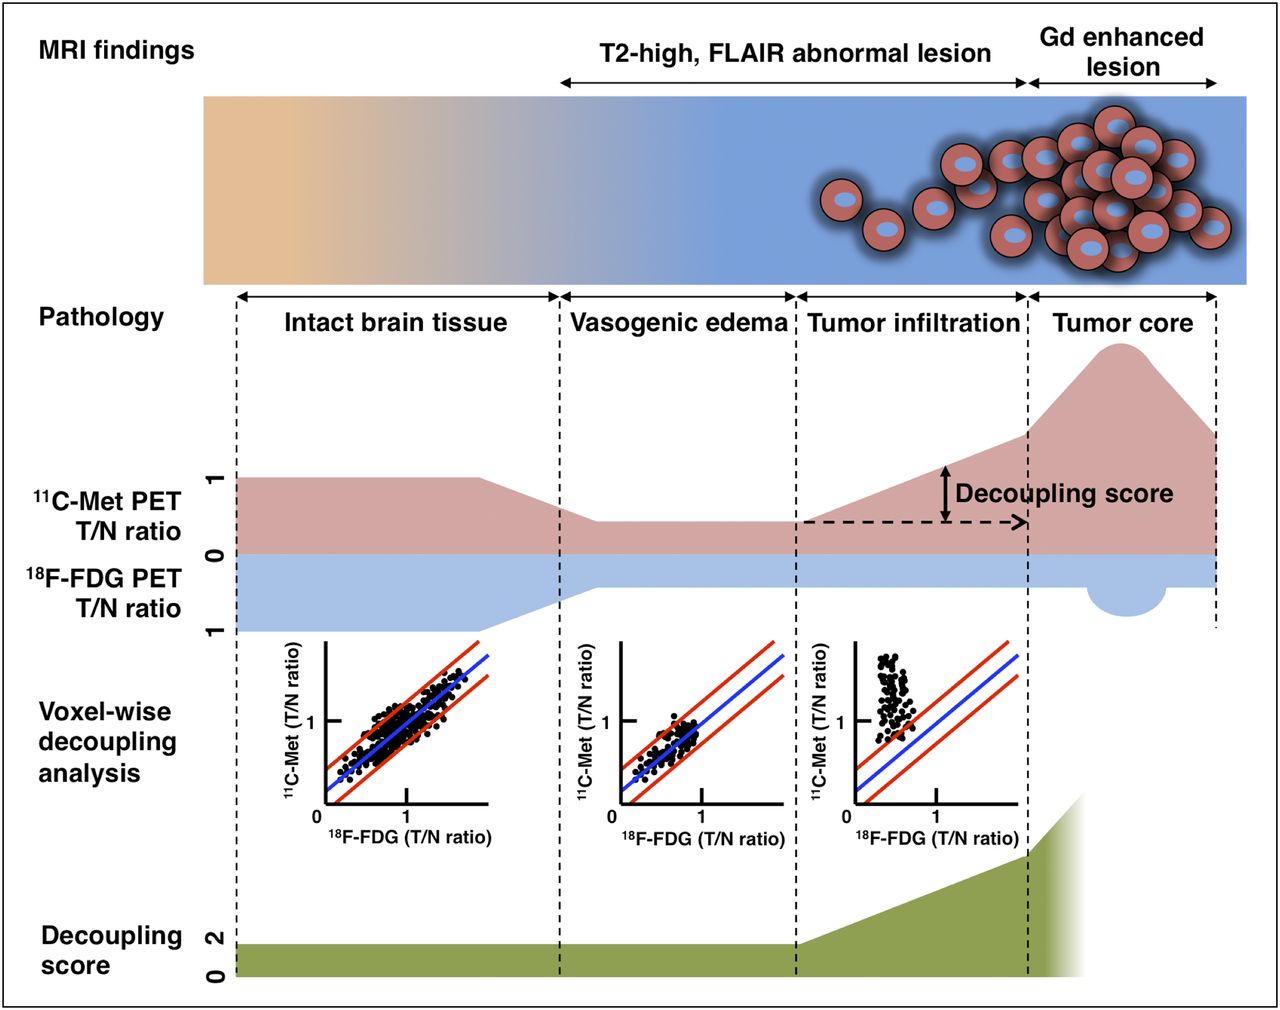
Schematic diagram of relationship between cell density, MRI findings, 11C-methionine uptake, voxelwise decoupling analysis, and decoupling score. Decoupling score can discriminate tumor-infiltrative edema from vasogenic edema. FLAIR = fluid-attenuated inversion recovery; Gd = gadolinium; Met = methionine.
Moreover, the present results showed that when the cutoff value is set at 3.0, the decoupling score is more sensitive to tumor infiltration detection than the T/N ratio for 11C-methionine uptake, with the most ideal cutoff (1.2 in this study) (93.5% vs. 87.0%), without any tradeoff of sensitivity (87.5% in both cases). Because the decoupling score is determined by the distribution of the magnitude of 18F-FDG and 11C-methionine uptake decoupling within the non–tumor-affected hemisphere, a decoupling score of higher than 2.0 is theoretically considered abnormal. A more detailed tissue characterization study will be necessary at areas with a decoupling score between 2.0 and 3.0, a value that was obtained by ROC analysis. Because there were only 8 among 54 specimens that showed a cell density less than 1,000 cells/mm2 in the current study, data from normal brain tissues would further elucidate the most appropriate cutoff for the decoupling score. This is an important issue, however, that should be considered when weighing the ethical issues of sampling normal-appearing brain tissues during surgery.
The clinical availability of the decoupling score is considered to be relatively straightforward, because the reported method requires 2 commonly used PET tracers for glioma diagnosis. A key issue to consider is the anatomic fluctuation of the decoupling score. Because 11C-methionine uptake is relatively high in the cerebellum, the decoupling score cannot be applied to infratentorial glioma lesions (Supplemental Fig. 2). As a result, use of the proposed decoupling score should be restricted to supratentorial lesions.
CONCLUSION
A novel radiologic index, the 18F-FDG–11C-methionine uptake decoupling score, was applied to assess glioma cell infiltration in MRI-nonenhancing T2 hyperintense lesions. The present results showed that the 18F-FDG–11C-methionine uptake decoupling score correlates linearly with glioma cell density within this type of lesion and is better at detecting glioma cell infiltration than 11C-methionine uptake alone. Further studies are required to confirm our findings and validate that the 18F-FDG–11C-methionine uptake decoupling score is a powerful imaging index for assessing glioma invasion.
DISCLOSURE STATEMENT
The costs of publication of this article were defrayed in part by the payment of page charges. Therefore, and solely to indicate this fact, this article is hereby marked “advertisement” in accordance with 18 USC section 1734.
Acknowledgments
We thank Mariko Kihara for assisting in tissue preparation and Mariko Kakinoki for helping in the preparation of the manuscript. This investigation was supported by the Osaka Cancer Research Foundation, the Osaka Cancer Researcher Training Fund, the Takeda Science Foundation, the Sagawa Foundation for Promotion of Cancer Research, the Aichi Cancer Research Foundation, and a Grant-in-Aid for Scientific Research from the Ministry of Education, Science and Culture of Japan. No other potential conflict of interest relevant to this article was reported.
Footnotes
Published online Sep. 21, 2012.
- © 2012 by the Society of Nuclear Medicine and Molecular Imaging, Inc.
REFERENCES
- Received for publication February 24, 2012.
- Accepted for publication June 18, 2012.


