


Abstract
Characteristic neuropathologic changes in Alzheimer disease (AD) are amyloid-β deposits and neurofibrillary tangles. Recently, a new radioligand for amyloid senile plaques, 11C-labeled 5-(6-{[tert-butyl(dimethyl)silyl]oxy}-1,3-benzothiazol-2-yl)pyridin-2-amine (11C-AZD2184), was developed, and it was reported to show rapid brain uptake followed by rapid washout. In this study, 11C-AZD2184 binding in control subjects and AD patients was examined in more detail by compartment model analysis using a metabolite-corrected arterial input function. The accuracy of simplified quantitative methods using a reference brain region was also evaluated. Methods: After intravenous bolus injection of 11C-AZD2184, a dynamic PET scan was obtained for 90 min in 6 control subjects and 8 AD patients. To obtain the arterial input function, arterial blood sampling and high-performance liquid chromatography analysis were performed. Results: Time–activity curves in all brain regions could be described using the standard 2-tissue-compartment model. The total distribution volume ratios to reference region (DVR) in cerebral cortical regions were significantly higher in AD patients than in control subjects. Although there was no conspicuous accumulation of radioactivity in white matter as compared with other amyloid radioligands, DVR values in the centrum semiovale were more than 1 for both control subjects and AD patients, suggesting binding to myelin. The standardized uptake value ratio calculated from integrated time–activity curves in brain regions and the reference region was statistically in good agreement with DVR. Conclusion: Although the white matter binding of 11C-AZD2184 may have some effect on cortical measurement, it can be concluded that the kinetic behavior of 11C-AZD2184 is suitable for quantitative analysis. The standardized uptake value ratio can be used as a validated measure of 11C-AZD2184 binding in clinical examinations without arterial input function.
Alzheimer disease (AD) is the most common neurodegenerative disorder. Characteristic neuropathologic changes in AD are amyloid-β deposits and neurofibrillary tangles (1). The amyloid cascade hypothesis states that the deposition of amyloid-β drives the remaining Alzheimer pathology, for example, formation of neurofibrillary tangles, cell loss, and vascular damage (2). From this perspective, in vivo imaging of amyloid-β deposits may contribute to early diagnosis of AD and serve as a marker for evaluation of disease-modifying drugs. To measure amyloid-β deposits by PET, several radiotracers, for example, 11C-Pittsburgh compound B (11C-PIB) (3,4) and (E)-4-(2-(6-(2-(2-(2-18F-fluoroethoxy)ethoxy)ethoxy)pyridin-3-yl)vinyl)-N-methyl benzenamine (5), have been developed and used for examination of the pathophysiology of AD.
11C-labeled 5-(6-{[tert-butyl(dimethyl)silyl]oxy}-1,3-benzothiazol-2-yl)pyridin-2-amine (11C-AZD2184) is a more recently developed radiotracer for amyloid-β deposits. 11C-AZD2184 has been characterized in preclinical studies and has high affinity in vitro for amyloid fibrils (dissociation constant, 8.4 ± 1.0 nM) (6). After intravenous injection of 11C-AZD2184 in an initial human study, there was rapid uptake of radioactivity in the brain, followed by rapid washout in control subjects and in AD patients (7). The ratios of uptake in cortical regions to a reference brain region devoid of amyloid-β deposition were close to unity in control subjects and high in AD patients. In addition, there was no conspicuous accumulation of radioactivity in white matter.
The initial results indicate that 11C-AZD2184 has potential as a sensitive imaging biomarker for research on the pathophysiology and treatment of AD. The aim of the present study was to examine 11C-AZD2184 binding in greater detail by compartment model analysis using a metabolite-corrected arterial input function. The accuracy of simplified quantitative methods using a reference brain region was also evaluated.
MATERIALS AND METHODS
Subjects
Six control subjects (mean age ± SD, 65 ± 10 y) and 8 AD patients (72 ± 12 y) were recruited (Table 1). All AD patients were diagnosed according to the criteria of the National Institute of Neurologic and Communicative Diseases and Stroke/Alzheimer Disease and Related Disorders Association (8). All subjects were characterized according to the Clinical Dementia Rating scale (9). The control subjects were rated as 0 by the Clinical Dementia Rating scale, whereas the AD subjects were rated as 0.5, 1, or 2. In addition, the Mini-Mental State Examination was performed in all subjects (10). No subject had any observable organic brain lesion according to MR imaging. Control subjects had no cognitive impairment and were free from medications for the central nervous system. The study was approved by the Institutional Review Board of the National Institute of Radiologic Sciences, Chiba, Japan. Written informed consent was obtained from all subjects or from their spouses or other close family members.
Profiles of Subjects
Radioligand
11C-AZD2184 was produced according to the literature (11). In brief, 11C-AZD2184 was radiosynthesized by reaction of the precursor 5-(6-(tert-butyldimethyl-silyloxy)benzo[d]thiazol-2-yl)pyridin-2-amine with 11C-CH3I in the presence of potassium hydroxide and subsequent deprotection by water (7).
PET Experimental Procedure
All PET measurements were performed with a SET-3000GCT/X scanner (Shimadzu Corp.) (12), which provides 99 sections with an axial field of view of 26 cm. The intrinsic spatial resolution is 3.4 mm in-plane and 5.0 mm in full width at half maximum axially. Images were reconstructed by the filtered backprojection algorithm. With a gaussian filter (cutoff frequency, 0.3 cycle/pixel), the reconstructed in-plane resolution was 7.5 mm in full width at half maximum. Data were acquired in 3-dimensional mode. Scatter correction was done by a hybrid scatter-correction method based on acquisition with dual-energy window setting (13). A 4-min transmission scan using a 137Cs line source was obtained to correct for attenuation.
After intravenous bolus injection of 11C-AZD2184 over 1 min, a dynamic PET scan was obtained for 90 min. The frame sequence consisted of six 10-s, three 20-s, six 1-min, four 3-min, and fourteen 5-min frames. The radioactivity injected was 380 ± 12 and 380 ± 13 MBq, and the specific radioactivity was 131 ± 38 and 119 ± 28 GBq/μmol at the time of injection for control subjects and AD patients, respectively.
To obtain the arterial input function, 32 samples of arterial blood were taken after injection. The fraction of radioactivity representing unchanged 11C-AZD2184 in plasma was determined by high-performance liquid chromatography from 6 blood samples for each subject. Acetonitrile was added to each plasma sample, and the samples were then centrifuged. The obtained supernatant was subjected to radio–high-performance liquid chromatography analysis (column, μBondapak [10 μm, 7.8 × 300 nm]; Waters) (mobile phase, 90% acetonitrile [A]/1 mol/L ammonium formate [B]; gradient, 0–10 min [A/B], 22/78–47/53, 10–11 min [A/B], 47/53–80/20, and 11–12 min [A/B], 80/20–22/78; isocratic, 12–15 min end; flow rate, 6.0 mL/min). Plasma protein binding was not determined in the present study. The time curves for the fraction of unchanged 11C-AZD2184 in plasma were fitted by the Hill equation and used for kinetic analysis.
MR Imaging Procedure
All MR imaging examinations were performed with a 3-T MR scanner (GE Healthcare). Three-dimensional volumetric acquisition of a T1-weighted 3-dimensional fast spoiled gradient-recalled acquisition in the steady-state sequence produced a gapless series of thin transverse sections (echo time, 2.848 ms; repetition time, 6.992 ms; prep time, 900 ms; flip angle, 8°; field of view, 260 mm; acquisition matrix, 256 × 256; slice thickness, 1 mm; scan time, 367 s). Proton density–weighted and T2-weighted images were obtained by a 2-dimensional double-echo fast spin echo sequence with interleaved and gapless acquisition (echo time for proton density–weighted images, 10.58 ms; effective echo time for T2-weighted images, 95.22 ms; repetition time, 3,000.00 ms; field of view, 240 mm; acquisition matrix, 256 × 256; slice thickness, 3 mm [no gap, interleave]; echo train length, 16; scan time, 309 s). T1-weighted images were used for analysis of PET images. Proton density–weighted and T2-weighted images were used to confirm whether subjects had any observable organic brain lesion.
Regions of Interest (ROIs)
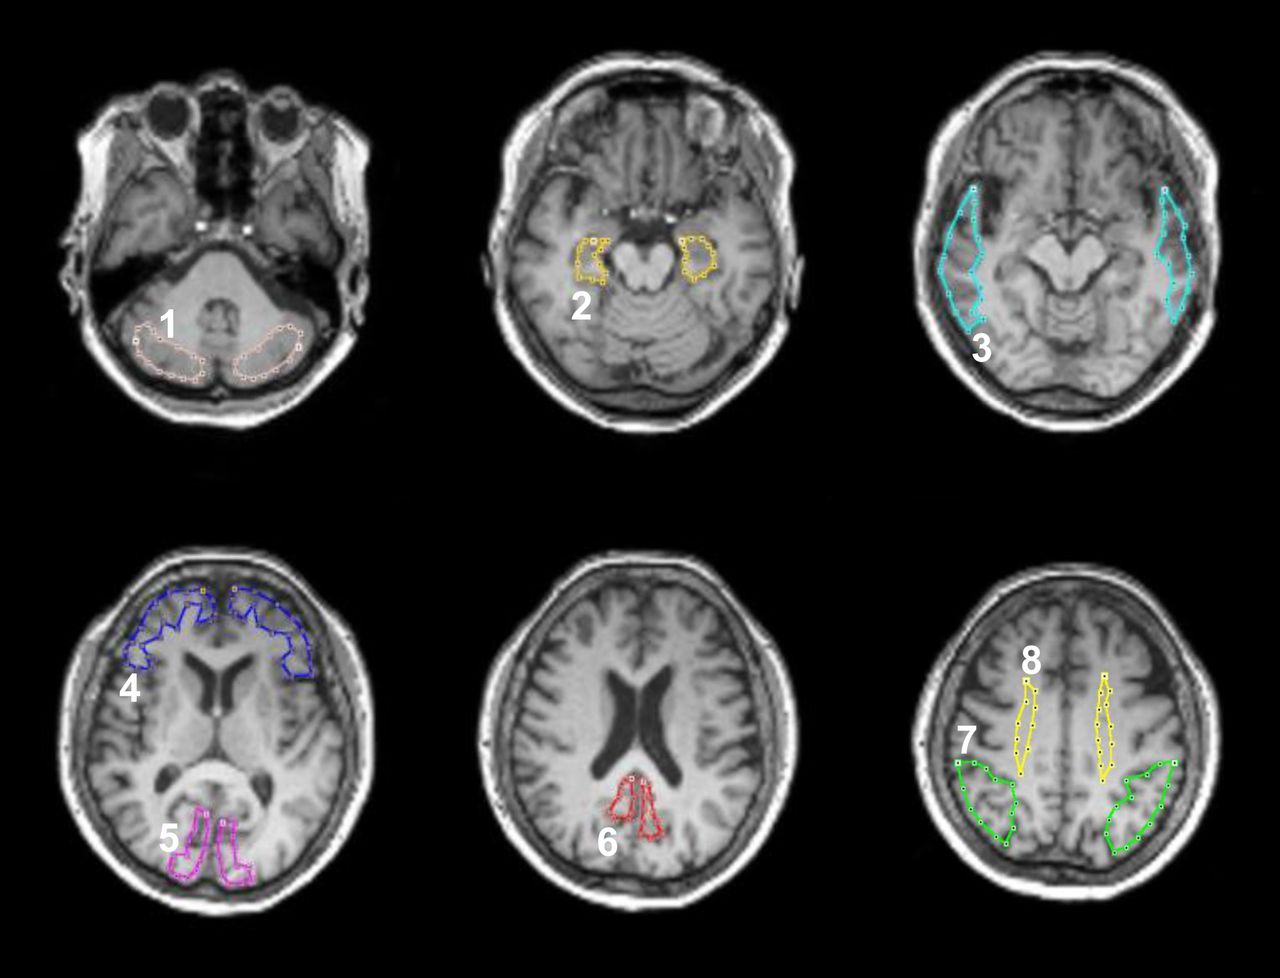
All MR images were coregistered to the individual PET images using the software package PMOD (version 3.0; PMOD Technologies Ltd.). ROIs were drawn on coregistered MR images (T1-weighted images) and transferred to the PET images. ROIs were defined for the cerebellar cortex, parahippocampal gyrus including the hippocampus, posterior region of the cingulate gyrus, base side of the frontal cortex, lateral side of the temporal cortex, parietal cortex, cuneus of the occipital cortex, and centrum semiovale (Fig. 1). Each ROI was drawn on 3 adjacent sections, and data were pooled to obtain the average radioactivity concentration for the whole volume of interest. To obtain regional time–activity curves, regional radioactivity was calculated for each frame, corrected for decay, and plotted versus time.

ROIs drawn on coregistered MR images. ROIs are defined for cerebellar cortex (1), parahippocampal gyrus including hippocampus (2), lateral side of temporal cortex (3), base side of frontal cortex (4), cuneus of occipital cortex (5), posterior region of cingulate gyrus (6), parietal cortex (7), and centrum semiovale (8).
Kinetic Model for Interpretation of 11C-AZD2184 Binding
To interpret the kinetic behavior of 11C-AZD2184, the standard 2-tissue-compartment model with 4 first-order rate constants was used (14). The rate constants K1 and k2 describe the influx and efflux rates for radiotracer diffusion through the blood–brain barrier, respectively. The rate constants k3 and k4 describe the radiotracer transfer between the compartments for nondisplaceable radiotracer and specific binding. The distribution volume with only nondisplaceable binding in a brain region (VND), the total distribution volume (VT), and the binding potential relative to the concentration of nondisplaceable radiotracer in brain (BPND) are expressed as follows (15): Eq. 1
Eq. 1 Eq. 2
Eq. 2 Eq. 3
Eq. 3
Kinetic Analysis of 11C-AZD2184 Binding
To estimate the rate constants (K1, k2, k3, and k4), nonlinear curve fitting was performed in a least-squares sense to the regional time–activity curves (16). In this analysis, the blood volume, which depends on the first-pass extraction fraction of the tracer, was assumed to be 0.04 mL/mL to diminish the influence of tracer remaining in the blood using the radioactivity of whole blood (17). The radioactivity of unchanged 11C-AZD2184 in plasma was used as the arterial input function. For this analysis, PMOD was used. VT was calculated from the rate constants as an indicator of amyloid-β deposits (Eq. 2).
Quantitative Approach Using Reference Region
The cerebellum has been suggested as a reference brain region because no fibrillar amyloid plaques have been demonstrated in this region postmortem (18,19). A quantitative approach, taking advantage of the cerebellum as a reference region, can be used to calculate the total distribution volume ratio (DVR) as follows: Eq. 4
Eq. 4
where VT(brain) and VT(cerebellum) are total distribution volume in brain regions and the cerebellum, respectively. The BPND is equal to DVR – 1 if the cerebellum is the ideal reference brain region.
In addition, the standardized uptake value (SUV) was calculated from the time-integrated regional radioactivity concentration normalized with injected dose per body weight. The integration intervals were 20–40, 40–60, and 60–90 min. The integration interval of 20–40 min includes the peak equilibrium condition (20), and the integration intervals of 40–60 and 60–90 min correspond to the late part of the time–activity curve. In a simplified approach and because the cerebellum can be used as a reference brain region, the SUV ratio (SUVR) indicating amyloid-β deposits was calculated using the following expression: Eq. 5
Eq. 5
where SUVbrain and SUVcerebellum represent the SUV in brain regions and the cerebellum, respectively.
RESULTS
In this study, no adverse event was observed after intravenous injection of 11C-AZD2184. Representative SUVR images showing the distribution of brain radioactivity after intravenous injection of 11C-AZD2184 are shown for a control subject and an AD patient in Figure 2. There was no conspicuous accumulation of radioactivity in white matter, the same as in a previous report (7). In AD patients, radioactivity in the cerebral cortices was higher than in the control subjects. By visual assessment of the SUVR images, all control subjects appeared negative with regard to specific binding of 11C-AZD2184, whereas all AD patients appeared positive.

Representative SUVR images of 11C-AZD2184 binding in control subject and AD patient. Integration interval was 40–60 min. Corresponding MR images (T1-weighted [T1WI]) are shown. Scale maximum and minimum values are 2.5 and 0 of SUVR. All images are transaxial sections, and anterior is at top of image and subjects' right is at left.
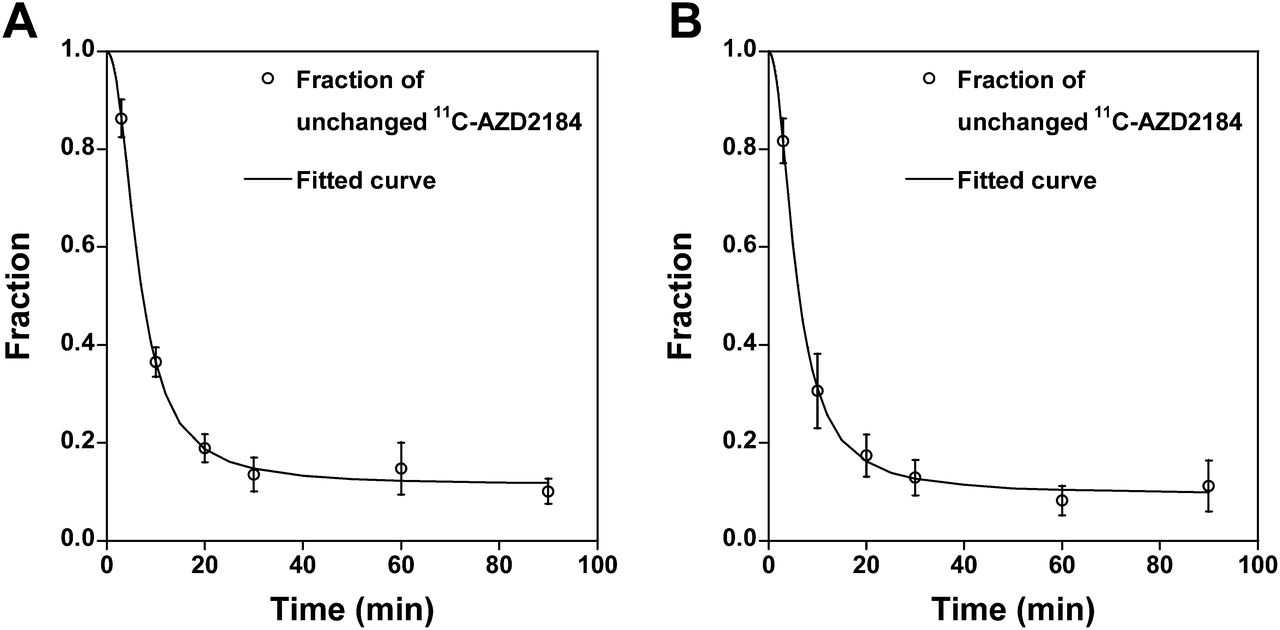
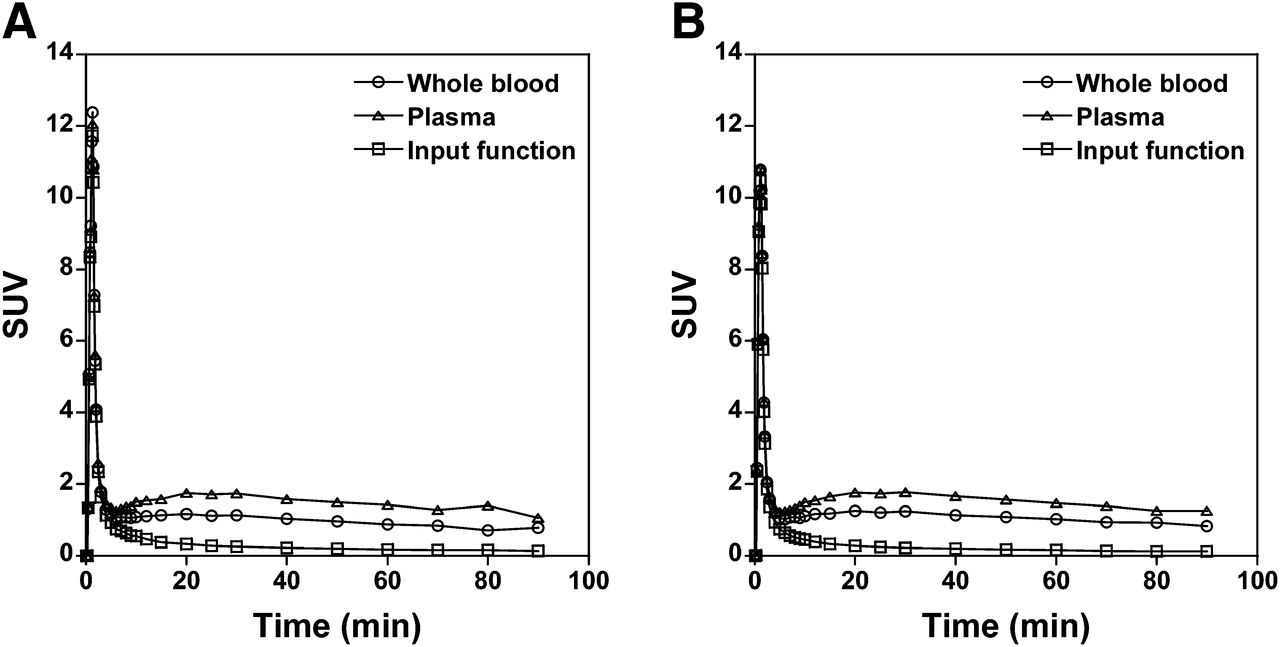
The time courses for the average fraction of radioactivity representing unchanged 11C-AZD2184 in plasma for control subjects and AD patients are shown in Figure 3. Sixty minutes after injection of 11C-AZD2184, the fraction of radioactivity representing unchanged 11C-AZD2184 in plasma was 0.11–0.12. The time courses of the average radioactivity concentration in whole blood and plasma and the time course of the radioactivity concentration of unchanged 11C-AZD2184 in plasma (i.e., arterial input function) are shown in Figure 4.

Time courses of fraction of radioactivity representing unchanged 11C-AZD2184 in plasma for control subjects (A) and AD patients (B). Values are mean ± SD. Fitted curves were obtained using Hill equation.

Time courses of average radioactivity concentration in arterial whole blood and plasma for control subjects (A) and AD patients (B). Time courses of average radioactivity concentration of unchanged 11C-AZD2184 in plasma (i.e., arterial input function) are also shown.
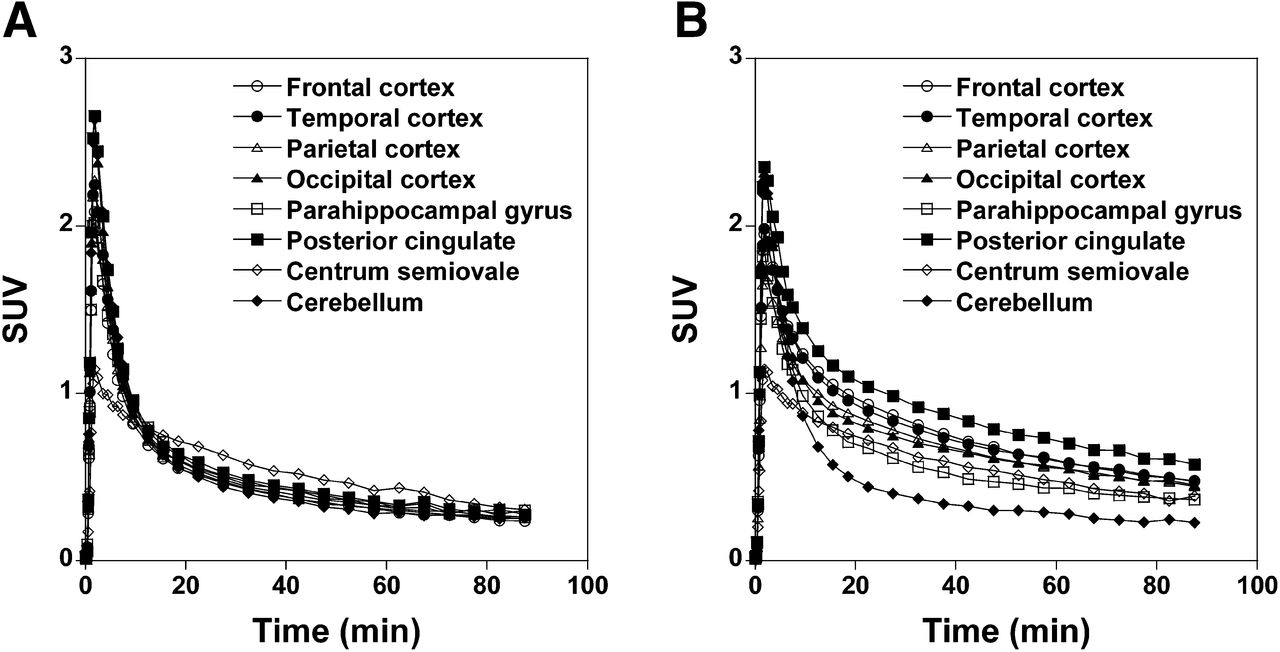
The regional time–activity curves for control subjects and AD patients are shown in Figure 5. At 18.5, 37.5, 57.5, and 87.5 min after injection of 11C-AZD2184, the ratios of regional radioactivity of posterior cingulate to cerebellum were 1.14 ± 0.03, 1.21 ± 0.09, 1.27 ± 0.17, and 1.08 ± 0.27 for control subjects and 2.19 ± 0.22, 2.60 ± 0.57, 2.55 ± 0.49, and 2.52 ± 0.64 for AD patients. In control subjects, radioactivity concentrations in cerebral cortical regions were similar to those for the cerebellum at the end of data acquisition, the same as in a previous report (7). In AD patients, radioactivity concentrations in cerebral cortical regions were higher than in the cerebellum.

Average time–activity curves for brain regions in control subjects (A) and AD patients (B).
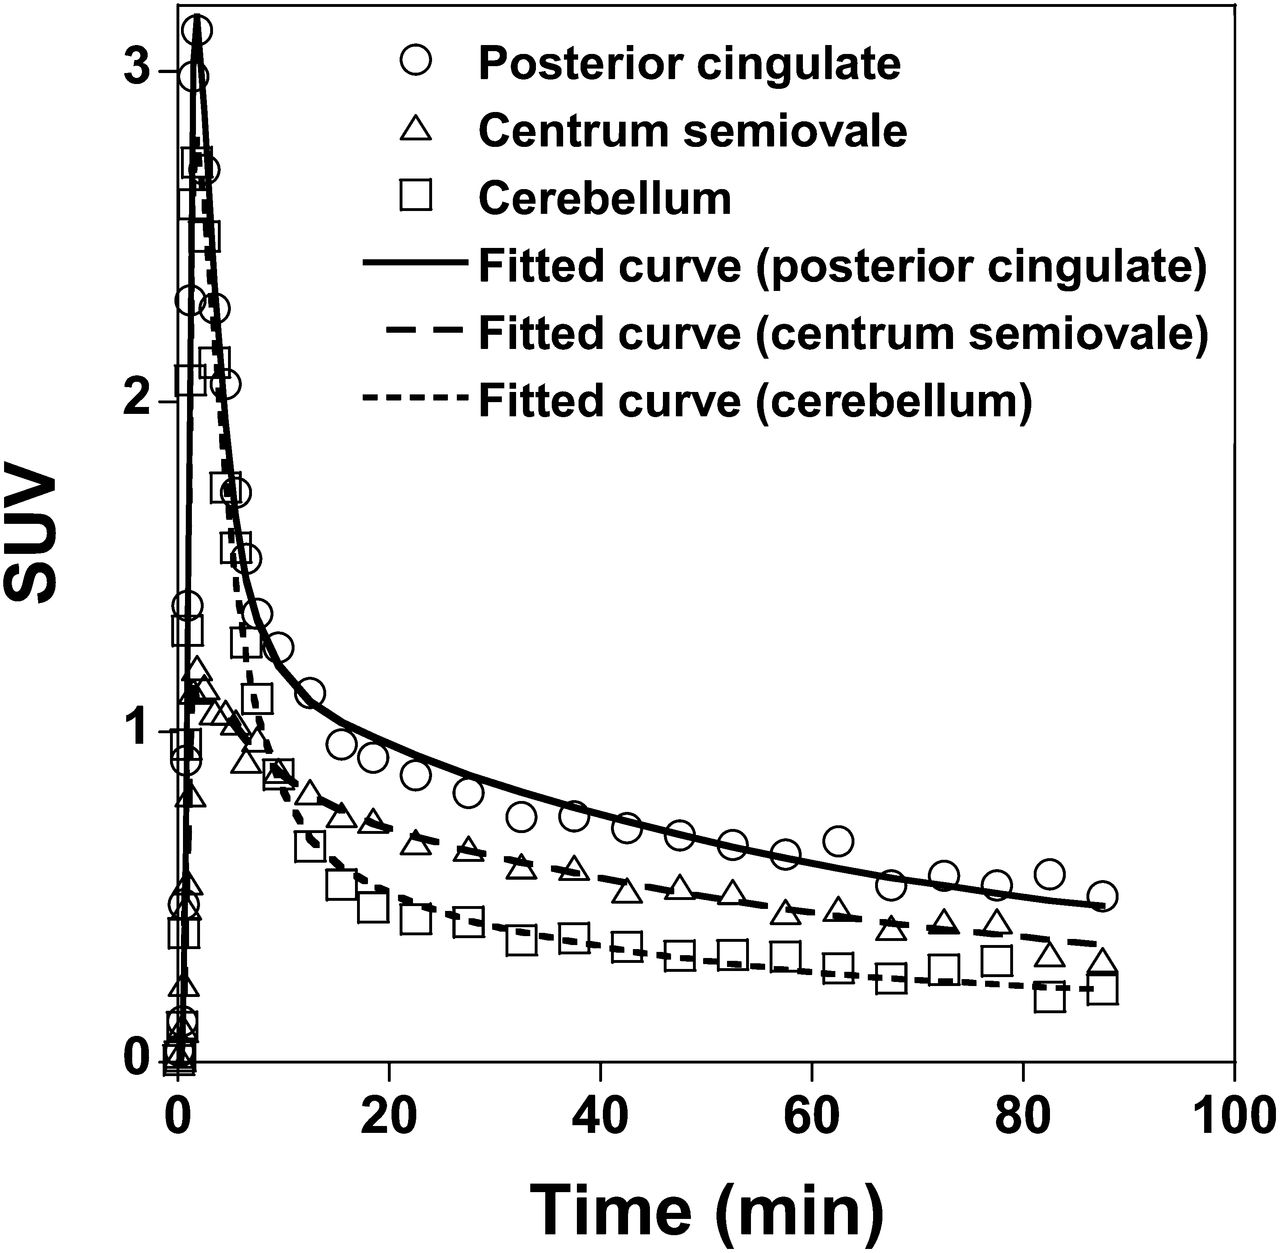
Typical time–activity curves in brain regions of an AD patient and the corresponding fitted curves obtained by kinetic analyses are shown in Figure 6. The time–activity curves in all brain regions could be described by the standard 2-tissue-compartment model.

Typical time–activity curves in brain regions of AD patient and fitted curves obtained using standard 2-tissue-compartment model.
The rate constants and related kinetic parameters for 11C-AZD2184 binding in control subjects and AD patients are given in Tables 2 and 3, respectively. In control subjects, the VT in cerebral cortical regions was similar to that in the cerebellum. In AD patients, VT values were consistently higher in cerebral cortical regions than in the cerebellum. The VT and the DVR in cerebral cortical regions were significantly higher in AD patients than in control subjects (unpaired t test, P < 0.01). The DVR in the centrum semiovale was more than 1 in average for both control subjects and AD patients. No significant differences in VT and DVR were observed for the centrum semiovale between control subjects and AD patients.
Kinetic Parameters Obtained by 2-Tissue-Compartment Model Analysis of 11C-AZD2184 Binding in Control Subjects
Kinetic Parameters Obtained by 2-Tissue-Compartment Model Analysis of 11C-AZD2184 Binding in AD Patients
The SUVR and DVR in control subjects and AD patients are shown in Table 4. The SUVR for each integration interval was at the same level and in agreement with the corresponding DVR value. SUVR and DVR in cerebral cortical regions were significantly higher in AD patients than in control subjects. The relationship between DVR and SUVR is shown in Figure 7. Significant correlations were observed between DVR and SUVR for each integration interval.
SUVRs of 11C-AZD2184 in Control Subjects and AD Patients
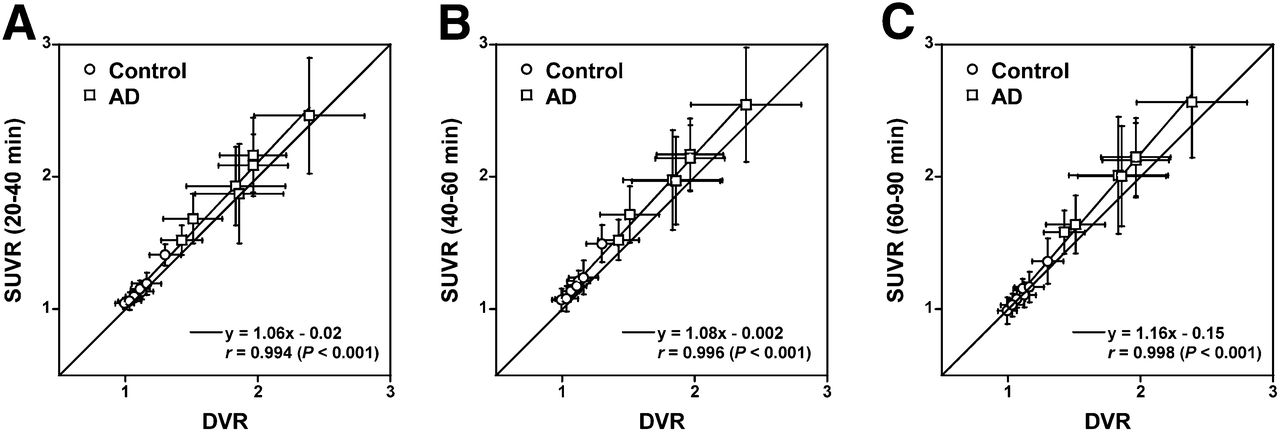
Relationship between DVR and SUVR for integration intervals of 20–40 min (A), 40–60 min (B), and 60–90 min (C). Respective data indicate mean and SD of each ROI.
DISCUSSION
In the present examination of 11C-AZD2184 binding to amyloid-β deposits, there was high binding in the cerebral cortical regions of AD patients in comparison with control subjects, the same as in a previous report (7). The DVR values of 11C-AZD2184 in cerebral cortical regions for both control subjects and AD patients were almost the same level as those of 11C-PIB reported previously (18). Although previously developed radioligands, such as 11C-PIB, show high nonspecific binding in white matter, the white matter binding was not conspicuous for 11C-AZD2184. The SUVs in the white matter were less than 0.5 after 60 min of injection of 11C-AZD2184 in both control subjects and AD patients, and those of 11C-PIB were reported to be more than 1 (4). The regional time–activity curves could be described by the standard 2-tissue-compartment model. The dissociation rate constant k4 was 0.04–0.05 min−1, not zero, indicating reversibility of binding. Thus, it was evident that the kinetic behavior of 11C-AZD2184 is similar to that of established neuroreceptor ligands such as 11C-raclopride (20) and that this radioligand is likely suitable for quantitative analyses using various established approaches.
The white matter binding of 11C-AZD2184 appears lower than that reported for other amyloid radioligands such as 11C-PIB (4), the same as in the previous autoradiographic study with postmortem brain (6). In control subjects, there was no obvious difference between binding in gray and white matter. However, kinetic analysis revealed the DVR to be more than 1 (∼1.3–1.5) in the centrum semiovale, a region that almost entirely consists of white matter, for both control subjects and AD patients. The nature of the binding of amyloid ligand to white matter is not fully understood. It has been reported that 11C-PIB may bind to myelin, which is organized in a β-sheet structure in the same way as amyloid-β deposits (21–23). The proposed binding has low affinity and is likely not saturable because of the large amount of myelin in the brain. In other words, a high concentration of unlabeled ligand would be required to saturate the binding of amyloid radioligands to cerebral white matter (24). Moreover, it has been estimated that ROIs defined for the cerebral cortex contain about 60% of gray matter and 30% of white matter (25). This tissue heterogeneity may affect 11C-AZD2184 binding in the cerebral cortices.
To examine simplified approaches for quantification of 11C-AZD2184 binding, the SUVR was calculated using the cerebellum as a reference brain region, with integration intervals of 20–40, 40–60, and 60–90 min. The SUVR of each integration interval was at the same level and statistically in good agreement with the DVR values obtained by kinetic analysis, although systemic overestimations in SUVR were observed. This cross-validation indicates that 11C-AZD2184 binding can be estimated using a short scanning time and no arterial blood sampling. The nonlinearity and bias of SUVR as compared with DVR are observed in most radiotracers (26,27). However, the fast relative equilibrium of 11C-AZD2184 could be one of the main advantages over 11C-PIB (4). In further study, systemic errors in SUVR of 11C-AZD2184 should be investigated with simulation studies. Although all integration intervals can be used to calculate SUVR, integration intervals of 40–60 and 60–90 min might be more preferable because the early part of the time–activity curve is generally affected by changes in K1 due to changes in cerebral blood flow (20). However, a lack of an early phase of PET data might hamper an adequate coregistration between PET and MR images, especially in control subjects because of a low binding in the white matter.
It has been reported that synaptic loss is associated with nondiffuse plaques, but not with diffuse plaques (28), and that the neuropathology in AD is characterized by cortical neuritic plaque containing dense-cored amyloid deposition (29). 11C-BF227, a recently developed radiotracer for in vivo imaging of amyloid-β, has been considered to bind more preferentially to dense-cored amyloid deposition than 11C-PIB (19). Further research is needed to demonstrate the binding characteristics of 11C-AZD2184 in different types of amyloid plaque.
CONCLUSION
The novel radioligand 11C-AZD2184 provides high-contrast imaging of amyloid-β deposits in brain. The regional kinetics of 11C-AZD2184 binding in control subjects and AD patients could be described by the standard 2-tissue-compartment model. The SUVR calculated from integrated time–activity curves in targeted and reference brain regions can be used as an index of 11C-AZD2184 binding for clinical investigations without arterial input function.
DISCLOSURE
The costs of publication of this article were defrayed in part by the payment of page charges. Therefore, and solely to indicate this fact, this article is hereby marked “advertisement” in accordance with 18 USC section 1734. This study was supported in part by the “Japan Advanced Molecular Imaging Program (J-AMP)” of the Ministry of Education, Culture, Sports, Science and Technology (MEXT), Japanese Government, and a grant-in-aid for Comprehensive Research on Dementia (no. 11103404) from the Ministry of Health, Labor and Welfare. No other potential conflict of interest relevant to this article was reported.
Acknowledgments
We thank Katsuyuki Tanimoto, Takahiro Shiraishi, Kazuko Suzuki, and Izumi Izumida for their assistance in the PET experiments. 5-(6-{[tert-butyl(dimethyl)silyl]oxy}-1,3-benzothiazol-2-yl)pyridin-2-amine (AZD2184) and its precursor 5-(6-(tert-butyldimethyl-silyloxy)benzo[d]thiazol-2-yl)pyridin-2-amine were kindly provided by AstraZeneca R&D, Södertälje, Sweden.
Footnotes
Published online Apr. 14, 2014.
- © 2014 by the Society of Nuclear Medicine and Molecular Imaging, Inc.
REFERENCES
- Received for publication October 10, 2013.
- Accepted for publication January 27, 2013.


