


Abstract
This study evaluated the performance of the Biograph Vision digital PET/CT system according to the NEMA NU 2-2012 standard (published by the National Electrical Manufacturers Association [NEMA]) to allow for a reliable, reproducible, and intersystem-comparable performance measurement. Methods: The new digital PET/CT system features silicon photomultiplier–based detectors with 3.2-mm lutetium oxyorthosilicate crystals and full coverage of the scintillator area. The PET components incorporate 8 rings of 38 detector blocks, and each block contains 4 × 2 mini blocks. Each mini block consists of a 5 × 5 lutetium oxyorthosilicate array of 3.2 × 3.2 × 20 mm crystals coupled to a silicon photomultiplier array of 16 × 16 mm, resulting in an axial field of view of 26.1 cm. In this study, PET/CT system performance was evaluated for conformation with the NEMA NU 2-2012 standard, with additional measurements described in the new NEMA NU 2-2018 standard. Spatial resolution, sensitivity, count-rate performance, accuracy of attenuation and scatter correction, image quality, coregistration accuracy, and time-of-flight performance were determined. Measurements were directly compared with results from its predecessor, the Biograph mCT Flow, using existing literature. Moreover, feasibility to comply with the European Association of Nuclear Medicine Research Ltd. (EARL) criteria was evaluated, and some illustrative patient PET images were obtained. Results: The Biograph Vision showed a transverse and axial spatial resolution of 3.6 and 3.5 mm, respectively, in full width at half maximum at a 1-cm offset from the center of the field of view (measured with a 22Na 0.25-mm point source), a NEMA sensitivity of 16.4 kcps/MBq, and a NEMA peak noise-equivalent count-rate of 306 kcps at 32 kBq/mL. Time-of-flight resolution varied from 210 to 215 as count-rate increased up to the peak noise-equivalent count-rate. The overall image contrast seen with the NEMA image quality phantom ranged from 77.2% to 89.8%. Furthermore, the system was able to comply with the current and future EARL performance criteria. Conclusion: The Biograph Vision outperforms the analog Biograph mCT Flow, and the system is able to meet European harmonizing performance standards.
PET plays a key role in diagnosis and evaluation of medical conditions. Since 1998, when the first hybrid PET/CT system became operational (1), advances in PET technology have been significant. The implementation of fast lutetium oxyorthosilicate crystals (2) allowed for shorter coincidence timing windows and enabled time-of-flight (TOF) imaging (3–5), and the use of an extended axial field of view (FOV) increased volume sensitivity (6).
Evaluation of the physical performance of PET systems using NEMA NU 2-2012 (published by the National Electrical Manufacturers Association [NEMA]) allows for reproducible and accepted comparisons between PET systems (7).
The digital Biograph Vision PET/CT system (Siemens Healthineers) introduces silicon photomultiplier (SiPM)–based detectors with 3.2-mm lutetium oxyorthosilicate crystals and full coverage between the crystal and the SiPMs. The Vision is the third commercially available digital system, with the other two being the Vereos (Philips Healthcare) (8,9) and the Discovery MI (GE Healthcare) (10).
The purpose of this study was to evaluate the performance of the Vision according to both the NEMA NU 2-2012 (7) and the NEMA NU 2-2018 standards (11). Results were compared with data from the analog Biograph mCT Flow system (12). Spatial resolution, sensitivity, scatter fraction, noise-equivalent count-rate (NECR), image quality, and accuracy of attenuation and scatter corrections were evaluated following the NEMA NU-2 2012 protocol. TOF resolution and coregistration accuracy were determined according to the NEMA NU-2 2018 standard. The feasibility of complying with the European Association of Nuclear Medicine Research Ltd. (EARL) criteria was explored, and some first illustrative patient images were obtained.
MATERIALS AND METHODS
Biograph Vision PET/CT System
The Vision combines a 128-slice CT scanner with a whole-body lutetium oxyorthosilicate PET system. The system has a 78-cm bore and 227-kg table capacity.
The PET component contains 8 detector rings and 19 detector electronics assembly units to form a ring. Two adjacent detector blocks per detector electronics assembly unit result in 38 blocks per ring. Each detector block contains a 4 × 2 arrangement of mini blocks. A mini block consists of a 5 × 5 lutetium oxyorthosilicate array of 3.2 × 3.2 × 20 mm crystals coupled to an SiPM array. Each SiPM array is 16 × 16 mm and has 16 output channels.
The arrangement of 4 × 2 mini blocks, with 2 mini blocks in the axial direction, results in a 32-mm axial FOV for 1 block. This configuration, which uses 8 blocks in the axial direction, has a 25.6-cm axial FOV, or 26.1 cm including the packing spaces between the blocks.
The design of the detector is based on a square array of small crystals whose area is fully covered by SiPM detector elements, exploiting the full potential of SiPMs. The 3.2-mm crystal size allows for a high system spatial resolution, whereas the full coverage optimizes light collection and enables improved timing resolution and signal-to-noise ratio (13).
Measurements
Performance measurements included spatial resolution, scatter fraction, sensitivity, count-rate performance, image quality, coregistration accuracy, and timing resolution All measurements were conducted according to the NEMA NU 2-2012 and NEMA NU 2-2018 standards. Acquisition and reconstruction protocols, as well as NEMA analysis software, were provided by the manufacturer. All reported metrics conform with the specifications and definitions provided in the NEMA NU 2 standards.
Spatial Resolution
NEMA NU 2-2012 specifies using a 18F-FDG point source smaller than 1 × 1 × 1 mm. However, for measuring the spatial resolution on the Vision with smaller crystals, a smaller point source could improve test results (14). NEMA NU 2-2018 therefore recommends purchasing a 22Na point source (11). Thus, a 74-kBq, 0.25-mm-diameter spheric 22Na point source (Eckert and Ziegler Isotope Products) was used.
To comply with the NEMA NU 2-2012 standard, measurements were also performed using an 18F-FDG point source. At the start of data acquisition, a point source of 3.7 kBq of 18F-FDG with a length of about 0.3 mm was prepared in a 0.5-μL syringe (Hamilton Co.). The activity at the start of acquisition was sufficiently low to keep dead-time losses and randoms below 5% of total events. Data were acquired at several positions in the FOV (in x, y, and z directions of 0, 1, and 3.3 cm [≈⅛ FOVZ]; 0, 1, and 13 cm [≈½ FOVZ]; 0, 10, and 3.3 cm; 0, 10, and 13 cm; 0, 20, and 3.3 cm; and 0, 20, and 13 cm, respectively). At least 2 × 10⁶ coincidence counts were acquired in each position.
The obtained sinogram data were Fourier-rebinned and reconstructed by filtered backprojection using only a standard ramp filter into a 880 × 880 × 307 matrix with a 0.8 × 0.8 × 0.8 mm voxel size. The data were reconstructed without attenuation and scatter correction. The spatial resolution was determined according to NEMA NU 2-2012 as the full width at half maximum (FWHM) of the point-spread function (PSF) (7).
Scatter Fraction, Count Losses, and Randoms Measurement
The phantom used for these measurements was a 70-cm-long polyethylene cylinder (20-cm diameter), with a line source inserted axially into the cylinder 4.5 cm radially from the center. At the start of data acquisition, the line source was filled with 1.2 GBq of 18F-FDG to achieve count-rates beyond the expected peak of the NECR. Data were acquired for over 12 h, resulting in 35 frames, each with a 240-s acquisition time and an interframe delay of 960 s. To account for randoms, online randoms subtraction was applied using the delayed-coincidence-time-window technique (15). Subsequently, scatter fraction and NECR were determined (7).
Sensitivity
Sensitivity was measured using a 70-cm-long polyethylene tube (inner diameter, 1 mm; outer diameter, 3 mm) filled with 5.07 MBq of 18F-FDG (at acquisition start) and placed inside 5 concentric aluminum sleeves of equal length with known diameters (7). Five data sets were acquired associated with each of the 5 sleeves (starting with all 5 aluminum sleeves and finishing with a single sleeve) for 300 s each. The measurements were conducted at the center of the transaxial FOV and repeated at a 10-cm radial offset. Randoms subtraction was applied using the delayed-coincidence-time-window measurement. Next, the system sensitivity was computed (7).
Accuracy of Count Losses and Randoms Corrections
This evaluation used data acquired from the scatter fraction and count-rate measurements. Data were corrected for dead time, randoms, scatter, and attenuation (7). The parameters of the low-dose CT scan used for attenuation correction were an x-ray tube current of 80 mAs, a tube voltage of 120 keV, and a spiral pitch factor of 0.8. Scatter was corrected using the extended single-scatter simulation algorithm (16), which discriminates the scattered annihilation radiation according to its differential TOF.
Subsequently, the corrected data were reconstructed using the standard provided whole-body reconstruction algorithm, that is, an ordinary Poisson ordered-subset expectation maximization (OP-OSEM) 3-dimensional (3D) iterative algorithm (17) with 8 iterations, 5 subsets, and no filtering. An image matrix size of 220 × 220 was used. By extrapolating the true rate for low activity concentrations (where count losses and randoms can be neglected), count-rate accuracy was estimated.
Image Quality, Accuracy of Attenuation, and Scatter Corrections
The PET NEMA NU2 image-quality phantom (IQ phantom) (PTW) was used to evaluate image quality. The background activity concentration at the start of data acquisition was 5.7 kBq/mL 18F-FDG. The 4 smallest spheres were filled with a sphere-to-background ratio of 8:1 for the first set of scans and 4:1 for the second set of scans. The remaining 2 largest spheres were filled with nonradioactive water. The IQ phantom was positioned with all spheres aligned in the axial and transaxial center of the FOV. For simulation of a clinical situation with activity outside the FOV, the cylindric scatter phantom was placed axially next to the IQ phantom (7). The line source inside the scatter phantom was filled with approximately 116 MBq of 18F-FDG at the start of both data acquisitions.
Two sequential measurements of 240 s each were acquired for a single bed position after a low-dose CT scan for attenuation correction. Acquisitions were done to simulate a whole-body scan (emission and transmission) of 100 cm total axial imaging distance in 30 min of emission imaging. All data were corrected for random coincidences (smoothed random correction), normalization, decay, dead-time losses, scatter, and attenuation. The data were reconstructed using an OP-OSEM 3D-iterative algorithm with 8 iterations and 5 subsets, applying PSF and TOF into a 440 × 440 matrix with a voxel size of 1.6 × 1.6 × 1.6 mm. The percentages contrast obtained for hot and cold spheres, the background count variability for each sphere, and the accuracies of attenuation and scatter corrections were evaluated.
Coregistration Accuracy
For measurement of coregistration accuracy, a vial was filled with 59.6 MBq of 18F-FDG activity (in 0.1 mL at data acquisition start) and CT contrast (240 mg/mL) to a volume of no more than 1.4 mL. In total, 115 kg in nine 11.5-kg increments (which includes the weight of the 11.5-kg L-fixture) were placed on the patient bed. The foam holders provided by the manufacturer were positioned on the L-fixture at 6 locations, 3 points on each of 2 transaxial planes. In the transverse direction (with the coordinate system origin x and y = 0 and 0 cm, respectively), the foam holders were placed at nominal locations of 0 and 1 cm, 0 and 20 cm, and 20 and 0 cm on the x and y axes, respectively. In the axial direction (with the coordinate system origin z = 0, located at the edge of the PET axial FOV), the foam holders were placed in the center of the PET axial FOV (z = ½ PET axial FOV) and at 5 and 100 cm from the tip of the patient table (11). Per location, a low-dose CT scan was performed first and followed by a 3-min PET scan. The total of 6 measurements was performed to determine the centroid within the PET and CT data sets and, subsequently, to calculate the length of the 3D vector between the CT centroid and the PET centroid (i.e., the coregistration error) (11).
Timing Resolution
The TOF resolution was calculated using the acquired scatter data used for NECR performance, according to a new proposed method (11,18). The timing resolution was calculated as the FWHM of the time distribution of events, after correction for scatter, randoms, and the position of the line source.
EARL Performance
EARL performance on the Vision was measured to evaluate its ability to meet current EARL guidelines and foreseen 2019 EARL guidelines (19–22).
Measurements were conducted according to EARL standard operating procedures (23). The images were reconstructed using an OP-OSEM 3D-iterative algorithm with 4 iterations and 5 subsets, applying TOF, into an image matrix size of 220 × 220, resulting in a voxel size of 3.3 × 3.3 × 1.6 mm. This reconstruction was repeated with 8 iterations, a 5-mm FWHM gaussian filter, and an image matrix size of 220 × 220. Additional reconstructions applied resolution modeling, with and without a 7-mm FWHM gaussian filter and with matrix sizes of both 220 × 220 and 440 × 440. Reconstructions were performed with corrections for attenuation, scatter, normalization, decay, and dead time. Moreover, all (nonsmoothed) reconstructed images were filtered using gaussian kernels with a FWHM ranging from 1 to 10 mm in 1-mm steps to derive the optimal combination of reconstruction methods, settings, and filtering to achieve EARL-compliant performance. The latter procedure will allow the definition of EARL-compliant reconstruction protocols for the Vision.
To provide the reader with insight on a possible activity or scan-time reduction that may be applied in clinical settings, EARL decay measurements were performed according to a previously published method (24).
Patient Study
A patient study is included to provide the reader with a first impression on clinical performance. We do not intend to provide a detailed and valid intersystem comparison.
A 67-y-old woman (1.64 m tall and weighing 73.1 kg) diagnosed with parkinsonism was injected with 200 MBq of 18F-FDG. At 30 min after injection, a brain PET/CT study was first performed on an mCT system for 15 min and then repeated on the Vision (∼5 min after the completion of the mCT study). Data from the mCT were reconstructed using 3D-TOF OP-OSEM with 6 iterations, 21 subsets, and resolution modeling. No filter was used, and the resulting image size was 400 × 400 with a voxel size of 2 × 2 × 2 mm. Data acquired on the Vision were reconstructed using 3D-TOF OP-OSEM with 8 iterations and 5 subsets, with resolution modeling into a 440 × 440 image matrix with a voxel size of 1.6 × 1.6 × 1.6 mm.
Another patient, a 56-y-old woman (1.54 m tall and weighing 67.3 kg) diagnosed with metastasized non–small cell lung carcinoma was injected with 215 MBq of 18F-FDG. At 60 min after injection, a whole-body PET/CT study was performed on an mCT system using 3-min PET acquisitions per bed position. Data were reconstructed using 3D-TOF OP-OSEM with 3 iterations, 21 subsets, and resolution modeling. A gaussian filter of 5 mm was applied to the reconstructed images, and the resulting image size was 400 × 400 with a voxel size of 2 × 2 × 2 mm. Subsequently, measurements were repeated on the Vision using 3-min PET acquisitions per bed position. The vendor-recommended reconstruction protocol was applied, that is, 3D-TOF OP-OSEM with 4 iterations, 5 subsets, resolution modeling, no filtering, an image matrix size of 220 × 220, and a voxel size of 3.3 × 3.3 × 1.6 mm.
The patient study was approved by the medical ethics review board of the University Medical Center Groningen, and both patients provided written informed consent.
RESULTS
NEMA Measurements
Spatial Resolution, Sensitivity, Coregistration Accuracy, and Timing Resolution
The spatial resolutions are summarized in Table 1, listing FWHM and full-width-at-tenth-maximum values at 1, 10, and 20 cm. The sensitivity values for both the 0- and the 10-cm off-center position, the maximum coregistration error, and the calculated timing resolution are also given in Table 1. These results show an average sensitivity increase of 70.3% for the Vision compared with the mCT Flow. The observed TOF of 210 ps worsens only 5 ps from low count-rate up to peak NECR (Table 1; Fig. 1). In addition, the axial sensitivity profiles for both the 0- and the 10-cm off-center positions are shown in Figure 2.
NEMA NU 2-2012 Measurement Results and Some Additional Results According to NEMA NU 2-2018 Standard Acquired on Vision with Direct Comparison to Published Results from mCT Flow (12)

(A) Plots of prompts (dotted line), randoms (dashed line), trues (gray solid line), scatter event rates (dashed-dotted line), and NECR (black solid line). (B) Scatter fraction as function of activity concentration. (C) NECR (dashed-dotted line) and TOF (dashed line) as function of activity concentration.
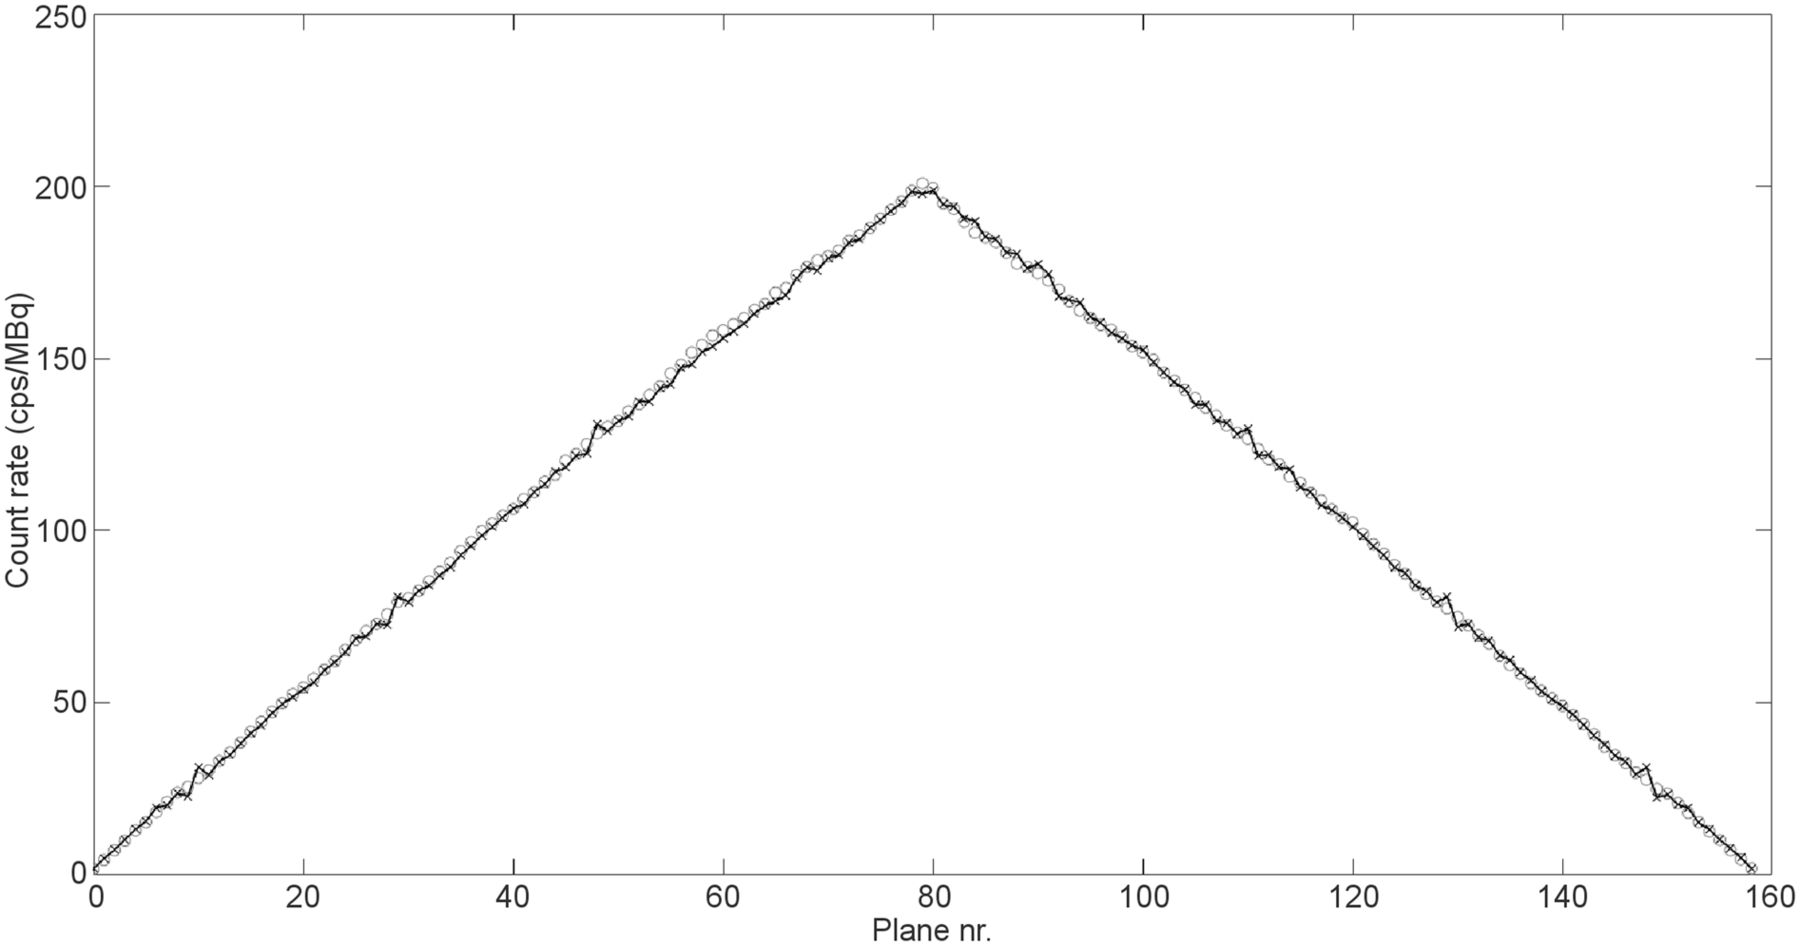
Axial sensitivity profiles for both 0-cm off-center position (circles) and 10-cm off-center position (crosses).
Scatter Fraction, Count Losses, and Randoms Measurement
Peak NECR and scatter fractions at peak NECR and at low activity levels are given in Table 1. Figure 1 shows plots of the trues, randoms, prompts, and scatter event rates next to the scatter fraction curve as a function of activity. In addition, the NECR as a function of activity concentration is shown.
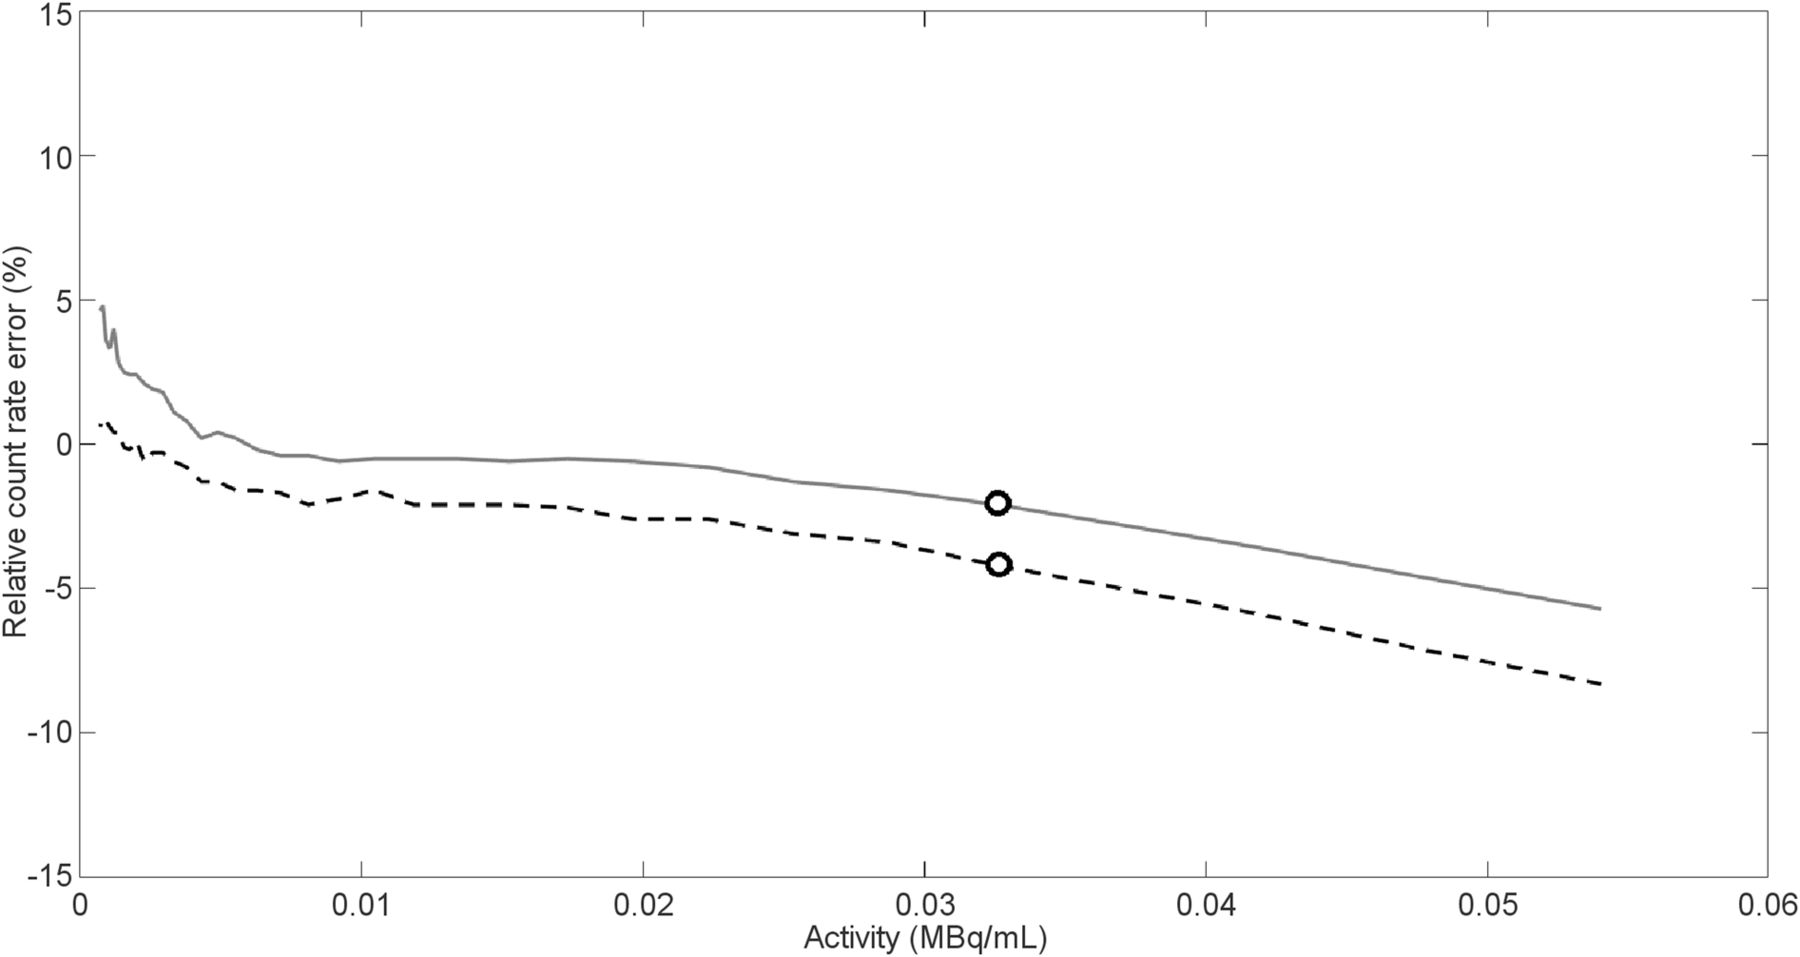
The trues rate was 1,306 kcps at 54 kBq/mL, and the accuracy mean bias was 2.9%. Figure 3 shows a plot of the maximum and minimum relative count-rate error for the different activity concentrations.

Maximum (solid line) and minimum (dashed line) relative count-rate error for different activity concentrations, and maximum and minimum bias values (circles) at activity concentration of peak NECR.
Image Quality, Accuracy of Attenuation, and Scatter Corrections
Tables 2 and 3 show the percentage contrast, background variability, and average lung residual for the 8:1 and 4:1 sphere-to-background ratios.
Contrast, Background Variability, and Average Lung Residual for 8:1 Sphere-to-Background Ratio on Vision, Directly Compared with Published Results from mCT Flow
Contrast, Background Variability, and Average Lung Residual for 4:1 Sphere-to-Background Ratio on Vision, Directly Compared with Published Results from mCT Flow
Additional Measurements
EARL Compliance
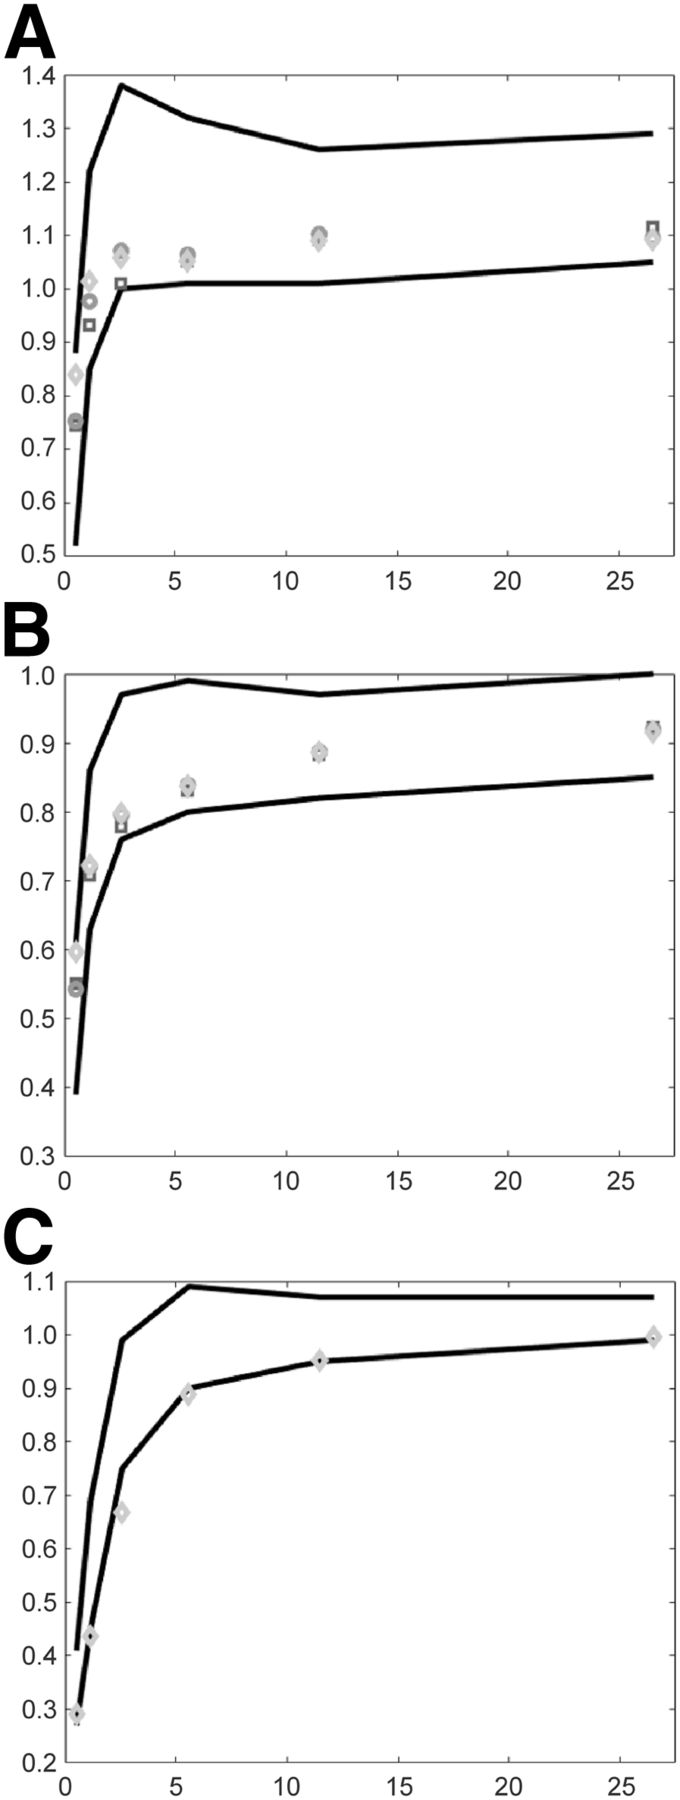
Figures 4 and 5 show SUV recovery coefficients as a function of the sphere sizes in the NEMA IQ phantom for various reconstruction protocols according to the current EARL performance criteria (19,20) and foreseen new EARL performance criteria (21,22), respectively.
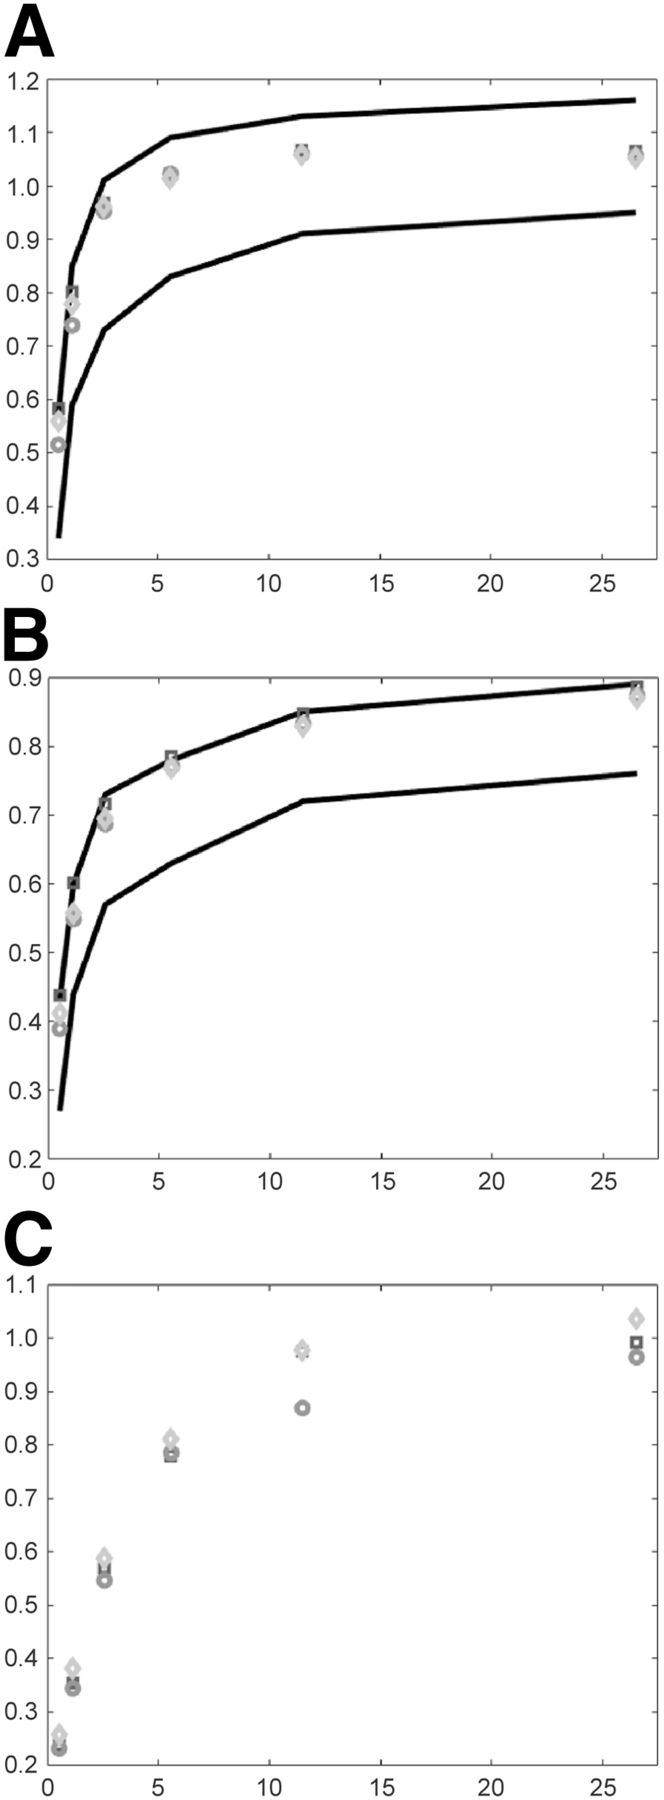
SUV recovery coefficients as function of sphere size in IQ phantom for various reconstruction protocols. Square = 3D-TOF OP-OSEM with 4 iterations, 5 subsets, and 5-mm gaussian filter into matrix size of 220 × 220; circle = “square” but with 7-mm gaussian filter and addition of PSF; diamond = “circle” but with image size of 440 × 440. According to EARL specifications, SUVmax (A), SUVmean (B), and SUVpeak (C) recoveries are shown. Lines illustrate upper and lower limits. SUVpeak limits are not provided here since these are not included in current EARL guidelines.

SUV recovery coefficients as function of sphere sizes in NEMA NU 2 IQ phantom for various reconstruction protocols. Square = 3D-TOF OP-OSEM with 4 iterations, 5 subsets, and 4-mm gaussian filter into matrix size of 220 × 220; circle = “square” but with 5-mm gaussian filter and addition of PSF; diamond = “circle” but with image size of 440 × 440. According to EARL 2019 specifications, SUVmax (A), SUVmean (B), and SUVpeak (C) recoveries are shown. Lines illustrate upper and lower limits.
EARL compliance was achieved by using 3D-TOF OP-OSEM with 4 or 8 iterations and 5 subsets, with a 5-mm FWHM gaussian filter and an image matrix size of 220 × 220, or by using 3D-TOF OP-OSEM with resolution modeling and the same reconstruction settings as above but with a 7-mm FWHM gaussian filter and an image matrix size of 220 × 220 or 440 × 440. For the foreseen new EARL specifications, compliance can be achieved either by using 3D-TOF OP-OSEM with 4 or 8 iterations and 5 subsets, a matrix of 220 × 220, and no additional filtering or by using 3D-TOF OP-OSEM with resolution modeling, a gaussian filter of 5-mm FWHM, and an image matrix size of either 220 × 220 or 440 × 440, although at present borderline results were seen using SUVpeak recoveries. There is no SUVpeak upper and lower limit according to current EARL specifications; therefore, these limits cannot be shown in Figure 4C.
For illustrative purposes, the SUVmax and SUVmean recovery coefficients without filtering, and with and without additional PSF resolution modeling (not EARL-compliant), are shown in Supplemental Figures 1 and 2 (supplemental materials are available at http://jnm.snmjournals.org). In addition, the results of the EARL decay measurements (24) to provide first insights on possible activity or scan time reduction are shown in Supplemental Tables 1–3; these results suggest that for EARL-compliant reconstructions, a reduction in the activity and scan duration product by a factor of 8, compared with current recommendations, seems feasible.
Example Patient Images
Supplemental Figures 3 and 4 illustrate some clinical example images obtained with the Vision and the mCT.
DISCUSSION
NEMA Measurements
Spatial Resolution
The spatial resolution (FWHM) of the Vision (with 18F-FDG) was better than that of the mCT Flow. The transaxial spatial resolution of the Vision was better than that of the mCT Flow, at 0.6, 0.6, and 1.2 mm at the 1-, 10-, and 20-cm radial positions, respectively. This improvement can be explained by the smaller 3.2-mm lutetium oxyorthosilicate crystals, with respect to the 4-mm crystals of the mCT Flow. The improvement in axial resolution away from the center of the system is probably to be attributed to an advanced rebinning technique introduced in the Vision (25).
With such small crystals, the resolution measurement depends on the ability to build a smaller point source. As the mean positron range of 22Na and 18F-FDG is similar (26), the difference in spatial resolution measurement can be attributed to the source dimension. Preparing a small source with 18F-FDG is challenging; therefore, the NEMA NU 2-2018 recommends purchasing a 22Na source to measure the spatial resolution. Hence, we also used the 22Na point source in our experiments.
Sensitivity and Timing Resolution
The improved TOF resolution of 210 ps can be translated to more effective noise reduction or better contrast enhancement in comparison to the mCT Flow (27).
The higher sensitivity of the Vision may allow for reduction in dose or scan time in future clinical application (Supplemental Tables 1–3 provide first insights regarding dose or scan-time reduction).
Scatter Fraction, Count Losses, and Randoms Measurement
The peak NECR increased 65% when measured on the Vision, compared with the mCT Flow. Because of the extended axial FOV of the new system and a greater acceptance angle, a small increase in scatter fraction can be expected. The true counts captured on the Vision have increased with respect to its predecessor (∼770 kcps at 20 kBq/mL for the Vision and 440 at 20 kBq/mL for the mCT Flow). The increase in true count-rate is assumed to result from a lower dead time and a higher sensitivity on the Vision than on the mCT Flow; therefore, the Vision relatively outperforms its predecessor on this aspect.
Image Quality and Quantification
A higher percentage contrast for the 10-mm sphere was seen. This higher contrast recovery for the smallest sphere is likely caused by the Gibbs artifact from the use of PSF reconstructions.
Additional Measurements
EARL
By using standard available reconstruction settings, it is possible to set up a reconstruction protocol, both with and without resolution modeling, that complies with both current and foreseen future EARL specifications. The default whole-body reconstruction protocol may result in voxels smaller than 3 mm in any direction (especially slice thickness), which is noncompliant with current EARL criteria (19,20). In the foreseen new EARL performance criteria, this restriction will no longer be applicable and the use of PSF reconstruction will be permitted (21,22).
Patient Study
The 2 initial PET studies that were performed were intended to provide the reader with a first glance at the image quality obtained with the Vision and should not be considered a scientifically valid comparison of clinical system performance.
CONCLUSION
The Vision had a transverse and axial spatial resolution of 3.6 and 3.5 mm, respectively, at a 1-cm offset from the center of the FOV (measured with a 22Na source), compared with respective values of 4.3 and 4.3 mm for the mCT Flow. Moreover, compared with the mCT Flow, the Vision had a 70.3% increase in sensitivity, a 65% higher peak NECR, and a higher contrast recovery. Finally, the timing resolution improved from 540 ps on the mCT Flow to 210 ps on the Vision. The Vision outperformed the analog mCT Flow in every NEMA performance test that was evaluated.
DISCLOSURE
The research presented in this study is financially supported by Siemens Molecular Imaging under a collaborative research contract. No other potential conflict of interest relevant to this article was reported.
Footnotes
Published online Jan. 10, 2019.
- © 2019 by the Society of Nuclear Medicine and Molecular Imaging.
REFERENCES
- Received for publication May 31, 2018.
- Accepted for publication December 10, 2018.


Jump to section
Related Articles
Cited By...
- Performance Characteristics of a New Generation 148-cm Axial Field-of-View uMI Panorama GS PET/CT System with Extended NEMA NU 2-2018 and EARL Standards
- SNMMI Procedure Standard/EANM Practice Guideline for Brain [18F]FDG PET Imaging, Version 2.0
- Diagnostic Performance of [18F]AlF-Thretide PET/CT in Patients with Newly Diagnosed Prostate Cancer Using Histopathology as Reference Standard
- Performance Evaluation of the uMI Panorama PET/CT System in Accordance with the National Electrical Manufacturers Association NU 2-2018 Standard
- Performance Characteristics of a New-Generation Digital Bismuth Germanium Oxide PET/CT System, Omni Legend 32, According to NEMA NU 2-2018 Standards
- Long Versus Short Axial Field of View Immuno-PET/CT: Semiquantitative Evaluation for 89Zr-Trastuzumab
- Lesion Quantification Accuracy of Digital 90Y PET Imaging in the Context of Dosimetry in Systemic Fibroblast Activation Protein Inhibitor Radionuclide Therapy
- High-Resolution Silicon Photomultiplier Time-of-Flight Dedicated Head PET System for Clinical Brain Studies
- Continuous Bed Motion in a Silicon Photomultiplier-Based Scanner Provides Equivalent Spatial Resolution and Image Quality in Whole-Body PET Images at Similar Acquisition Times Using the Step-and-Shoot Method
- Performance Characteristics of the Biograph Vision Quadra PET/CT System with a Long Axial Field of View Using the NEMA NU 2-2018 Standard
- The Annual Journal Impact Factor Saga
- Performance Evaluation of the uEXPLORER Total-Body PET/CT Scanner Based on NEMA NU 2-2018 with Additional Tests to Characterize PET Scanners with a Long Axial Field of View
- A Stepping-Stone to Fully Integrated Whole-Body PET/MRI (perspective on "Performance Measurements of the Siemens mMR Integrated Whole-Body PET/MR Scanner" J Nucl Med. 2011;52:1914-1922)
- Benefit of Improved Performance with State-of-the Art Digital PET/CT for Lesion Detection in Oncology
- High-Resolution Depth-Encoding PET Detector Module with Prismatoid Light-Guide Array
- Performance of Digital PET Compared with High-Resolution Conventional PET in Patients with Cancer
- Image Quality and Activity Optimization in Oncologic 18F-FDG PET Using the Digital Biograph Vision PET/CT System
- Image Quality and Semiquantitative Measurements on the Biograph Vision PET/CT System: Initial Experiences and Comparison with the Biograph mCT