


Abstract
Functional MRI (fMRI) studies reported disruption of resting-state networks (RSNs) in several neuropsychiatric disorders. PET with 18F-FDG captures neuronal activity that is in steady state at a longer time span and is less dependent on neurovascular coupling. Methods: In the present study, we aimed to identify RSNs in 18F-FDG PET data and compare their spatial pattern with those obtained from simultaneously acquired resting-state fMRI data in 22 middle-aged healthy subjects. Results: Thirteen and 17 meaningful RSNs could be identified in PET and fMRI data, respectively. Spatial overlap was fair to moderate for the default mode, left central executive, primary and secondary visual, sensorimotor, cerebellar, and auditory networks. Despite recording different aspects of neural activity, similar RSNs were detected by both imaging modalities. Conclusion: The results argue for the common neural substrate of RSNs and encourage testing of the clinical utility of resting-state connectivity in PET data.
- brain connectivity
- positron emission tomography
- independent component analysis
- multimodal imaging
- glucose metabolism
Functional MRI (fMRI) studies posit the presence of resting-state networks (RSNs), coherent blood-oxygen-level-dependent (BOLD) signal fluctuations at rest in several neuroanatomic systems. These networks can be roughly subdivided into those supporting higher order cognitive and lower order sensory and motor functions. The former group includes the medial prefrontal-medial parietal default mode network (DMN), frontoparietal central executive network (CEN), and cingulo-opercular salience network. Such so-called neurocognitive RSNs (1) were repeatedly shown to be altered in several neuropsychiatric disorders (2). Still, these findings have found only limited applicability in clinical settings so far. Among the main reasons discussed are a low signal-to-noise ratio and reproducibility of findings at a single subject level (3).
18F-FDG PET has been widely used in clinical routine in the field of dementing and movement disorders (4,5). Neurometabolic coupling, the linkage of synaptic activity with glucose consumption (6), is a key physiologic concept of brain function and the rational basis of 18F-FDG PET (7). As compared with fMRI, 18F-FDG PET captures neural activity that is in steady state at a longer time span (minutes to hours) and is less dependent on neurovascular coupling. These factors may contribute to the overall robustness of 18F-FDG PET findings at a single subject level.
Although metabolic covariance patterns have been a relevant research topic for a long time (8–10), RSNs could be identified in 18F-FDG PET data only recently (11,12). Yet, these studies either focused on a single network (12) or were limited to PET modality, whereas fMRI was performed in a different group of subjects (11). Given a dynamic character of RSNs with their dependence on, for example, the current cognitive state and mood of the person (13,14), fMRI and PET-based RSNs may show a limited comparability if acquired at different time points.
The aim of this study was to identify RSNs in 18F-FDG PET data and to compare their spatial pattern with those obtained from simultaneously acquired fMRI data in the same group of healthy subjects.
MATERIALS AND METHODS
Details about subjects and data acquisition can be found elsewhere (15). In brief, 22 healthy, right-handed subjects (15 men, 7 women; mean age ± SD, 54.5 ± 10.0 y) were included in this study. The participants gave written informed consent to undergo procedures approved by the ethics review board of the Klinikum Rechts der Isar, Technische Universität München. All subjects had no history of psychiatric or neurologic conditions or use of psychoactive medications, and had no pregnancy or renal failure.
The participants were imaged at rest in a dimmed environment on a hybrid PET/MR Siemens Biograph mMR scanner. PET data for the present analyses were acquired in list-mode for 10 min 30 min after injection with the following parameters: 128 slices (gap, 0.5 mm); matrix size, 192 × 192; and voxel size, 3.7 × 2.3 × 2.7 mm3. Although the PET data are typically acquired half an hour after injection, the image represents the state of cerebral glucose consumption at the time of and immediately after the tracer injection. Accordingly, fMRI data acquisition started together with a bolus injection of 175 ± 12 MBq of 18F-FDG (15). Echoplanar imaging data were acquired using the following parameters: repetition time, 2,000 ms; echo time, 30 ms; angle, 90°; 35 slices (gap, 0.6 mm); matrix size, 64 × 64; voxel size, 3.0 × 3.0 × 3.0 mm3. Each measurement consisted of 300 acquisitions in interleaved mode with a scan time of 10 min and 8 s.
The fMRI data have been preprocessed as in detail described elsewhere (15,16) using the DPARSF toolbox (17). PET images were spatially normalized to a study-specific 18F-FDG PET template (in the Montreal Neurological Institute space) based on PET images of all study subjects (18). As part of the normalization, PET images were resampled to the voxel size of the echoplanar images of 3.0 × 3.0 × 3.0 mm3. Both echoplanar and PET images were smoothed with a gaussian kernel of 12 mm in full width at half maximum. Independent component analyses (ICA) were performed using the GIFT toolbox (19). Hereby, a series of individual (n = 22) PET images was analyzed together to identify components that showed common subject covariation (12,20,21). As is appropriate for fMRI data, echoplanar images were subjected to group ICA (22).
Twenty components were extracted from both fMRI and 18F-FDG PET data using the same brain mask. Because the PET dataset consisted of 22 images (subjects), the maximal number of possible components was 21. Spatial correlation maps were calculated and thresholded with a z score of 2.0. The rating of components as meaningful or noise was based on a visual reading. Meaningful components were considered spatial maps with major clusters located in gray matter. The overlap between binarized maps was quantified using the Dice similarity coefficient. This well-established metric (23,24) measures volume overlap between 2 regions divided by their mean volume. It is interpreted as follows: <0.2, poor; 0.2–0.4, fair; 0.4–0.6, moderate; 0.6–0.8, good; and >0.8, excellent agreement.
As part of a dedicated imaging protocol (15), 11 subjects were examined with eyes open, another 11 with eyes closed. To examine whether this different condition influenced the results, ICA was in addition performed within each subgroup separately (supplemental materials [available at http://jnm.snmjournals.org]). Except for the lower number of independent components (n = 10) due to the smaller subject group, this analysis was performed in a manner identical to the main analysis above.
RESULTS
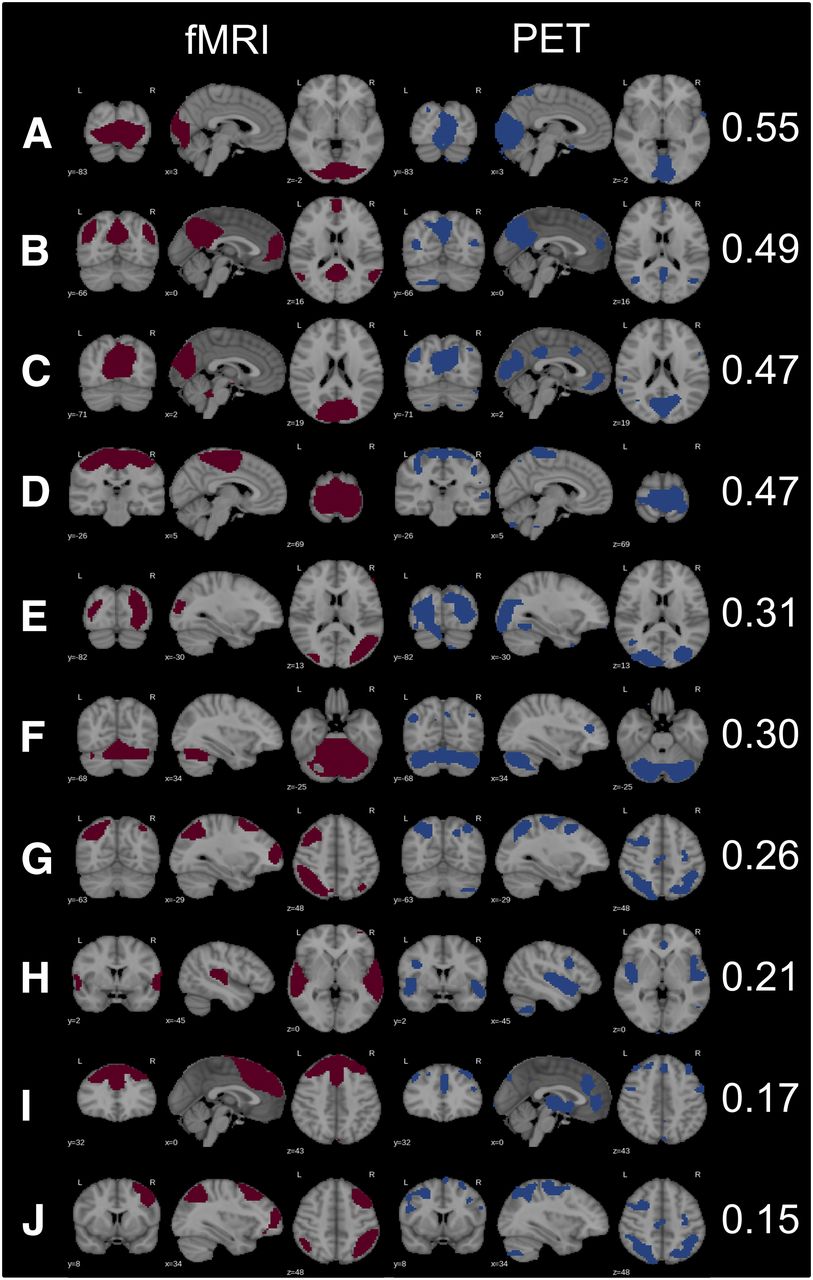
Among 20 independent components, 13 were rated as meaningful RSNs in PET data. In fMRI data, 17 meaningful networks were identified. Ten similar RSNs could be found in both modalities, with the right and left CENs being captured as one independent component by PET (Fig. 1). Spatial overlap was moderate for primary visual, sensorimotor, and DMN. A fair spatial overlap was found for secondary visual, cerebellar, left CEN, and auditory networks. Executive control and right CEN overlapped in fMRI and PET data only poorly.

Matched RSNs in fMRI and PET data with corresponding Dice coefficients: primary visual posterior (A), DMN (B), primary visual (posterior) (C), sensorimotor (D), secondary visual (E), cerebellar (F), central executive right (G), auditory (H), executive control (I), central executive left (J). Because right and left CENs were captured as 1 independent component in PET data, G and J for PET are the same.
Seven RSNs were found exclusively in fMRI, whereas 4 were found exclusively in PET data (Fig. 2). The former networks included salience, spatial attention, (additional) primary visual, anterior DMN, anterior insular, temporopolar, and lateral motor networks. PET-based–only networks included a subcortical network covering the putamen, thalamus, and brain stem and a network with clusters in the ventral striatum. Further PET-based–only RSNs were (additional) secondary visual network and a network covering the mesial parietal and prefrontal cortex (Fig. 2). Noise components were less common in fMRI (n = 3) than in PET (n = 7) data (Fig. 2).

Unmatched (unique to either fMRI or PET data) RSNs and noise components: salience (A), spatial attention (B), primary visual (anterior) (C), anterior insular (D), temporopolar (E), lateral motor (F), (anterior) default mode (G), basal ganglia (H), nucleus accumbens (I), secondary visual (J), mesial parietal/prefrontal (K).
In the separate analysis of subjects with eyes open and eyes closed, the spatial similarity of the visual networks was overall higher in the former subgroup (supplemental materials).
DISCUSSION
In the present study, a number of known RSNs could be identified in 18F-FDG PET data. Among them are the primary and secondary visual, sensorimotor, auditory, cerebellar, DMN, and CEN. Spatial similarity of these RSNs with those extracted from fMRI data in the same healthy subjects appeared to be overall modest. However, given that the 2 imaging modalities record different aspects of neural activity, the results do argue for the common neural substrate of RSNs.
Overall, the RSNs as known from fMRI were less accurately identified in PET data. That is, most networks consisted of clusters that were smaller, worse separated from each other or contained additional clusters. This observation is in line with previous studies in both humans (11) and animals (25). Further, roughly each third independent component (7/20) in the PET data appeared to be noise or could not be classified. Although in a few of these components (e.g., top and bottom in Fig. 2, Noise) major clusters were located in the brain, they were too discrete to enable assignment to a particular network. In contrast, only 3 noise components were found in fMRI data. Correspondingly, a higher number of meaningful RSNs could be extracted from fMRI than from PET data. As for the spatial similarity between the matched networks, it was at best moderate.
The less accurate identification of RSNs in PET data as well as its modest overlap with the fMRI-based network are not unexpected. First, 18F-FDG PET and BOLD fMRI capture partly different aspects of neural activity. While 18F-FDG PET directly measures activity-dependent glucose consumption, BOLD signal stems from interplay among cerebral blood flow, volume, and cerebral metabolic rate of oxygen (26). Second, ICA on fMRI data assigns voxels to the same component when they share similar temporal dynamics (i.e., covariance of BOLD-signal fluctuations), whereas ICA on PET data assigns voxels to the same component when they share similar energy levels (i.e., normalized 18F-FDG uptake) across subjects. Hence, it is far from obvious that similar RSNs can be detected by both imaging modalities.
As compared with fMRI, routinely acquired 18F-FDG PET data represent an averaged snapshot of tracer uptake over a certain time frame, typically 10–20 min, making a within-subject analysis of (static) PET images such as those in a BOLD time series impossible. ICA on such PET data thus identifies sources of intersubject covariance, making the results noisier and stronger dependent on the sample size. This is well in line with a previous study on a comparison between first- and second-level ICA on fMRI data (27). Specifically, the authors could extract the known RSNs from the intersubject covariation among highly distilled features such as amplitude maps. The results were noisier than those from the first-level ICA, still yielding strikingly similar patterns of intrinsic brain connectivity. It must be noted, however, that like fMRI 18F-FDG PET data can be acquired and analyzed dynamically (28). Spatial similarity of RSNs extracted from such data—when starting acquisition simultaneously with injection of 18F-FDG—may be higher because of the contribution of a blood flow signal. This interesting issue should be addressed by future studies.
The first attempt to extract RSNs from 18F-FDG PET data was performed by Di and Biswal (11). In contrast to our study, they quantified the networks from different groups of subjects and compared them only visually. Still, they found many of the known RSNs in the PET data. Interestingly, Di and Biswal had troubles identifying neurocognitive networks with anterior–posterior connectivity, for example, the left CEN (frontoparietal) and DMN. Our study in part supports this observation. That is, the CEN could be identified in our PET data as a single map, with fair to poor spatial overlap with the analogous fMRI-based networks. Although the DMN map consisted of rather small clusters, the pattern was anatomically clear, and the spatial correspondence with the fMRI-derived map was relatively high. The less accurate identification of these RSNs in Di and Biswal (11) may well be related to the fact that the image data under their study were part of a multicenter project with 3 different acquisition protocols (ADNI, http://www.adni-info.org). Besides, subjects in the study by Di and Biswal (11) were substantially older (mean age, 77.2 vs. 54.5 y in our study). Previously, we could readily identify the DMN in a group of young (mean age, 27.1 y) healthy subjects (12).
Apart from the dually detected RSNs, some networks were identified exclusively in fMRI or PET data. Among 7 fMRI-only RSNs, anterior insular and temporopolar do not belong to the established ones. Three further RSNs, (anterior) primary visual, lateral motor, and (anterior) DMNs are variants of those detected in both imaging modalities (Fig. 1). Hence, the salience and spatial attention networks as established ones could not be detected in the present PET data. Of note, the salience RSN was described in Di and Biswal (11). The discrepancy may be explained by a lower number of subjects or components in the present work. On the other hand, 4 RSNs were identified exclusively in the PET data. Along with an additional (secondary) visual RSN, there were 2 subcortical networks. These may have been missed in the fMRI data, because basal ganglia networks are reliably detected at a higher number of decompositions (29). Although 3 of the PET-only RSNs above have been described in the fMRI literature, we are not aware of any fMRI RSN encompassing the mesial parietal and prefrontal cortex as a single cluster. Interestingly, a very similar component has been reported previously (Fig. 1A (11); (30)). The latter study analyzed covariance in regional gray matter density in a group of healthy subjects. Along with the network above, the authors described frontal, posterior cingulate/precuneus, visual, basal ganglia, and cerebellar networks. Thus, the number of fMRI-similar RSNs was lower than in our study, despite a much larger cohort (n = 603) (30). These observations may indicate that the metabolic level of brain connectivity extends between structural and functional levels, expressing features of both. A biologic significance of the “mesial” network is yet to be established.
This study has several limitations. Because of the limited sample size, a higher number of components (in PET data) could not be calculated. For the same reason, we applied a rather liberal z threshold of 2.0 for visualization and quantification, bearing a risk of false-positives. Second, as part of the dedicated imaging protocol subjects were studied under different conditions with respect to visual perception, that is, with eyes open and closed (15). That study found that glucose metabolism in the visual cortex was higher in the eyes-open condition, contributing to a stronger functional connectivity between the visual and salience networks (15). Thus, this confound may have influenced the spatial similarity between the visual networks in the present study. Indeed, our additional analyses revealed a stronger metabolic connectivity within the visual network in the eyes-open condition (with no substantial difference in functional connectivity). Consequently, a higher similarity between the PET- and fMRI-based visual networks was found in the eyes-open subgroup. Finally, the Dice coefficient was used for the quantification of a spatial overlap between PET- and fMRI-based RSNs. This coefficient is a well-established measure of binary similarity and the most used metric in evaluating 3-dimensional medical image segmentation (31). Still, there are other similarity coefficients in the field available (31), both binary and continuous, that may have produced different results. Yet, this methodologic issue lies beyond the scope of our paper.
Besides the neurobiologic significance and a contribution to the developing field of cometomics (25), the present results may be of clinical value. Namely, the network information as obtained through ICA on PET data at the group level can be further used with diagnostic purposes at a single-subject level. This has been shown in many PET studies applying principle component analyses (32) and recently ICA (20,21). In particular, it is possible to calculate a degree to which each individual subject/image contributes to a given pattern/network. This so-called loading coefficient, as extracted from a single RSN or a combination of networks, can be used for single-subject analyses, for example, in a differential diagnosis of neurodegenerative disorders.
CONCLUSION
Despite recording different aspects of neural activity, similar RSNs were detected in fMRI and 18F-FDG data. The results argue for the common neural substrate of RSNs and encourage testing of the clinical utility of resting-state connectivity in PET data.
DISCLOSURE
The study was supported by the internal grant program for resident physicians (KKF, project number B23-13/8764179) at the Technische Universität München (Igor Yakushev). No other potential conflict of interest relevant to this article was reported.
Footnotes
Published online Mar. 2, 2017.
- © 2017 by the Society of Nuclear Medicine and Molecular Imaging.
REFERENCES
- Received for publication November 28, 2016.
- Accepted for publication January 31, 2017.


Jump to section
Related Articles
Cited By...
- Multimodal Neuroimaging of the Effect of Serotonergic Psychedelics on the Brain
- The long distance relationship of regional amyloid burden and tau pathology spread
- Early-Phase 18F-Florbetapir and 18F-Flutemetamol Images as Proxies of Brain Metabolism in a Memory Clinic Setting
- A new framework for metabolic connectivity mapping using bolus [18F]FDG PET and kinetic modelling
- Mechanisms of Network Changes in Cognitive Impairment in Multiple Sclerosis
- Metabolic and haemodynamic resting-state connectivity of the human brain: a high-temporal resolution simultaneous BOLD-fMRI and FDG-fPET multimodality study
- Integrity of Neurocognitive Networks in Dementing Disorders as Measured with Simultaneous PET/Functional MRI
- Analysis of continuous infusion functional PET (fPET) in the human brain
- Simultaneous task-based BOLD-fMRI and [18-F] FDG functional PET for measurement of neuronal metabolism in the human visual cortex
- Neurometabolic Resting-State Networks Derived from Seed-Based Functional Connectivity Analysis
- Reply: Neurometabolic Resting-State Networks Derived from Seed-Based Functional Connectivity Analysis