


Abstract
Functional MRI (fMRI) studies have reported altered integrity of large-scale neurocognitive networks (NCNs) in dementing disorders. However, findings on the specificity of these alterations in patients with Alzheimer disease (AD) and behavioral-variant frontotemporal dementia (bvFTD) are still limited. Recently, NCNs have been successfully captured using PET with 18F-FDG. Methods: Network integrity was measured in 72 individuals (38 male) with mild AD or bvFTD, and in healthy controls, using a simultaneous resting-state fMRI and 18F-FDG PET. Indices of network integrity were calculated for each subject, network, and imaging modality. Results: In either modality, independent-component analysis revealed 4 major NCNs: anterior default-mode network (DMN), posterior DMN, salience network, and right central executive network (CEN). In fMRI data, the integrity of the posterior DMN was found to be significantly reduced in both patient groups relative to controls. In the AD group the anterior DMN and CEN appeared to be additionally affected. In PET data, only the integrity of the posterior DMN in patients with AD was reduced, whereas 3 remaining networks appeared to be affected only in patients with bvFTD. In a logistic regression analysis, the integrity of the anterior DMN as measured with PET alone accurately differentiated between the patient groups. A correlation between indices of 2 imaging modalities was low overall. Conclusion: FMRI and 18F-FDG PET capture partly different aspects of network integrity. A higher disease specificity for NCNs as derived from PET data supports metabolic connectivity imaging as a promising diagnostic tool.
In the last few decades, resting-state networks (RSNs) have been a hot topic of cognitive and clinical neuroscience. Using resting-state functional MRI (fMRI), abnormalities in so-called neurocognitive networks (NCNs) have been found in numerous neuropsychiatric disorders (1). Neurodegenerative diseases, including dementia, are not an exception (2,3). In their seminal paper, Greicius et al. (4) reported decreased functional connectivity of the default-mode network (DMN) in patients with Alzheimer disease (AD) as compared with healthy subjects. A further study suggested even a differential disruption of network connectivity in dementing disorders. Thus, DMN was reported to be affected in AD, and the salience network (SN) was reported to be affected in behavioral-variant frontotemporal disease (bvFTD) (5). However, observations on this topic have been rather inconsistent. For instance, reduced in-phase connectivity with the DMN was found in patients with bvFTD (6). Others reported an increased functional connectivity within the frontal networks in AD subjects (7). In agreement with these heterogeneous results, the clinical applicability of resting-state fMRI remains limited. Among putative reasons are a low signal-to-noise ratio and a low reproducibility of the findings at a single-subject level (8). PET with 18F-FDG is an established clinical tool for early and differential diagnosis of dementing and movement disorders (9,10). Although multivariate decomposition of PET data has been successfully applied in both neurodegenerative dementia (11) and Parkinsonian syndromes (12), RSNs could be identified in 18F-FDG PET data only recently (13–16). In particular, our group has found spatially similar RSNs in fMRI and 18F-FDG PET data in the same group of healthy subjects (15). The present study addressed the value of 18F-FDG PET in assessing the integrity of NCNs in dementing disorders, in comparison with fMRI. To this end, resting-state fMRI and 18F-FDG PET data were acquired simultaneously in the same group of patients with AD or bvFTD, as well as in healthy controls (HCs). A simultaneous data acquisition allows minimization of variability in RSNs due to different brain states, excitement levels, or moods of the person (17,18).
MATERIALS AND METHODS
Subjects
We retrospectively analyzed data from patients who were referred to our center for a PET/MRI examination as part of a diagnostic work-up for a suspected neurodegenerative disorder. Only subjects with an expert diagnosis of AD or bvFTD were considered. The expert diagnosis was made by a consensus of at least 2 experienced psychiatrists under consideration of a clinical examination, the results of neuropsychologic and lab testing, imaging results, and cerebrospinal fluid biomarkers. The imaging biomarkers included structural MRI, 18F-FDG PET, and in some cases amyloid PET. The diagnosis of AD was made according to the NINCDS-ADRDA (19) or NIA-AA (20) criteria. In the latter case, the clinical diagnosis of MCI due to AD was supported by AD-typical biomarker findings. BvFTD was diagnosed according to published diagnostic criteria (21). Only patients with a Mini Mental State Examination score of at least 18 were included. The group of HCs consisted of individuals without psychiatric and neurologic symptoms and no complaints about cognitive impairment. They were recruited mainly via advertisements in local newspapers.
The study was performed in accordance with the latest version of the Declaration of Helsinki after the consent procedures had been approved by the local ethics committee of the medical faculty at the Technische Universität München. Written informed consent was obtained from all subjects.
Image Data Acquisition
Imaging was performed on a 3-T Siemens Biograph mMR scanner (Siemens Healthineers AG) under standard resting conditions. Structural T1-weighted (magnetization-prepared rapid gradient-echo) images were acquired using a 3-dimensional normal gradient-recalled sequence (repeat time, 2,300.0 ms; echo time, 2.98 ms; 9.0° flip angle) measuring 160 sagittal slices (field of view, 240 × 256 mm; pixel spacing, 1 mm; 256 × 240 scan matrix; slice thickness, 1.0 mm). Resting-state fMRI was performed with the following parameters: repeat time, 2,000.0 ms; echo time, 30 ms; flip angle, 90°; 35 slices (gap, 0.6 mm); alignment to the anterior–posterior commissure covering the whole brain; field of view, 192 mm; matrix size, 64 × 64; and voxel size, 3.0 × 3.0 × 3.0 mm. The PET acquisition ran in parallel for 15 min, starting 30 min after intravenous injection of, on average, 198 MBq (range, 154–237 MBq). The subjects had fasted for at least 6 h before undergoing scanning. Raw 18F-FDG PET data were reconstructed using filtered backprojection and an isotropic Hamming filter (5 mm in full width at half maximum). Attenuation correction was performed using a default Dixon MRI sequence.
Image Preprocessing
The image data were preprocessed mainly using SPM12 (Wellcome Trust Center for Neuroimaging). After segmentation, T1-weighted images were spatially normalized into the Montreal Neurologic Institute space. Echo-planar images were slice-time–corrected, realigned, coregistered to the subject’s specific T1-weighted images in Montreal Neurologic Institute space, and band-pass–filtered (0.01 and 0.08 Hz). The first 3 images (6 s) of each subject’s fMRI data were discarded to allow for equilibration of the magnetic field. In addition, a component-based noise correction (aCompCor) (22,23) based on cerebrospinal fluid signal was applied. The applied preprocessing pipeline is available as an open-source software tool (https://github.com/neurita/pypes/tree/v0.2.1) (24). 18F-FDG PET images were spatially normalized to the Montreal Neurologic Institute space using a study-specific 18F-FDG PET template and smoothed with a gaussian kernel of 8 mm in full width at half maximum, in analogy with fMRI data. No correction for partial-volume effects was applied. First, a uniform method for fMRI and 18F-FDG PET data does not exist; different methods may have biased the results in favor of one imaging modality (25). Second, our analyses focused on larger cortical structures (networks), and patients with only mild disease, in whom relevant atrophy is unlikely, were included.
Analyses of Motion Artifacts
To minimize a negative methodologic bias toward fMRI data, particular attention was paid to potential motion artifacts. A Rapidart ArtifactDetect algorithm from NiPype (26) was used for signal nuisance correction by regressing out motion and intensity artifacts, if present (27). The tool computes the movement of the center of each face of a cuboid centered around the head and returns the maximal movement across the center. It is also implemented in Artifact Detection Tools (http://web.mit.edu/swg/software.htm). The following measures were recorded: total number of volumes that are affected by movement (motion outliers), maximum norm of the movement vector (maximum norm), and the SD of the movement norms of the subjects. Four patients with AD, 5 patients with bvFTD, and no HCs were discarded from further analyses because of significant movement. This was defined as more than 30 motion outliers, a maximum norm larger than 4 mm, or an SD larger than 1 mm.
Independent-Component Analysis (ICA)
To extract RSNs, a spatial ICA was applied independently to fMRI and PET data. Individual-subject fMRI time-series images were concatenated for the group ICA (28). A concatenation of 1 mean PET image per subject was used for the group ICA (13–15,29). We applied a 30-component ICA model for both imaging modalities. This intermediate model order (n = 30) was chosen to extract robust spatial maps, preventing coherent RSNs from being split into several subnetworks (30–32). In view of the known perturbations in NCNs in dementing disorders, we a priori focused analyses on the following networks of interest: DMN, SN, and central executive network (CEN). Following previous studies, the primary visual and auditory networks were chosen as reference networks, as they are supposed to be unaffected in AD and bvFTD, at least at a clinically mild disease stage (33,34). In both imaging modalities, relevant spatial maps were selected using a spatial correlation with established functional templates (32).
We used the GIFT toolbox (version 3.0a; Medical Imaging Analysis Lab, The Mind Research Network; http://mialab.mrn.org/software/gift). Basically, ICA attempts to decompose the linearly mixed signals from the temporal dimension into independent spatial sources, which are maximally independent non-Gaussian signals. As a first step of subject-specific data whitening and reduction, a principal-component analysis is performed. After this, we applied a group data reduction step retaining the number of principal components defined using the expectation-maximization algorithm to avoid prohibitive memory requirements (35). Aggregate spatial correlation maps are estimated as the centrotypes of component clusters to reduce sensitivity to initial algorithm parameters.
Indices of Network Integrity
In both imaging modalities, subject-specific spatial maps and time courses were estimated with a group-ICA3 back-reconstruction method, consisting of a 2-step multiple regression (36). This method is based on a principal-component analysis compression and projection (28,37). To derive individual indices of network integrity for fMRI data, a spatiotemporal regression—also called dual regression—was computed against group-based maps (38,39). For PET data, we computed so-called loading coefficients, a degree of component (RSN) expression in individual subjects (28,29). A conceptually equivalent representation underlies network integrity measures of both imaging modalities. Finally, indices of network integrity were available for each subject, network, and imaging modality.
Calculation of Loading Coefficients
ICA is a data-driven method that extracts a set of components from a set of a mixed signal observations. The independent components are orthogonal to each other. Therefore, the different n component signals s = [s1, s2, … sn] are assumed to be independent but linearly mixed in m observations. The generative model x = As, where A is the mixing matrix, separates the different signals. Hereby, the elements of A represent the loading coefficients measuring a subject’s spatial deviation from an average group-derived component, that is, RSN. Because the extracted components are expressed in individual subjects to a different degree, the mixing matrix entries (elements of A), that is, the loading coefficients or integrity values, represent the spatial overlap between every subject’s specific RSN and the equivalent group-based RSN (28,29). Loading coefficients around 0 represent a strong coherence between the subject-specific and group-based RSNs. For fMRI-derived RSNs, the network integrity is quantified as the multiple (spatiotemporal) regression coefficient between a given group-derived RSN and the equivalent subject-specific RSN. Regression values around 1 represent a strong coherence between the subject-specific and group-based RSNs.
White Matter Hyperintensities (WMH) and Hemorrhages
The results of network analyses prompted us to perform additional post hoc analyses. First, we quantified a volume of WMH on T2-weighted fluid-attenuated inversion recovery images (40). Second, we assessed the presence of eventual hemorrhages as an index of sporadic cerebral amyloid angiopathy (CAA). To this end, an experienced neuroradiologist read T2*-weighted images for CAA according to established criteria (41).
Statistics
Integrity indices were compared between the groups independently for each modality using ANOVA with a post hoc 2-sample t test. A P value of less than 0.05 Bonferroni-corrected for multiple tests, that is, RSNs of interest, was accepted as the significance level. For explorative reasons, we also present results with an uncorrected P value of less than 0.05. A binary logistic regression (stepwise) with resubstitution and cross-validation (leave-one-out classification) was performed to predict the diagnostic status (AD vs. bvFTD) using indices of network integrity (SPSS Statistics, version 22; IBM). An association between the integrity indices of 2 modalities for the same network was tested using a nonparametric Spearman correlation. A nonparametric Mann–Whitney U test was applied to test for differences in WMH volume between the groups. A χ2 test was applied to test for differences in a proportion of subjects with CAA (possible and probable were pooled) among 3 groups. Results were considered significant at a P level of less than 0.05.
RESULTS
Subjects
Following the inclusion criteria, 72 subjects were selected for the study. Their demographic characteristics are summarized in Table 1. There was no significant difference in age, sex, or Mini Mental State Examination score between the groups. Thus, no correction for these variables was applied (42). The AD group included patients with MCI due to AD (n = 19) and dementia due to AD (n = 10).
Demographics
ICA
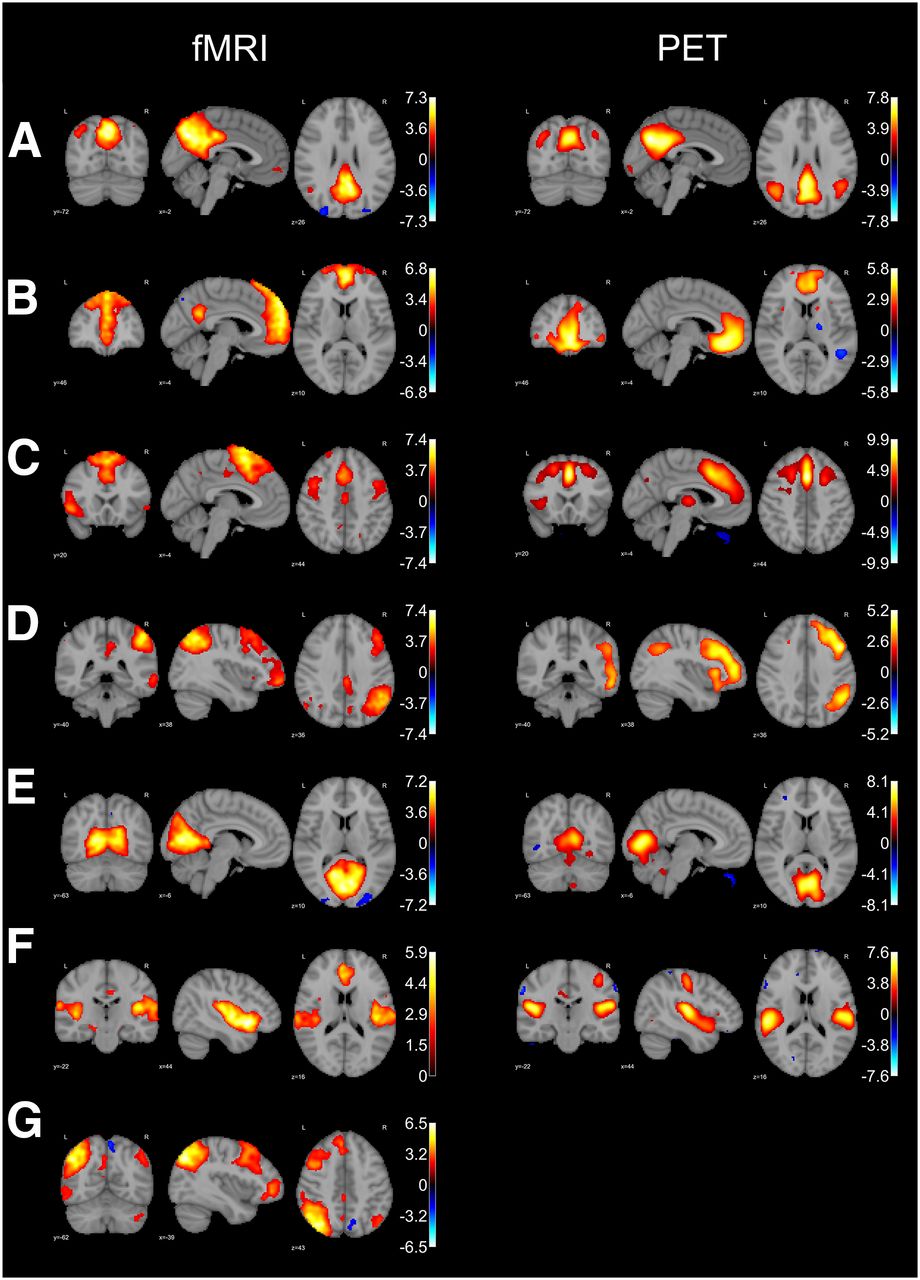
Figure 1 depicts the RSNs of interest for each imaging modality. In both modalities, the DMN was split into the anterior and posterior networks. Only the right CEN could be identified in PET data. Thus, further analyses focused on the following 6 networks: posterior DMN, anterior DMN, SN, right CEN, primary visual, and auditory.

RSNs of interest. Overlay is shown of IC maps at threshold of z > 2.0 on T1 template in Montreal Neurologic Institute space. Color bar represents z values. (A) Posterior DMN. (B) Anterior DMN. (C) SN. (D) Right CEN. (E) Primary visual. (F) Auditory. (G) Left CEN.
RSNs of Interest
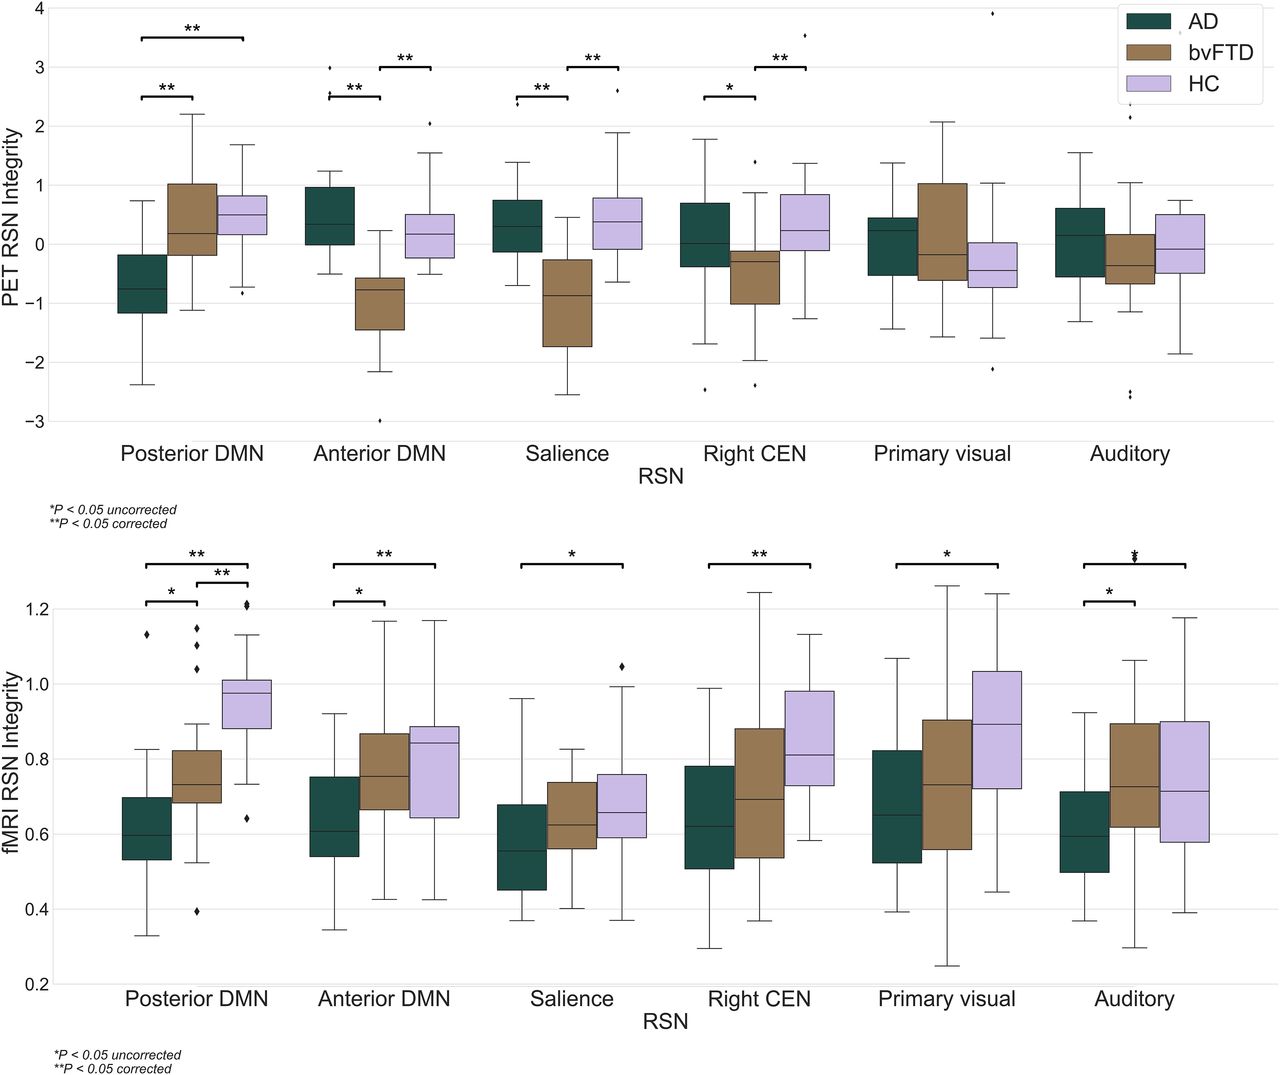
Figure 2 shows a distribution of the network integrity among the groups for each imaging modality. Each RSN (Fig. 1) was common for all subjects under the study, and network integrity measures were available for every subject. In the 18F-FDG PET data, we observed a significantly lower integrity of the anterior DMN and SN in bvFTD subjects than in AD subjects. The integrity of the posterior DMN was significantly higher in bvFTD subjects than in AD subjects. In comparison to HCs, the integrity of the posterior DMN was significantly lower in AD subjects, and the integrity of the anterior DMN, SN, and right CEN was significantly lower in bvFTD subjects. For fMRI-derived RSNs, we observed a significantly lower integrity of the posterior DMN, anterior DMN, and right CEN in AD subjects than in HCs. In bvFTD subjects, a significantly lower integrity of the posterior DMN than in HCs was found. At a P value of less than 0.05, uncorrected, the integrity of each RSN of interest was lower in AD subjects than in HCs.

Distribution of network integrity indices. Boxes show quartiles of dataset, and whiskers extend to show rest of distribution, except for points that are determined to be outliers using method that is function of interquartile range. y-axis indicates spatiotemporal regression for fMRI and loading coefficients for 18F-FDG PET. Both indicate individual degree of network integrity.
Regression and Correlation Analyses
In fMRI data, the integrity indices of the posterior DMN appeared as a single significant predictor of the diagnostic status, providing an accuracy of 64% (P = 0.017; sensitivity of 79%, specificity of 43%). In PET data, the anterior DMN was the strongest predictor, with an accuracy of 94% (P = 0.002; sensitivity of 97%, specificity of 91%), whereas addition of the SN slightly but significantly increased the accuracy up to 96% (P = 0.016; sensitivity of 97%, specificity of 95%). The correlation analyses revealed at best a low within-network–between-modalities correlation, with the highest R (0.33, P = 0.005) being for the anterior DMN.
WMH and Hemorrhages
The volume of WMH was 4.8 ± 9.3, 2.6 ± 2.9, and 2.7 ± 3.9 cm3 in the AD, bvFTD, and HC groups, respectively. There was no statistically significant difference among the groups (P > 0.05). T2*-weighted images were available for 25 subjects with AD, all subjects with bvFTD, and 21 HCs. In the AD group, there were 4 subjects with possible and 1 subject with probable CAA. None of subjects with bvFTD appeared to have CAA. In the HC group, possible CAA was diagnosed in 1 subject. The proportion of subjects with CAA was significantly larger in the AD group than in the bvFTD group (P = 0.03) but not the HC group (P = 0.13). There was no difference between the bvFTD and HC groups (P = 0.31).
DISCUSSION
In the present study, we examined the integrity of NCNs in AD and bvFTD subjects using simultaneous resting-state fMRI and 18F-FDG PET. As in our previous work on healthy subjects (15), spatially similar RSNs were found in both imaging modalities. In PET data, the integrity of NCNs was differentially affected in the 2 dementing disorders. In fMRI data, all networks of interest showed the lowest integrity in AD subjects and a lower integrity in bvFTD subjects than in HCs. The integrity of the anterior DMN—as measured with 18F-FDG PET—accurately discriminated between the 2 patient groups. Such a distinction was not possible using the same NCNs from fMRI data.
Whereas 18F-FDG PET is supposed to capture neural or synaptic activity by estimating glucose consumption in terms of neurometabolic coupling (43), fMRI measures neural activity less directly, through the amount of oxygen in blood supplying a given brain region (44). This so-called neurovascular coupling is based on a complex interplay between local cerebral blood flow, volume, and the cerebral metabolic rate of oxygen (45). Thus, the partly different findings in our fMRI and 18F-FDG PET data, as well as a low correlation between integrity measurements of fMRI- and PET-based networks, are not surprising. In particular, we observed a lower integrity across all fMRI-based NCNs plus the primary visual network in both patient groups relative to HCs, with the AD group being consistently more impaired than the bvFTD group. This observation may have both a biologic and a methodologic background. Different neurodegenerative disorders are known to share common pathophysiologic phenomena such as production of toxic oligomers that cause intercellular miscommunication (46,47). The toxic effects lead to a dyssynchrony of network activity that may manifest as impaired RSN integrity (48). As compared with blood oxygenation level–dependent (BOLD) fMRI, 18F-FDG PET possesses a much lower temporal resolution. A snapshot of 18F-FDG delivery over minutes may be more robust to nonspecific whole brain (e.g., toxic) effects. In addition, ICA on PET data as in the present study identifies brain regions sharing similar 18F-FDG uptake, rather than synchronicity of the BOLD signal fluctuations. Hence, relative to fMRI data, alterations in RSNs in 18F-FDG PET data seem to be driven more by a disease-specific neurodegeneration. In the same vein, and unlike fMRI data, the integrity of reference (non-NCN) RSNs in PET data appeared to be preserved.
As a further finding, the integrity of RSNs in fMRI data was consistently more impaired in the AD group than in the bvFTD one. This finding can be explained by, for instance, a more profound cerebrovascular disease in AD patients, as well by sporadic CAA, which is often associated with AD (49). Thus, neurovascular decoupling as measured with fMRI was shown to be associated with the severity of CAA. Hereby, patients with CAA had a lower amplitude of fMRI response within the visual cortex during a visual task than did HCs (50). That study also reported a correlation between the impaired fMRI amplitude and a higher WMH volume in CAA patients. A recent study reported a limited reproducibility of functional connectivity networks, particularly in patients with cerebral small-vessel disease (51). On one hand, because of vascular lesions, routine pathways of functional connectivity may be at least in part replaced by other, less consistent, routes (51). On the other hand, vascular pathology may affect the BOLD hemodynamic response, reducing interregional correlations (52,53). Further, altered DMN connectivity was shown to be significantly correlated with WMH burden (54), and other studies confirmed the central role of the white matter lesions in disrupting functional connectivity (55–57). Our post hoc analyses support this hypothesis. Specifically, patients with AD showed nearly double the WMH of patients with bvFTD and HCs. Yet, apparently because of a high variability in the AD group, the difference was not statistically significant. Furthermore, the proportion of subjects with CAA was higher in patients with AD than in the 2 other groups.
Overall, the pattern of NCN alterations in 18F-FDG PET rather than in fMRI data agrees with the known pathologic changes in AD and bvFTD patients. Thus, a posterior NCN such as the posterior DMN appeared to be affected in AD subjects, whereas anterior NCNs such as the anterior DMN and SN were disturbed in bvFTD subjects. The right CEN, covering both the anterior and the posterior parts of the brain, was affected in bvFTD subjects, in line with the known executive dysfunction in these patients (58). The posterior DMN was consistently affected in both modalities; that is, its integrity was significantly lower in AD subjects than in bvFTD subjects or HCs. This observation agrees well with the fMRI literature (4,59). However, a significant difference in a test measure does not necessarily mean that this measure is accurate with respect to class prediction or, in clinical terms, with respect to differential diagnosis. To address this issue, we performed a stepwise logistic regression analysis. Among fMRI-based NCNs, the integrity of the posterior DMN appeared to be the only significant predictor of the diagnosis (AD vs. bvFTD), with an accuracy of only 64%. This result is well below the accuracy values of 100% reported by Zhou et al. (5). Apart from methodologic differences, the discrepancy can be explained by smaller patient groups (n = 12 each) and by more advanced disease in patients with AD (average Mini Mental State Examination score of 21.2, vs. 24.3 in our study) in the study of Zhou et al. (5). As for NCNs extracted from PET data, the integrity of the anterior DMN appeared to be the strongest predictor of the diagnostic status, providing an accuracy of 94%. All other NCNs on their own were significant predictors, too, but with a lower accuracy. In a stepwise logistic regression with all PET-based NCNs, the integrity of the SN slightly improved the discrimination (96% accuracy).
An advantage of our study was the well-characterized and well-matched groups of patients and HCs. Furthermore, the PET and fMRI data were acquired simultaneously, preprocessed, and analyzed in an analogous manner. To minimize a negative bias toward fMRI, we applied a state-of-the-art image analysis, with special attention to the quality control of the fMRI data (e.g., analyses of motion artifacts). As a limitation, our study focused on the established NCNs. However, other networks, such as the limbic network, may also be of relevance in neurodegenerative dementia in general and in bvFTD in particular (60). Future studies should address this issue. As a further limitation, the results of the logistic regression were cross-validated using a leave-one-out approach. Thus, they may be too optimistic; a prospective validation in another cohort is essential.
CONCLUSION
Our study provides novel insights into alterations of the established RSNs in AD and bvFTD, supporting metabolic connectivity imaging as a valuable tool in the field of brain connectivity. We propose to establish an atlas of 18F-FDG PET–based RSNs similar to that of Allen et al. for fMRI (32). This would allow us to characterize disease-specific connectivity patterns at the metabolic network level (12).
DISCLOSURE
Timo Grimmer has received consulting fees from Actelion, Biogen, Eli Lilly, Iqvia/Quintiles, MSD, Novartis, Quintiles, and Roche Pharma; lecture fees from Biogen, Lilly, Parexel, Roche, and Pharma; and grants to his institution from Actelion, Novartis, and PreDemTech. Igor Yakushev has received consultant or lecture fees from Blue Earth Diagnostics, ABC-CRO, and Piramal. No other potential conflict of interest relevant to this article was reported.
KEY POINTS
QUESTION: What is the value of altered network integrity—as measured with 18F-FDG PET and fMRI—in dementing disorders?
PERTINENT FINDINGS: The pattern of network alterations differed between the modalities, with the fMRI-based NCNs showing a generally lower disease specificity. The integrity of the anterior DMN as measured with PET alone accurately differentiated between patients with mild AD and bvFTD dementia.
IMPLICATIONS FOR PATIENT CARE: A higher disease specificity of NCNs as derived from PET data supports metabolic connectivity imaging as a promising diagnostic tool.
Footnotes
Published online May 1, 2020.
- © 2020 by the Society of Nuclear Medicine and Molecular Imaging.
REFERENCES
- Received for publication August 15, 2019.
- Accepted for publication January 3, 2020.


Jump to section
Related Articles
Cited By...
- No citing articles found.