


Abstract
In PET, transmission scanning for attenuation correction has most commonly been performed with an external positron-emitting radionuclide source, such as 68Ge. More recently, combined PET/CT scanners have been developed in which the CT data can be used for both anatometabolic image formation and attenuation correction of the PET data. The purpose of this study was to assess the quantitative differences between CT-based and germanium-based attenuation-corrected PET images. Methods: Twenty-eight patients with known or suspected cancer underwent whole-body 18F-FDG PET/CT scanning for clinical diagnostic purposes. For each patient, attenuation maps were obtained from both the CT scan and the 68Ge transmission data, and 2 different attenuation-corrected emission datasets were produced. Measured activity concentrations (both mean and maximum) from identical regions of interest in representative normal organs and in 36 pathologic foci of uptake were compared. Results: CT-corrected emission images generally showed slightly higher radioactive concentration values than did germanium-corrected images (P < 0.01) for all lesions and all normal organs except the lung. Mean and maximum radioactivity concentrations were 4.3%–15.2% higher for CT-corrected images than for germanium-corrected images. Calculated radioactivity concentrations were significantly greater in osseous lesions than in nonosseous lesions (11.0% vs. 2.3%, P < 0.05, for mean value; 11.1% vs. 2.1%, P < 0.01, for maximum value). A weak positive correlation was observed between the CT Hounsfield units within the regions of interest and the percentage difference in apparent tracer activity in the CT-corrected images. Conclusion: Although quantitative radioactivity values are generally comparable between CT- and germanium-corrected emission PET images, CT-based attenuation correction produced radioactivity concentration values significantly higher than the germanium-based corrected values. These effects, especially in radiodense tissues, should be noted when using and comparing quantitative PET analyses from PET and PET/CT systems.
For oncologic imaging, 18F-FDG PET is an established diagnostic tool (1, 2). With this modality, the glucose metabolic status of lesions can be evaluated as a complement to the tumor imaging obtained by morphologic modalities such as CT or MRI. Because PET has poorer spatial resolution than other conventional morphologic modalities, and because nontarget activity levels are often low, the lack of anatomic landmarks can make interpretation of PET images difficult. To overcome this problem, several approaches have been evaluated to fuse functional PET images with anatomic images (3), mainly of the brain or of the head and neck (4–6). Differences in patient positioning, compounded by a time separation between the 2 studies, have limited attempts to produce appropriately fused images of the chest, abdomen, and pelvis, although such imaging is possible with careful attention to procedural details.
Recently, combined PET/CT scanners have been developed, and their routine clinical use is now beginning (7–11). CT images obtained with such a combined scanner should be more usable for image fusion, because the CT and PET are done in close temporal sequence, ideally with no motion of the patient between sequential studies. Further, the CT data from such a combined scanner can also potentially be used for PET attenuation correction. Attenuation correction has traditionally been performed by generating transmission data from an external radionuclide source, such as 68Ge, which, through positron annihilation, generates 511-keV photons. Rapid transmission images of high statistical quality are an important potential advantage of a combined PET/CT scanner, because the CT acquisition time is much shorter than the radionuclide transmission acquisition time (35 s in our scanner for CT vs. 18–35 min for transmission using 68Ge) and because the CT data are of higher spatial resolution and much lower noise (8). Although careful basic studies have been performed using CT attenuation maps (12), and the first PET/CT scanner produced satisfactory images using a CT attenuation correction algorithm, there have been only a few preliminary reports about differences between PET images corrected using CT versus 68Ge attenuation maps (13–15). Differences might be expected because the energy of the x-rays from CT is not monoenergetic and is much lower than that of an external positron-emitting radionuclide source, necessitating use of a transforming formula to convert CT attenuation values to those appropriate for 511-keV photons. If such a conversion is not accurate, the quantitative analysis that has been one of the advantages of PET may be compromised. Accordingly, the objective of this study was to evaluate the quantitative differences between emission PET images reconstructed with CT-based and germanium-based attenuation correction.
MATERIALS AND METHODS
Patients
The study population comprised 28 sequential clinical patients (13 men, 15 women; mean age, 59.4 ± 13.0 y) with a known or suspected neoplasm who were referred to our institute for a combined PET/CT scan of the whole body. Datasets were retrospectively examined.
Data Acquisition
18F-FDG was synthesized by the method of Hamacher et al. (16). For whole-body imaging, PET was performed using a commercial combined PET/CT scanner (Discovery LS; General Electric Medical Systems, Waukesha, WI). The system permitted the simultaneous acquisition of 35 transaxial PET emission images per field of view with an interslice spacing of 4.25 mm. Axial and transaxial resolution using a ramp filter was approximately 4.5 mm in full width at half maximum. The field of view was 50 cm, and the pixel size of the reconstructed images for registration was 3.906 mm; that is, a 128 × 128 matrix size was used. This PET/CT scanner has an integrated 4-slice multidetector helical CT scanner. Technical parameters used for CT imaging were as follows: a detector row configuration of 4 × 5 mm, a pitch of 6:1 (high-speed mode), a gantry rotation speed of 0.8 s, a table speed of 30 mm per gantry rotation, 140 kVp, and 80 mA. After at least a 4-h fast, patients received an intravenous injection of approximately 555 MBq (15 mCi) 18F-FDG. Approximately 60 min later, CT scanning was performed from the meatus of the ear to the mid thigh for 35 s without breath-holding, and a whole-body emission scan for the same axial coverage was obtained, with 5 min per bed position. Finally, a radionuclide transmission scan was obtained using 2 rotating 68Ge rod sources, with 3 min per bed position.
Image Reconstruction
The CT images were created in a matrix size of 512 × 512 but were reduced to a 128 × 128 matrix to correspond to the PET emission images. The resulting CT pixel values in Hounsfield units were transformed into linear attenuation coefficients in cm−1 at 511 keV by a bilinear function “hinged” at the CT value of water (Fig. 1). These attenuation images were forward-projected according to the PET scanner geometry, and the calculated line integrals were put in exponential form to obtain the attenuation correction factors. The resulting sinograms were smoothed with an 8-mm gaussian filter to adjust the correction data to the PET resolution. These attenuation correction factors were then applied to the emission data, and the attenuation-corrected emission images were reconstructed with an ordered-subset expectation maximization (OSEM) iterative reconstruction algorithm (2 iterations, 28 subsets). For the conventional 68Ge correction, segmented attenuation correction (SAC) was used. The reconstructed 68Ge transmission map was automatically segmented into tissue classes of differing average attenuation, and the average attenuation coefficient within each class was substituted for the raw pixel-by-pixel values. Thus, 2 different PET datasets were produced, one representing attenuation correction based on the transmission data from CT, the other based on the transmission data from 68Ge.
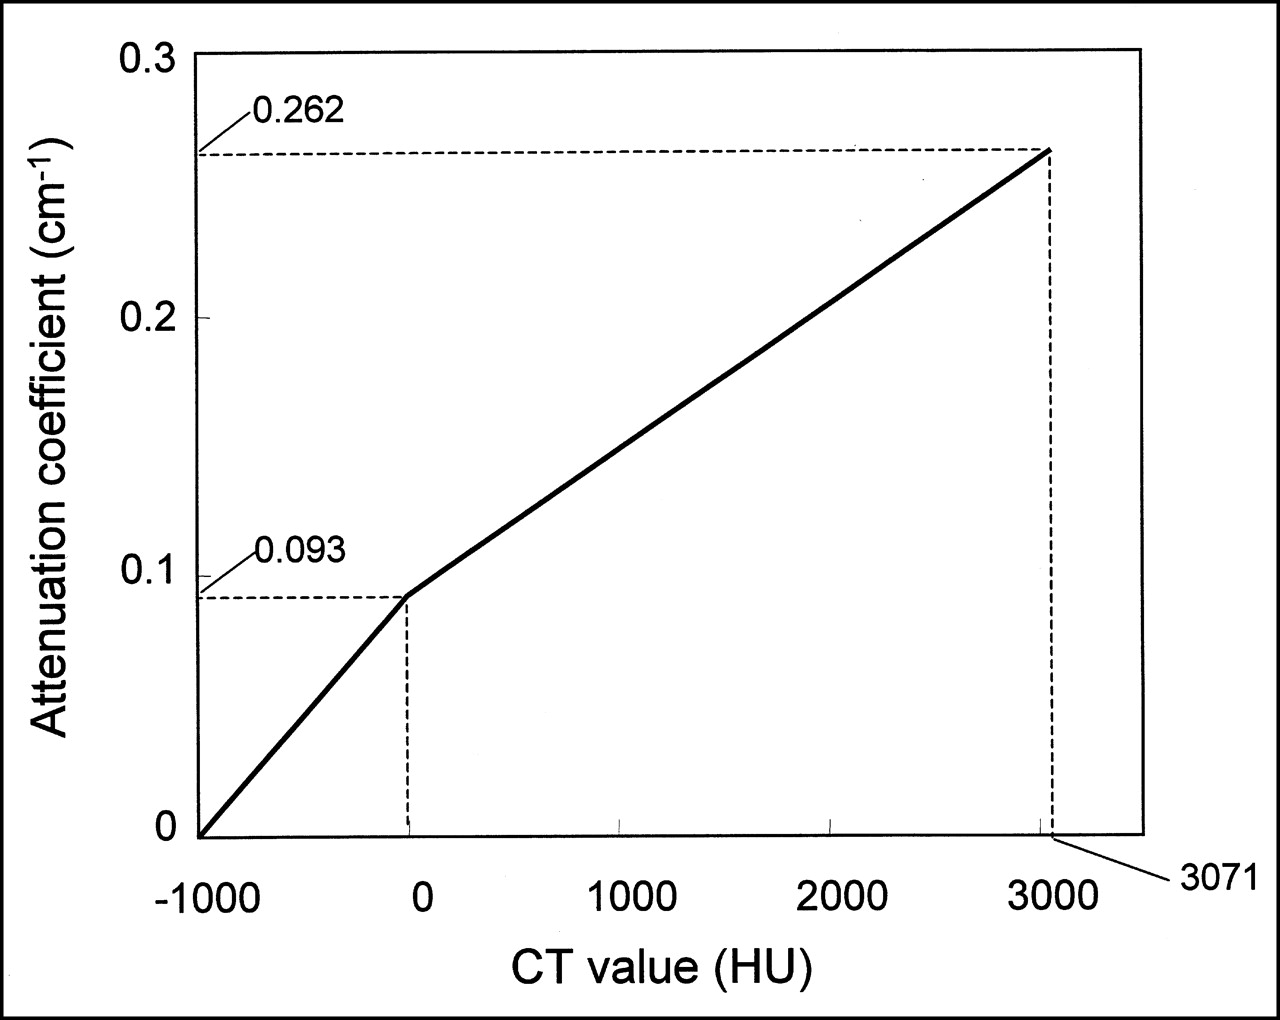
Conversion scale used to transform CT Hounsfield units (HU) into attenuation coefficients in Discovery LS (General Electric Medical Systems, Waukesha, WI). Bilinear function is defined by 3 coordinates (−1,000 HU, 0 cm−1), (0 HU, 0.093 cm−1), and (3,071 HU, 0.262 cm−1). In this system, CT values > 3,071 HU are regarded as 3,071 HU.
Phantom Study
A 5,635-mL cylinder was filled with 27.01 MBq (0.730 mCi) 18F-FDG solution, and a transmission scan with CT was obtained using the same parameters described above. This scan was followed by a 5-min emission scan and a 3-min transmission scan. On 33 of 35 slices, a circular region of interest (ROI) was placed over each slice, and average activity was calculated for both CT-corrected and germanium-corrected images.
Image Analysis
Identical ROIs were placed over the same locations in the 2 PET images (Fig. 2), and the mean and maximum values (in Bq/mL) were obtained. We also evaluated the corresponding CT value (in Hounsfield units) by placing the same ROIs on the CT images. The exact corresponding location was obtained using the commercial fusion software on the scanner’s workstation (eNTEGRA; Elgems, Haifa, Israel).
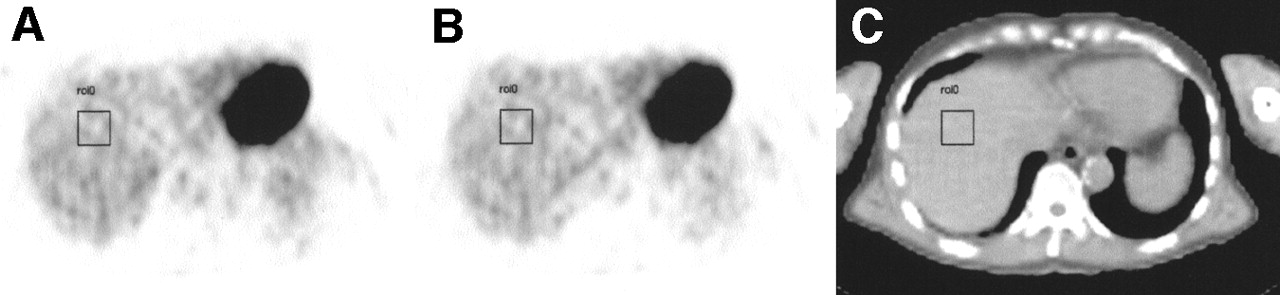
Representative images for analysis. After we displayed PET emission images reconstructed using 2 different attenuation maps of CT (A) and 68Ge (B), and corresponding CT images (C), we evaluated quantitative tracer uptake values for same location. This figure shows example of assessment of S8 segment in liver.
ROIs were placed on images of both normal organs and lesions. For normal organs, we evaluated regions of interest in the temporal lobe of the brain, the cerebellum, the lung, the liver (anterosuperior segment [S8] and posteroinferior segment [S6]), the kidney (renal cortex and renal pelvis), and the bowel in the anatomic pelvis. For suspected 18F-FDG-avid cancers, we selected regions of focal intense uptake, suggestive of pathology, when present. Square ROIs of 4 × 4 pixels (16 × 16 mm) were used for the temporal lobe, cerebellum, renal cortex and pelvis, and intrapelvic bowel, whereas larger 8 × 8 pixel (31 × 31 mm) ROIs were used for the lung and the 2 portions of the liver. In addition, smaller 2 × 2 pixel (8 × 8 mm) squares were applied for foci of suspected pathologic uptake, and we assessed the highest average areas within the lesions. When suspected malignant lesions were observed in the lung or liver, physiologic uptake of the corresponding normal organ was used for determining lesion-to-background ratios. Otherwise, another square ROI of 4 × 4 pixels (16 × 16 mm) was placed over an adjacent normal area for determination of lesion-to-background ratios. We did not place ROIs in artifact-prone regions such as the mouth, where intense streak artifacts were often seen on CT because of dental work (17). We compared both the mean (average of all pixels within the ROI) and maximum (hottest single pixel within the ROI) values in the 2 PET datasets for each patient.
Statistical Analysis
The differences in individual ROI values between the 2 images were compared using the paired t test. To assess the intrasubject variability of all values, the percentage difference (%Diff) across organs or suspected tumors was calculated using the following formula:
 where XCT is the ROI radioactivity concentration value in the CT-corrected image and XGe is the corresponding value in the germanium-corrected image. To compare the %Diff between osseous and nonosseous lesions, a Mann-Whitney U test was used.
RESULTS
The phantom study of 18F-FDG in water showed the mean measured activity to be 3.7 kBq/mL in the CT-corrected image and 3.6 kBq/mL in the germanium-corrected image. The radioactivity concentrations in CT-corrected images were minimally higher than in germanium-corrected images, and %Diff was calculated to be 1.6%.
Table 1 compares the ROI values for the same areas in normal organs between CT-corrected and germanium-corrected images in varying tissues. In evaluating mean and maximum values, the values in CT-corrected images were significantly higher than in germanium-corrected images in all tissues except lung (P < 0.01). Table 2 compares the quantitative values of tumor uptake and tumor-to-background ratios. Tumor ROI values were significantly higher in CT-corrected images than in germanium-corrected images (P < 0.01). Of note, there was a significant difference in the discrepancy between CT-corrected and germanium-corrected values when the lesion was osseous versus nonosseous, for both mean values (11.0% vs. 2.3%, P < 0.05) and maximum values (11.1% vs. 2.1%, P < 0.01).
Comparison of Quantitative Values Between CT-Corrected and Germanium-Corrected Images
Comparison of Quantitative Values in Pathologic Uptake
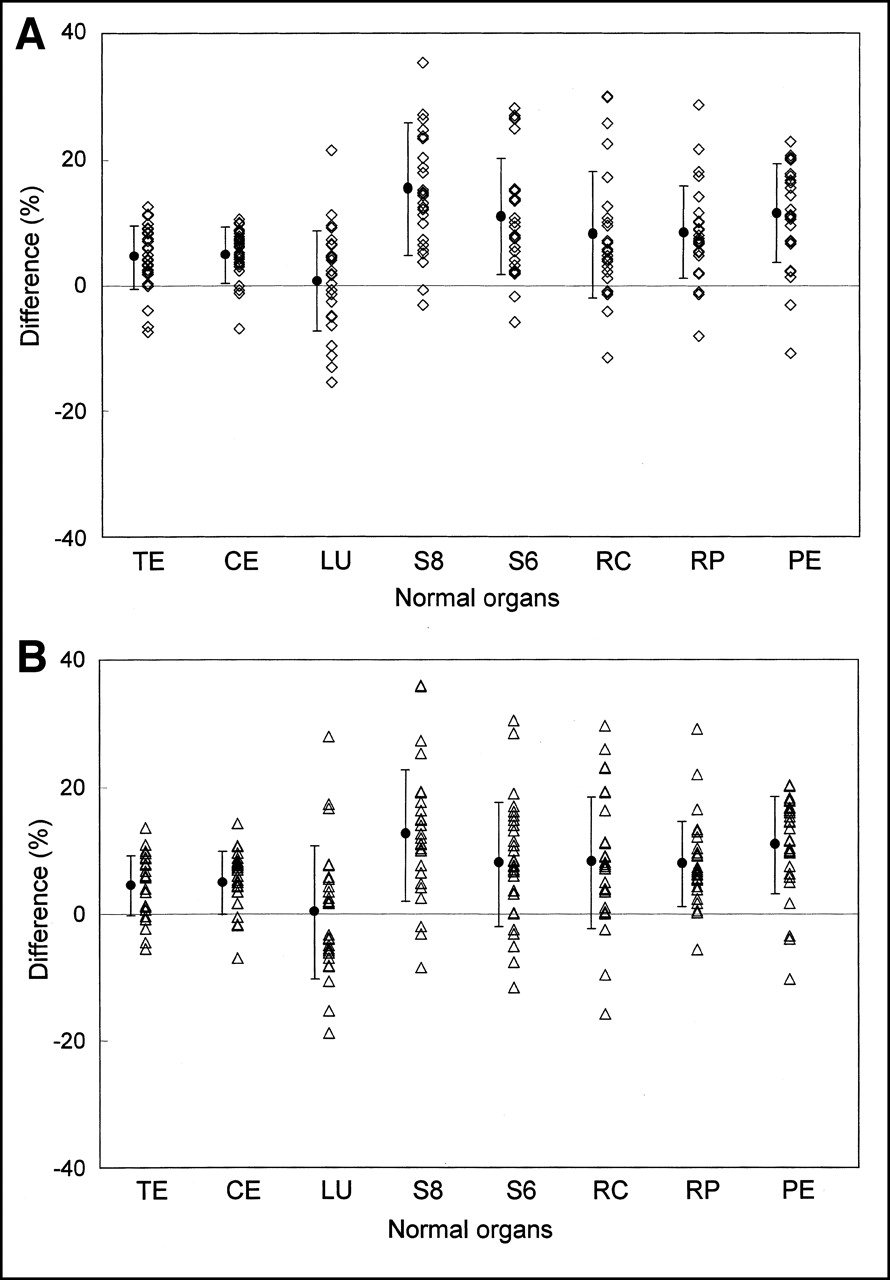
The %Diff between CT and germanium attenuation corrections for normal organs is shown in Figure 3. The %Diff for pathologic uptake and lesion-to-background ratios is shown in Figure 4A and indicates the same tendency observed in normal organs. Lesions in bone showed a higher %Diff between CT- and germanium-corrected images in mean and maximum values (Figs. 4B and 4C) than did nonosseous lesions.

%Diff between CT-corrected images and germanium-corrected images for mean values (A) and maximum values (B). When CT-corrected images show larger uptake values, %Diff is calculated as positive by definition of formula. In lung, plots show comparable scatter in both positive and negative areas, but in all other organs, positive values are predominant, that is, CT attenuation correction values have higher apparent radioactivity concentration than do images reconstructed using 68Ge attenuation correction. TE = temporal lobe; CE = cerebellum; LU = lung; S8 = liver segment S8; S6 = liver segment S6; RC = renal cortex; RP = renal pelvis; PE = pelvis. • = mean ± SD.

%Diff between CT-corrected images and germanium-corrected images for tumor and tumor-to-background ratios (A) and their location-based %Diff for mean values (B) and maximum values (C). As is shown in normal organs, CT-corrected images tended to show higher values than did germanium-corrected images. According to location-based data, %Diff was higher in bone lesions than in nonbone lesions for mean (P < 0.05) and maximum (P < 0.01) values. †Lesions, including colon tumor or lymph node metastasis, that were located in pelvis were classified as pelvis. ‡Lymphadenopathy in pelvic region was excluded from this category and included in pelvis. LN = lymph node; max = maximum; • = mean ± SD.
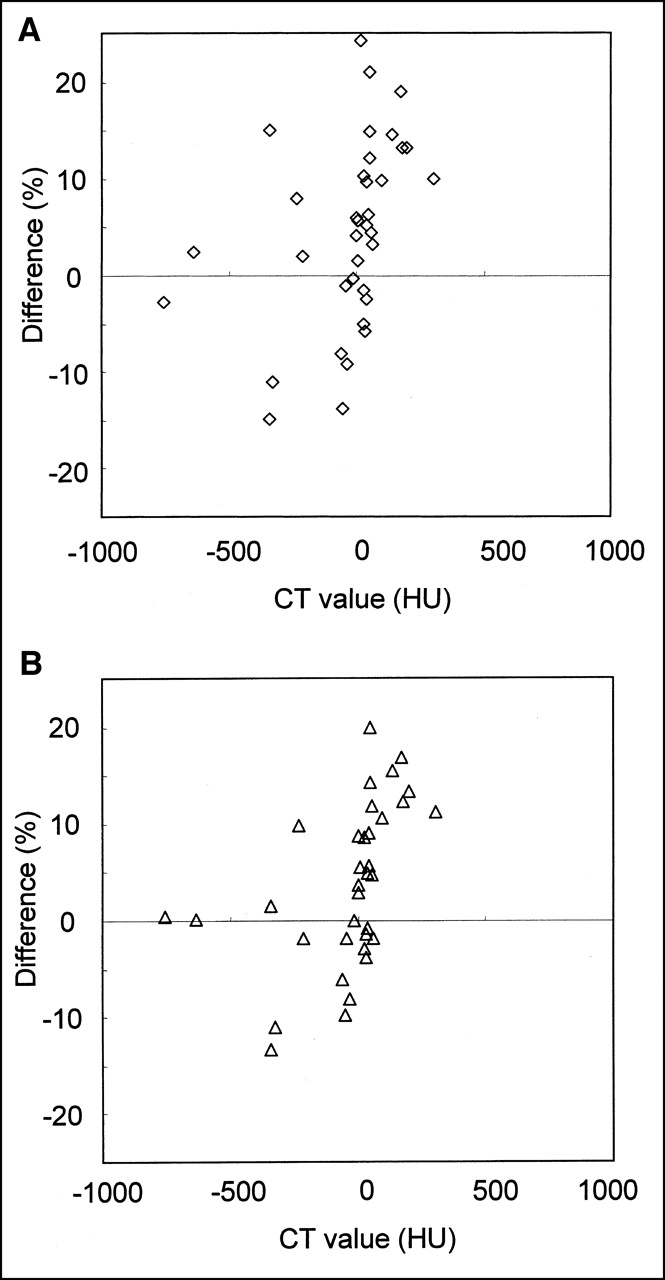
A weak positive correlation (r = 0.38 for mean ROI values and r = 0.45 for maximum ROI values) was found between CT Hounsfield units and %Diff (Fig. 5). However, no apparent correlation was observed between tumor size and % Diff (r = −0.13 for mean values and r = 0.08 for maximum values) or between the average ROI radioactivity values from the 2 images and %Diff (r = 0.08 for mean values and r = 0.08 for maximum values).

Relationship between %Diff and CT value for mean values (A) and maximum values (B). Weak positive correlation was observed between CT values and mean values (r = 0.38; P = 0.021) and between CT values and maximum values (r = 0.45; P = 0.007).
DISCUSSION
Kinahan et al. (12) have identified several potential advantages of using CT transmission scans for attenuation correction versus the more conventional 68Ge source. The first is that CT transmission scans after the administration of the tracer will not significantly be degraded by the 511-keV photons emitted from the PET tracer. The second is that the CT data will have lower statistical noise than will a conventional transmission scan using a radionuclide source, reducing statistical noise in the final attenuation-corrected PET image. A third advantage is that a shorter time is required for the collection of the CT transmission data. Shorter acquisitions are highly desirable in the clinical setting, because they increase patient comfort and scanner throughput. Finally, the external radionuclide source for transmission scanning would be eliminated, as might the cost of including these components and the periodic replacement of decayed radioactive transmission sources. For these reasons, CT acquisition with a combined PET/CT scanner is potentially valuable for CT-based attenuation correction in addition to its primary use in creating fused anatometabolic images. PET transmission images with 68Ge sources use and detect substantially monoenergetic 511-keV annihilation photons, whereas the x-ray source in CT emits photons with a broad and much lower-energy spectrum from 40 to 140 keV (18). Given these varying energies, inconsistencies might be expected between identical emission datasets reconstructed on the basis of the different transmission maps, because of the need to scale or transform the measured CT values to approximate the attenuation coefficients that would have been obtained at 511 keV. Photons of 511 keV are known to be more likely to undergo Compton scatter than photoelectron interactions, which are more frequent for the lower-energy x-rays.
To investigate potential discrepancies caused by the difference of energy between the CT and 68Ge source attenuation images, we assessed quantitative tracer uptake values in normal organs and tumors in emission PET images that have been corrected for attenuation through CT or 68Ge sources. Our data indicate that CT-corrected images produced modestly but significantly higher uptake values than did germanium-corrected images, both in tumors and in normal organs (except the lung). In addition, we observed a marked discrepancy between CT-based and germanium-based lesion uptake values depending on whether the lesion was located in bone.
The water-containing phantom study showed only a borderline difference of 1.6% between the CT-based and germanium-based radioactivity concentration values, whereas considerably larger differences were observed in many organs and tumors. This finding means that the observed differences in patient datasets were highly unlikely to have been caused by errors in the conversion of CT numbers to 511-keV attenuation coefficients for tissues similar to water. However, the considerable difference in discrepancy depending on whether a lesion was located in bone may explain the differences between CT-based and germanium-based ROI values. At the lower CT energies, the 2 primary processes by which photons interact with tissues are the photoelectric effect, which depends on effective atomic number raised to the fourth power, and Compton scattering, which depends on electron density. In contrast, at 511 keV, the primary photon interaction mechanism is Compton scattering. The effective atomic number of bone is significantly higher than that of other tissues. Electron density is quite similar across tissues, including bone. Thus, scaling nonbone CT values to 511-keV attenuation coefficients is, in theory, more straightforward than scaling bony values. Attenuation maps from CT to be used for PET attenuation correction would be expected to be more accurate in nonbone regions than in bone. We thus believe that the differences between CT-based and germanium-based ROI values, and the discrepancies between bony and nonbony lesions, are mainly caused by errors in the conversion of bone CT values to 511-keV attenuation values.
Other factors are likely contributing to our observations as well. Among the normal organs, we did not see significant differences between CT-based and germanium-based values in the lung. In the lung, 18F-FDG uptake is usually low. Small absolute differences in 18F-FDG uptake can thus contribute to larger relative differences. In contrast, in the hepatic S8 segment, %Diff was considerable. Respiratory movement influences this area because it is just below the diaphragm. The upper part of the liver is scanned by CT for a few seconds, whereas 68Ge required 3 min in this study. These scan time differences and respiratory motion may contribute to differences between the 2 corrections in regions near the diaphragm.
In the current study, images were acquired with the arms at the patient’s side. Arms-down imaging attenuates photon flux from the patient but likely reduces arm-motion artifacts. Because of the range of attenuation coefficients at CT energies among tissues, arms-down scanning is more likely to influence the apparent radioactivity values in the chest, abdomen, and pelvis. This influence may partly explain the wide range of %Diff values in normal thoracic and abdominal organs (Fig. 3), compared with the temporal lobe and cerebellum, although respiratory or bowel movement in the abdomen and pelvis can also have an effect.
A weak positive correlation was found between CT Hounsfield units and %Diff. This finding is consistent with the larger difference found for bone lesions than nonbone lesions and is consistent with our hypothesis that errors exist in the conversion of high CT values to 511-keV attenuation coefficients. In contrast, a significant correlation was not observed between %Diff and tumor size or the average measured activity of the 2 images, although the number of lesions that could be evaluated on CT was limited for assessing the relationship between tumor size and %Diff.
In the current investigation, CT-corrected images were produced with measured attenuation correction (MAC) using a CT transmission scan, whereas germanium-corrected images were produced with SAC, with substitution of the average attenuation coefficient within each segment or tissue compartment. Visvikis et al. (19) showed an 8.7% underestimation of average standardized uptake value in filtered backprojection SAC reconstruction, compared with filtered backprojection MAC, when transmission and emission acquisition times were 3 min and 5 min, respectively—scanning times identical to ours. Therefore, differences between MAC and SAC per se might have contributed to the difference in our observations between CT-corrected (with MAC) and germanium-corrected (with SAC) standardized uptake values. Also, Visvikis et al. reported that OSEM, compared with filtered backprojection reconstruction, possibly underestimates standardized uptake values. Therefore, if we wish to more directly address error, we may want to use filtered backprojection-based germanium-corrected images as a standard. However, in clinical practice, whole-body PET images are now widely reconstructed by OSEM SAC, and this is our routine as well. Because we wanted to compare CT-based attenuation correction with our preexisting routine approach, we believed it most appropriate to directly compare CT-MAC and germanium-SAC images reconstructed by OSEM.
CONCLUSION
We have shown the existence of a consistent but moderate difference caused by the use of different transmission data. CT-based radioactivity concentration values were generally higher than germanium-based values, especially in bony lesions. This finding should be noted when quantitative analyses are used in clinical PET, especially when quantitative values are compared across imaging systems. Further, improvements in the accuracy of CT-based attenuation correction values should be possible with more sophisticated correction algorithms.
Footnotes
Received Dec. 26, 2001; revision accepted May 21, 2002.
For correspondence or reprints contact: Richard L. Wahl, MD, Division of Nuclear Medicine, 601 N. Caroline St., Room 3223A, Baltimore, MD 21287-0817.
E-mail: rwahl{at}jhmi.edu
REFERENCES
In this issue


Jump to section
Related Articles
Cited By...
- Synthesis of Patient-Specific Transmission Data for PET Attenuation Correction for PET/MRI Neuroimaging Using a Convolutional Neural Network
- Impact of MR-Based Attenuation Correction on Neurologic PET Studies
- Fast Patch-Based Pseudo-CT Synthesis from T1-Weighted MR Images for PET/MR Attenuation Correction in Brain Studies
- MR-Based Attenuation Correction Using Ultrashort-Echo-Time Pulse Sequences in Dementia Patients
- Performance of Whole-Body Integrated 18F-FDG PET/MR in Comparison to PET/CT for Evaluation of Malignant Bone Lesions
- Tissue Classification as a Potential Approach for Attenuation Correction in Whole-Body PET/MRI: Evaluation with PET/CT Data
- Quantitative Assessment of the Influence of Location, Internal Temperature, Idle Time, and Normalization on the Sensitivity of a Mobile PET/CT Scanner
- Does Reducing CT Artifacts from Dental Implants Influence the PET Interpretation in PET/CT Studies of Oral Cancer and Head and Neck Cancer?
- Dual-Modality Imaging: Combining Anatomy and Function
- Cine CT for Attenuation Correction in Cardiac PET/CT
- Accuracy of PET for Diagnosis of Solid Pulmonary Lesions with 18F-FDG Uptake Below the Standardized Uptake Value of 2.5
- Attenuation Correction of PET Images with Respiration-Averaged CT Images in PET/CT
- CT in PET/CT: Essential Features of Interpretation
- Radiation Exposure of Patients Undergoing Whole-Body Dual-Modality 18F-FDG PET/CT Examinations
- Application of Intravenous Contrast in PET/CT: Does It Really Introduce Significant Attenuation Correction Error?
- Why Nearly All PET of Abdominal and Pelvic Cancers Will Be Performed as PET/CT
- Correction for Oral Contrast Artifacts in CT Attenuation-Corrected PET Images Obtained by Combined PET/CT
- Cause and Magnitude of the Error Induced by Oral CT Contrast Agent in CT-Based Attenuation Correction of PET Emission Studies
- Initial Experience with Oral Contrast in PET/CT: Phantom and Clinical Studies