


Abstract
In patients with oral head and neck cancer, the presence of metallic dental implants produces streak artifacts in the CT images. These artifacts negate the utility of CT for the spatial localization of PET findings and may propagate through the CT-based attenuation correction into the PET images. In this study, we evaluated the efficacy of an algorithm that reduces metallic artifacts in CT images and the impact of this approach on the quantification of PET images. Methods: Fifty-one patients with and 9 without dental implants underwent a PET/CT study. CT images through the patient's dental implants were reconstructed using both standard CT reconstruction and an algorithm that reduces metallic artifacts. Attenuation correction factors were calculated from both sets of CT images and applied to the PET data. The CT images were evaluated for any reduction of the artifacts. The PET images were assessed for any quantitative change introduced by metallic artifact reduction. Results: For each reconstruction, 2 regions of interest were defined in areas where the standard CT reconstruction overestimated the Hounsfield units (HU), 2 were defined in underestimated areas, and 1 was defined in a region unaffected by the artifacts. The 5 regions of interest were transferred to the other 3 reconstructions. Mean HU or mean Bq/cm3 were obtained for all regions. In the CT reconstructions, metallic artifact reduction decreased the overestimated HUs by approximately 60% and increased the underestimated HUs by approximately 90%. There was no change in quantification in the PET images between the 2 algorithms (Spearman coefficient of rank correlation, 0.99). Although the distribution of attenuation (HU) changed considerably in the CT images, the distribution of activity did not change in the PET images. Conclusion: Our study demonstrated that the algorithm can enhance the structural and spatial content of CT images in the presence of metallic artifacts. The CT artifacts do not propagate through the CT-based attenuation correction into the PET images, confirming the robustness of CT-based attenuation correction in the presence of metallic artifacts. The study also demonstrated that considerable changes in CT images do not change the PET images.
Although the superficial extent of most primary oral cancers is evident by clinical examination, the depth of tumor invasion, lymph node status, and other lesions may best be evaluated by imaging techniques. 18F-FDG PET and, lately, the combination of PET and CT, PET/CT, have been reported to be effective for the diagnosis, staging, and restaging of malignancies of the head and neck region (1–3). Correction for the attenuation of annihilation photons through the body is required to quantify the distribution of radioactivity in PET images. In stand-alone PET scanners, this correction is based on a transmission measurement using an external source of radiation. The conventional source for transmission measurements in PET scanners is usually made of 68Ge; 68Ge decays by electron emission to 68Ga, which itself decays by positron emission, thus creating a source of 511-keV photons. The introduction of PET/CT has rendered PET transmission measurements with conventional transmission sources essentially obsolete. The CT transmission images can be used to calculate the necessary attenuation factors so long as these are scaled in energy to the values that would have been obtained at an energy of 511 keV. The use of CT-based attenuation correction introduces 2 additional problems. First, the polychromatic x-ray beam can introduce beam-hardening artifacts in the CT images, and second, the proportion of photoelectric interactions to Compton interactions at tissue-equivalent densities is very different at x-ray energies from that at 511 keV.
A major problem with cross-sectional head and neck imaging is nonremovable metallic dental implants, which can severely degrade the visual appearance of CT images and affect the true distribution of Hounsfield units (HU). Many algorithms for reducing metallic artifacts in CT images are referenced in the literature. Among these are algorithms that correct the data in the sinogram with projection completion by interpolation (4–6), by pattern recognition (7), or by linear prediction methods (8). Another class of algorithms that reduce metallic artifacts is iterative algorithms that are modified to ignore missing data (9,10) or that compensate for missing photons in highly attenuated measurements with prior knowledge (11). More recently, a hybrid algorithm has been proposed that combines projection completion with iterative reconstruction (12).
The primary purpose of this study was to determine the effect on PET images, reconstructed with attenuation-weighted ordered-subsets expectation maximization, of reducing metallic artifacts from dental implants in the CT images used for attenuation correction. A secondary purpose was to compare the performance of a novel CT reconstruction algorithm, which was designed specifically to reduce the artifacts introduced by metal in the field of view, with the performance of a standard, commercially available CT reconstruction algorithm that does not reduce metallic artifacts. The evaluation included studying the performance of the 2 algorithms both in reconstruction of CT images through dental implants and in attenuation compensation of the measured distribution of 18F-FDG concentration in tissues of the head and neck.
MATERIALS AND METHODS
Sixty patients (29 women and 31 men; mean age, 63 y; range, 18–89 y; mean weight, 82 kg; range, 50–144 kg) with oral head and neck cancer and referred for the initial staging or restaging of their disease were included in this study. Nine of the patients had no dental implants, and 51 had dental implants. The Guidelines for the Health Insurance Portability and Accountability Act were followed. Informed consent was not required from the patients for this retrospective study, which was approved by the Institutional Review Board of the University of Tennessee Graduate School of Medicine. A CT scan immediately followed by a PET scan was obtained for each patient. The patients were immobilized in a Diagnostic Vac-Lock cushion (Civco Medical Solutions) to minimize movement between the 2 acquisitions.
CT
Each patient was studied on a Biograph-6 PET/CT scanner (Siemens Medical Solutions Molecular Imaging) combining a lutetium oxyorthosilicate–based PET scanner with a 6-slice CT scanner. The CT scans were obtained after the intravenous injection of contrast material. One or 2 scan protocols were used, depending on the preliminary diagnosis. These protocols were a CT scan of the head and neck in which the patient's arms were positioned at the sides (130 kVp, 160 mAs, tube rotation of 1.0 s, collimation of 6 × 2 mm, table feed of 16 mm per rotation, reconstructed slice thickness of 3.0 mm, interslice spacing of 3.0 mm, medium smooth convolution kernel) and a CT scan of the whole body with the patient's arms positioned above the head (130 kVp, 160 mAs, tube rotation of 0.6 s, collimation of 6 × 2 mm, table feed of 17.6 mm per rotation, reconstructed slice thickness of 5.0 mm, interslice spacing of 5.0 mm, and a medium smooth convolution kernel). CareDose (Siemens Medical Solutions) was activated for the 2 protocols. The metallic artifact reduction reconstruction used in this study was the one reported by Lemmens et al. (12). This algorithm was chosen because we found that it had the greatest effect in reducing metallic artifacts from dental implants. Figure 1 shows CT images reconstructed at the same level from data acquired through the dental implants of a patient. Figure 1A shows an image reconstructed using the standard CT reconstruction algorithm, Figure 1B shows an image reconstructed with a published algorithm designed to reduce metallic artifacts (6), and Figure 1C an image reconstructed with the CT metallic artifact reduction algorithm used in this study (12). The CT images reconstructed with the hybrid algorithm tend to show more soft-tissue detail near the dental implants than do the CT images reconstructed by the other 2 algorithms but exhibit nonuniform, position-dependent convergence. This can be seen by comparing the resolution from different regions of the images reconstructed by the iterative metallic artifact reduction algorithm.
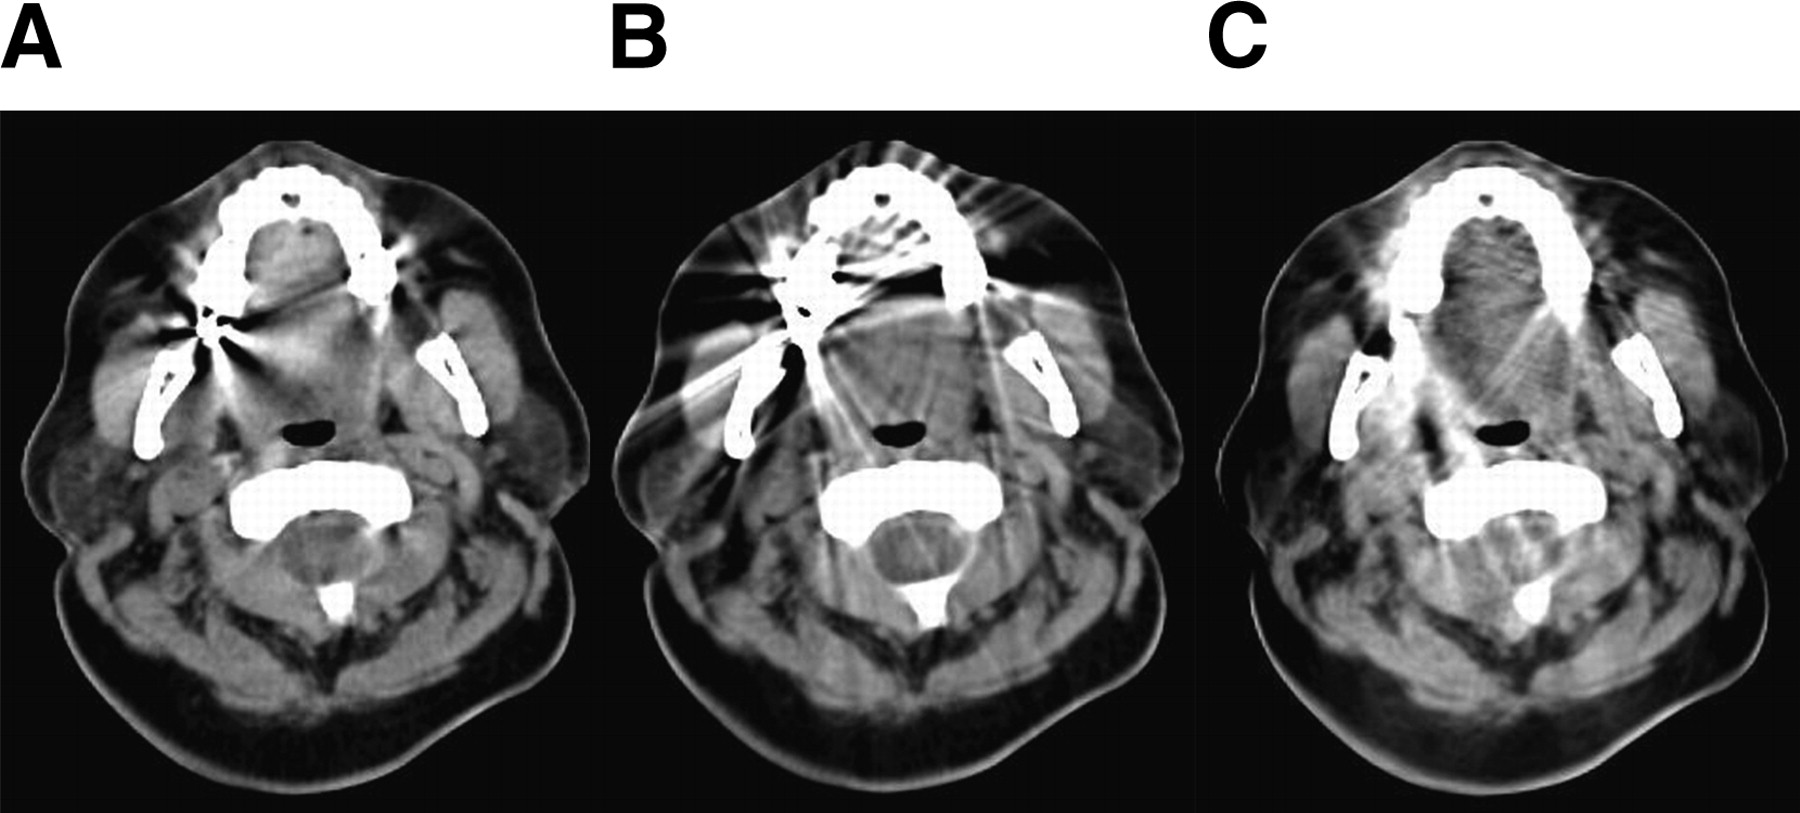
Original CT image (A); analytic CT metallic artifact reduction algorithm (B); and hybrid, iterative CT metallic artifact reduction algorithm (C). Window was 300 HU wide, and level was 30 HU for the 3 images.
18F-FDG PET
Patients were required to fast for at least 6 h before the examination. Each patient was studied 90 min after the intravenous injection of 385 ± 25 MBq of 18F-FDG (range, 295–445 MBq). PET data were acquired for 4 min at each bed position. After compensation for random coincidences and scattered radiation (13), and application of CT-based attenuation correction (14), PET images were reconstructed using an ordered-subsets expectation maximization iterative algorithm (15,16). If the head and neck protocol was used (in which the patient's arms were at the sides), the PET images were reconstructed onto an image matrix of 168 by 168, with 4 iterations, 16 subsets, a zoom of 2, trimmed sinograms, and a gaussian postprocessing filter 5 mm in width. If the whole-body protocol was used (in which the arms were above the head), the PET images were reconstructed onto a matrix of 256 by 256 with 4 iterations and 16 subsets and with a gaussian postprocessing filter 5 mm in width. The PET images were reconstructed to a final image resolution of approximately 8 mm in full width at half maximum. The PET datasets were reconstructed using attenuation correction factors obtained from the standard CT reconstructions and from the metallic artifact reduction CT reconstructions.
Analysis
For each patient, 4 datasets were available for analysis: CT images reconstructed using the standard CT reconstruction algorithm, CT images reconstructed using the metallic artifact reduction reconstruction algorithm, PET images reconstructed using attenuation correction factors derived from the standard CT reconstructions, and PET images reconstructed using attenuation correction factors derived from the metallic artifact reduction reconstructions. All images were evaluated by radiologists experienced in PET/CT.
For each reconstruction, 2 circular regions of interest (ROIs) (10 mm in diameter) were defined in areas where the standard CT reconstruction overestimated the HUs; 2 other ROIs were defined in areas where the standard CT reconstruction underestimated the HUs; and an additional ROI was defined in a region that did not seem affected by the artifacts (Fig. 2). For the patients without metallic artifacts, the ROIs were defined at approximately the same anatomic locations. These 5 ROIs were then transferred to the other reconstructions.

Placement of ROIs used in the analysis.
Mean HUs or mean Bq/cm3 were obtained for all regions. The Kolmogorov-Smirnov (17) test was used to determine whether any of the ROI datasets had a normal distribution. Because none of the datasets were normally distributed, the Spearman coefficient of rank correlation (17) was used to determine whether there was a significant association between the distribution of HUs from the 2 CT reconstructions or between the distribution of Bq/cm3 from the 2 PET reconstructions. In addition, Bland–Altman plots were constructed to assess the agreement between the HUs from the 2 CT reconstructions and the agreement between the Bq/cm3 from the 2 PET reconstructions. All statistical tests were performed at the 5% level of significance.
RESULTS
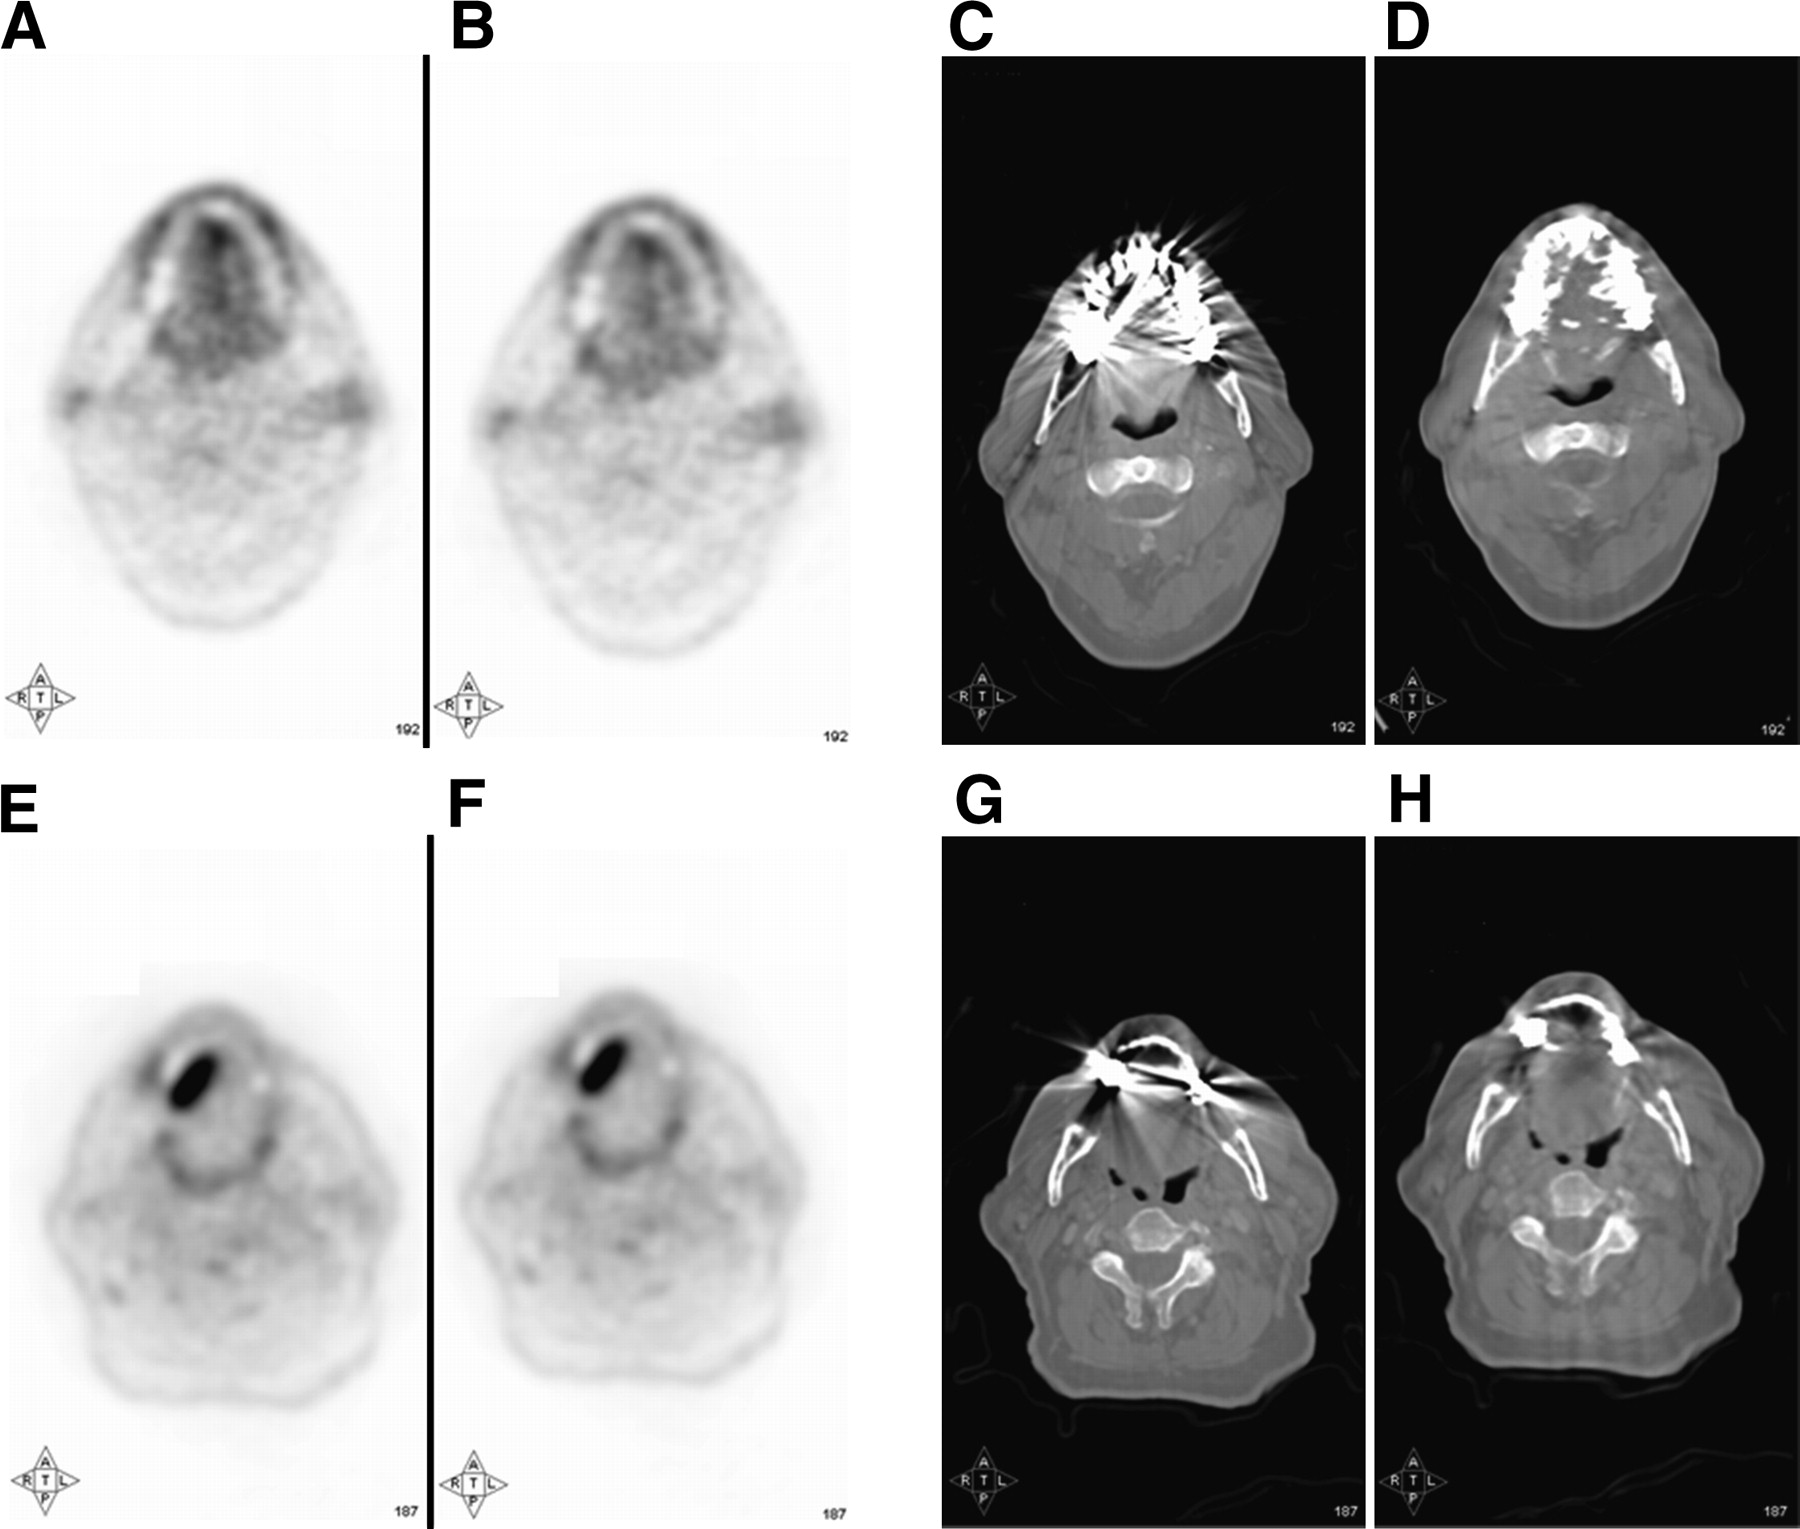
For patients with dental implants, visual analysis revealed considerable changes in the appearance of the CT images, whereas the PET images were virtually identical (Fig. 3). Specifically, there was no change in the diagnostic content of the 2 PET datasets.

Two clinical examples showing PET images reconstructed using standard CT algorithm to calculate attenuation factors (A and E), PET images reconstructed using hybrid algorithm to obtain attenuation factors (B and F), CT images reconstructed using standard CT algorithm (C and G), and CT images reconstructed using hybrid algorithm (D and H).
For patients with and without dental implants, a significant association was seen between the mean HUs from the standard and the metallic artifact reduction reconstructions (Spearman coefficient of rank correlation, 0.53; n = 300; 95% CI for the coefficient of rank correlation, 0.49–0.77; P < 0.0001) (Fig. 4). The metallic artifact reduction algorithm decreased the HUs by an average of 390 units (from 614 to 224 HU) in regions in which HUs were overestimated in standard reconstructions and increased the HUs by an average of 284 units (from −318 to −34 HU) in regions in which HUs were underestimated in standard reconstructions. The algorithm increased the HUs by an average of 28 units (from 39 to 67 HU) in regions in which HUs seemed unaffected in standard reconstructions.

Mean HU from standard CT reconstruction plotted against mean HU from metallic artifact reduction reconstruction. Blue circles correspond to overestimated areas in standard CT reconstruction, green circles correspond to areas unaffected, and red circles correspond to areas of underestimation. In insert, green circles correspond to areas unaffected in standard CT reconstruction in patients with dental implants, and magenta stars correspond to data from patients without dental implants. In each case, solid line represents trend line with slope equal to 0.3.
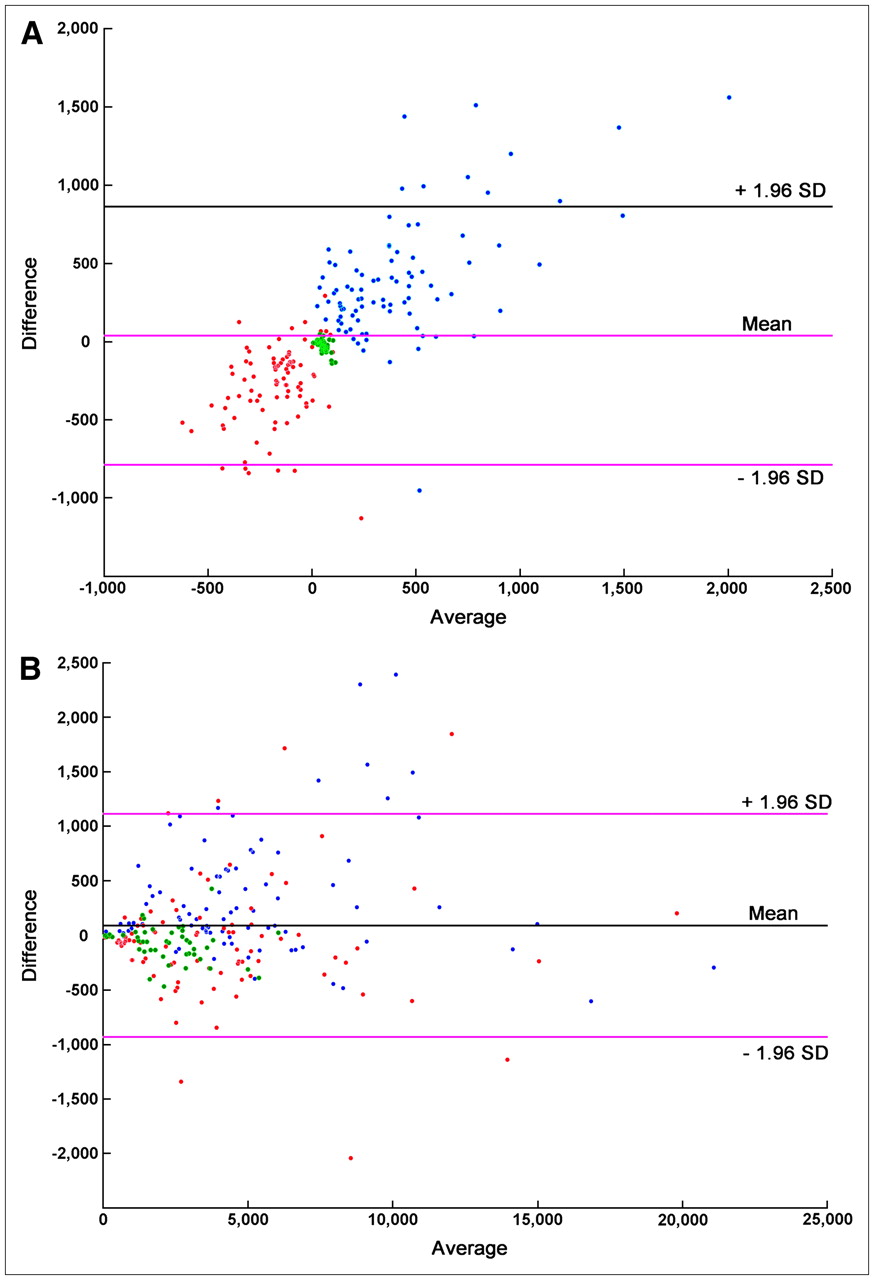
For both the patients with and the patients without dental implants, the Bq/cm3 obtained in reconstructions using attenuation correction factors calculated from standard CT reconstructions were virtually identical to those obtained in reconstructions using attenuation correction factors calculated from metallic artifact reduction CT reconstructions. The change in Bq/cm3 was 6.2% in regions in which the metallic artifact reduction algorithm HUs were overestimated and 1.5% in regions in which the HUs were underestimated. In regions in which HUs seemed unaffected in standard reconstructions, the change in Bq/cm3 was 1.5%. There was almost perfect correlation between the mean Bq/cm3 from the standard and the metallic artifact reduction–derived attenuation correction factor reconstructions (Spearman coefficient of rank correlation, 0.99; n = 300; 95% CI for the coefficient of rank correlation, 0.98–1.00; P < 0.0001) (Fig. 5). Bland–Altman plots revealed a proportional difference between the HUs from the 2 CT reconstructions (Fig. 6A), whereas there was agreement between the Bq/cm3 from the 2 PET reconstructions (Fig. 6B).
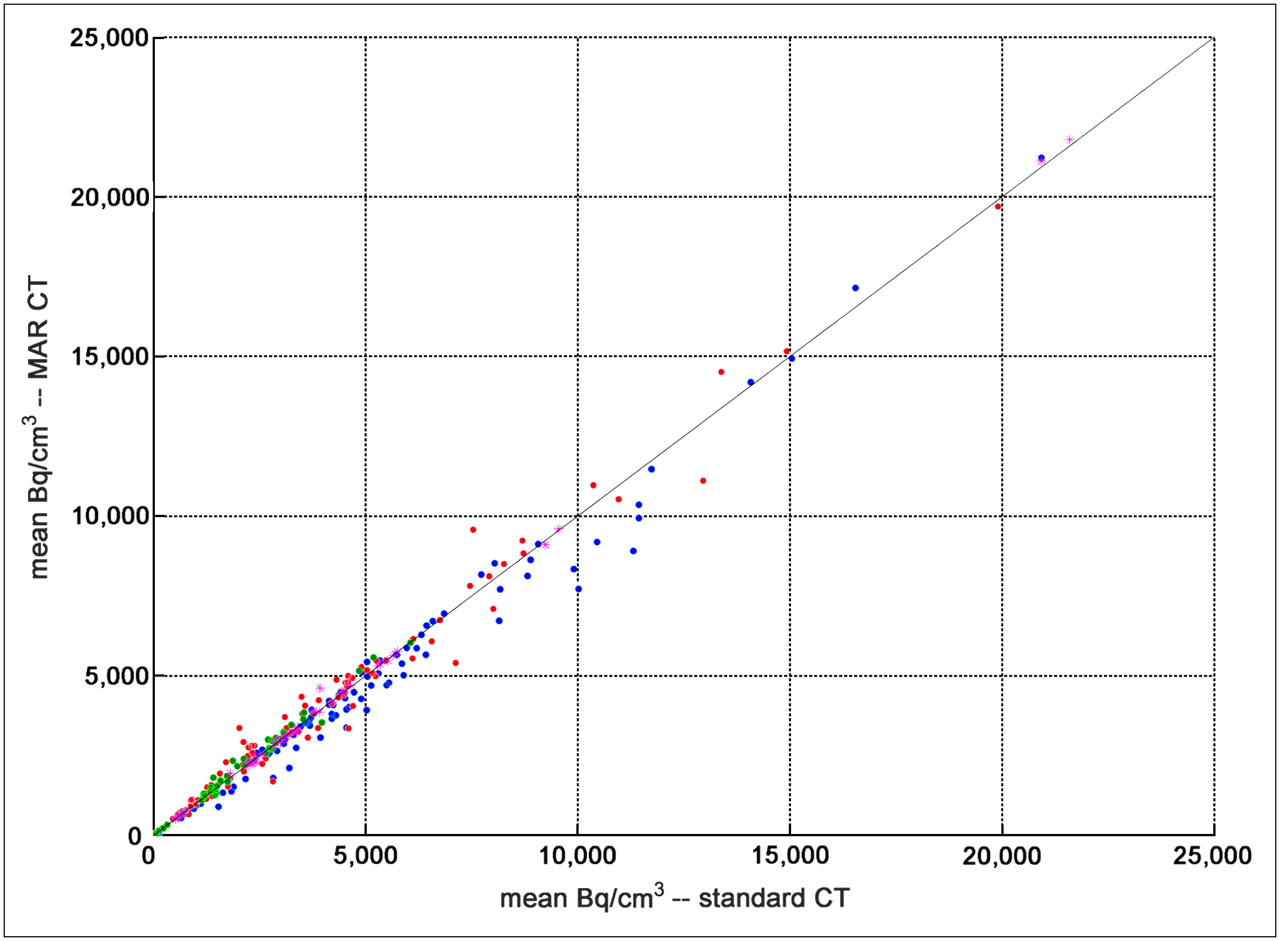
Mean Bq/cm3 using standard CT reconstruction to calculate attenuation correction factors plotted against mean Bq/cm3 from metallic artifact reduction reconstruction. Blue circles correspond to underestimated areas in metallic artifact reduction CT reconstruction, green circles correspond to areas unaffected, and red circles correspond to areas of overestimation. Magenta stars correspond to data from patients without dental implants. Solid line represents line of identity.

Bland–Altman plots for HUs resulting from the 2 CT reconstructions (A) and Bq/cm3 from the 2 PET reconstructions (B). In this plot, difference between results from the 2 reconstructions is plotted against average of the 2 reconstructions. Blue circles correspond to underestimated areas in metallic artifact reduction CT reconstruction, green circles correspond to areas unaffected, and red circles correspond to areas of overestimation.
DISCUSSION
With the introduction of PET/CT, it is now possible to use the CT images to correct the PET dataset for attenuation. Unfortunately, if a patient cannot remove metallic dental prostheses, they will cause artifacts in the CT images. These artifacts may propagate to the PET images through the CT-based attenuation correction factors.
The results of our study show that, even though metallic dental work causes severe artifacts in CT images, these artifacts can be reduced by using an appropriate algorithm. The algorithm suppresses the bright and dark streak artifacts, thereby decreasing the HUs in areas where these values have been overestimated and increasing the HUs in areas where they have been underestimated. The algorithm tends to move over- and underestimated pixel values toward soft-tissue values. The algorithm affects to the same extent the HUs from studies in patients without artifacts.
Our results also demonstrate that the quantification of PET studies is not affected by large changes in the distribution of HUs in the CT images used to calculate attenuation correction factors. One group has compared PET images corrected for attenuation using either the conventional 68Ge transmission source or a CT-based attenuation correction approach. The group concluded that metallic dental implants can cause artifacts in attenuation-corrected PET images using either a conventional 68Ge transmission source or the CT scan obtained with a PET/CT camera (18,19). It is worth pointing out that several studies comparing CT- and germanium-corrected emission data have reported a bias in activity concentration and uniformity (20,21) between the 2 datasets. The conclusion of another study was that attenuation correction of PET emission data using an artifactual CT map yields false values in regions near artifacts caused by dental metalwork (22).
Another potential source of artifacts comes from the use of highly attenuating contrast material during the CT portion of the PET/CT examination. However, studies analyzing the effect of either intravenous (23) or oral (24) contrast material on PET/CT examinations reported that the use of the contrast agent did not introduce clinically significant artifacts in the PET images.
The main difference between the studies reporting artifacts in CT-based attenuation-corrected PET images (18,19) and our study is the use, in those studies, of 2 separate acquisitions for the calculation of the attenuation correction factors—either CT or germanium measurements—whereas we used the same dataset reconstructed in 2 different ways. The reliance on 2 separate acquisitions introduces the possibility that the 2 sets of images from which the attenuation correction factors were derived were not exactly aligned, perhaps because of patient motion (25). This misregistration can play an important role in introducing falsely increased uptake on PET/CT (26).
CONCLUSION
The results of our study demonstrate that the metallic artifact reduction algorithm can enhance the structural and spatial content of CT images in the presence of metallic artifacts. More important, our study showed that considerable changes in the CT images used to calculate attenuation correction factors do not affect quantification of the PET images.
Acknowledgments
This study was presented in part at the First World Congress of the International Academy of Oral Oncology, May 17–20, 2007, Amsterdam, The Netherlands, and at the 54th Annual Meeting of the Society of Nuclear Medicine, June 2–6, 2007, Washington, DC. The study was supported by Siemens Medical Solutions and the Institute for the Promotion of Innovation Through Science and Technology, Flanders (IWT–Vlaanderen).
Footnotes
-
COPYRIGHT © 2008 by the Society of Nuclear Medicine, Inc.
References
- Received for publication December 13, 2007.
- Accepted for publication March 7, 2008.


