


Abstract
We previously reported that respiratory motion is a major source of error in quantitation of lesion activity using combined PET/CT units. CT acquisition of the lesion occurs in seconds, rather than the 4–6 min required for PET emission scans. Therefore, an incongruent lesion position during CT acquisition will bias activity estimates using PET. In this study, we systematically analyzed the range of activity concentration changes, hence SUV, for lung lesions. Methods: Five lung cancer patients were scanned with PET/CT. In CT, data were acquired in correlation with the real-time positioning. CT images were acquired, in cine mode, at 0.45-s intervals for slightly longer (1 s) than a full respiratory cycle at each couch position. Other scanning parameters were a 0.5-s gantry rotation, 140 kVp, 175 mA, 10-mm couch increments, and a 2.5-mm slice thickness. PET data were acquired after intravenous injection of about 444–555 MBq of 18F-FDG with a 1-h uptake period. The scanning time was 3 min per bed position for PET. Regularity in breathing was assisted by audio coaching. A commercial software program was then used to sort the acquired CT images into 10 phases, with 0% corresponding to end of inspiration (EI) and 50% corresponding to end of expiration (EE). Using the respiration-correlated CT data, images were rebinned to match the PET slice locations and thickness. Results: We analyzed 8 lesions from 5 patients. Reconstructed PET emission data showed up to a 24% variation in the lesion maximum standardized uptake values (SUVs) between EI and EE phases. Examination of all the phases showed an SUV variation of up to 30%. Also, in some cases the lesion showed up to a 9-mm shift in location and up to a 21% reduction in size when measured from PET during the EI phase, compared with during the EE phase. Conclusion: Using respiration-correlated CT for attenuation correction, we were able to quantitate the fluctuations in PET SUVs. Because those changes may lead to estimates of lower SUVs, the respiratory phase during CT transmission scanning needs to be measured or lung motion has to be regulated for imaging lung cancer in routine clinical practice.
The use of combined PET/CT provides a convergence of metabolic and anatomic imaging to characterize lung lesions. In addition to reducing the whole-body transmission scanning time to less than a minute, combined PET/CT can improve the matching of PET and CT data by the use of a defined respiratory protocol (1). A PET image alone corresponds to an average of multiple respiratory cycles and is susceptible to motion-related distortion. However, CT data, which are used for attenuation correction, produce an image from a fraction of the respiratory cycle in a time that is on the order of seconds (2). The result is an image carrying less visual noise and greater diagnostic and radiotherapeutic importance. The requirement for effective attenuation correction, as well as improved spatial resolution, is that PET and CT data correspond to the same respiratory phase (3) and spatial details (1), without which the CT-based attenuation-corrected PET images would be inaccurate.
For PET data reconstruction, some respiratory phases for CT scanning are disadvantageous (2). In order to correlate PET and CT at a certain respiratory phase, the patient’s breathing throughout CT scanning needs to be regulated to minimize the distortional effects of respiratory movement. The breathing protocol involves coaching patients on their breathing before they are scanned. The optimal respiratory pattern can be established as either shallow breathing or sustained normal expiration (3). Conversely, imaging during end inspiration and end expiration is suspected to create serious PET/CT coregistration errors (2). The challenge of matching PET and CT datasets for attenuation correction has been met through the rebinning and filtering of CT data to closely fit the resolution of PET (1).
The quantitative accuracy of CT-based attenuation-corrected PET emission images is important for the derivation of the standardized uptake value (SUV) of a lesion. The SUV, a semiquantitative value, is a measure of metabolized 18F-FDG in a region of interest relative to the injected activity per body mass. SUV is used to differentiate between benign and malignant lesions as a semiquantitative parameter. Reports show that the threshold for this differentiation varies between 2.5 and 5.0 g/mL (4–6), depending on the reconstruction method, filter parameters, and postinjection scan time. A high SUV could be a consequence of inflammatory activity in tissue (5). SUV alone provides an incomplete assessment of the condition of the tissue. Combined PET and CT data can sometimes assist in overcoming this ambiguity by incorporating anatomic data as well. However, a mismatch between PET and CT because of respiration may degrade the quality of attenuation correction of PET images and consequently produce inaccurate SUVs (7). In this study, we examined lesion motion in respiration-correlated CT datasets of patients with lung lesions. The consequences of using CT image sets at different respiratory phases for attenuation correction of PET emission data were analyzed, allowing us to quantitate changes in SUV during various cycles of respiration. Demonstration of this SUV variability has implications for lesion characterization and radiation therapy assessment.
MATERIALS AND METHODS
Respiratory Motion Tracking
A real-time position management respiratory gating system (RPM; Varian Medical Systems) was used to monitor and track respiratory motion. The system tracks the vertical displacement of 2 infrared reflective markers rigidly mounted on a plastic block on the patient’s abdomen by means of an infrared video camera mounted on the PET table (Fig. 1). The motion of the block is displayed by a graphic interface on the RPM workstation. The user can set a trigger at a defined amplitude or phase within the respiratory cycle that can be used to initiate the acquisition cycle in gated PET (8) or to control the x-ray tube status in CT (9). The motion trace is sampled at a rate of 30 Hz. At each step, the amplitude, the phase, and the time are recorded by the RPM system. In addition, the RPM system records the CT x-ray tube on/off times, thereby time-stamping each CT slice with respiratory phase.
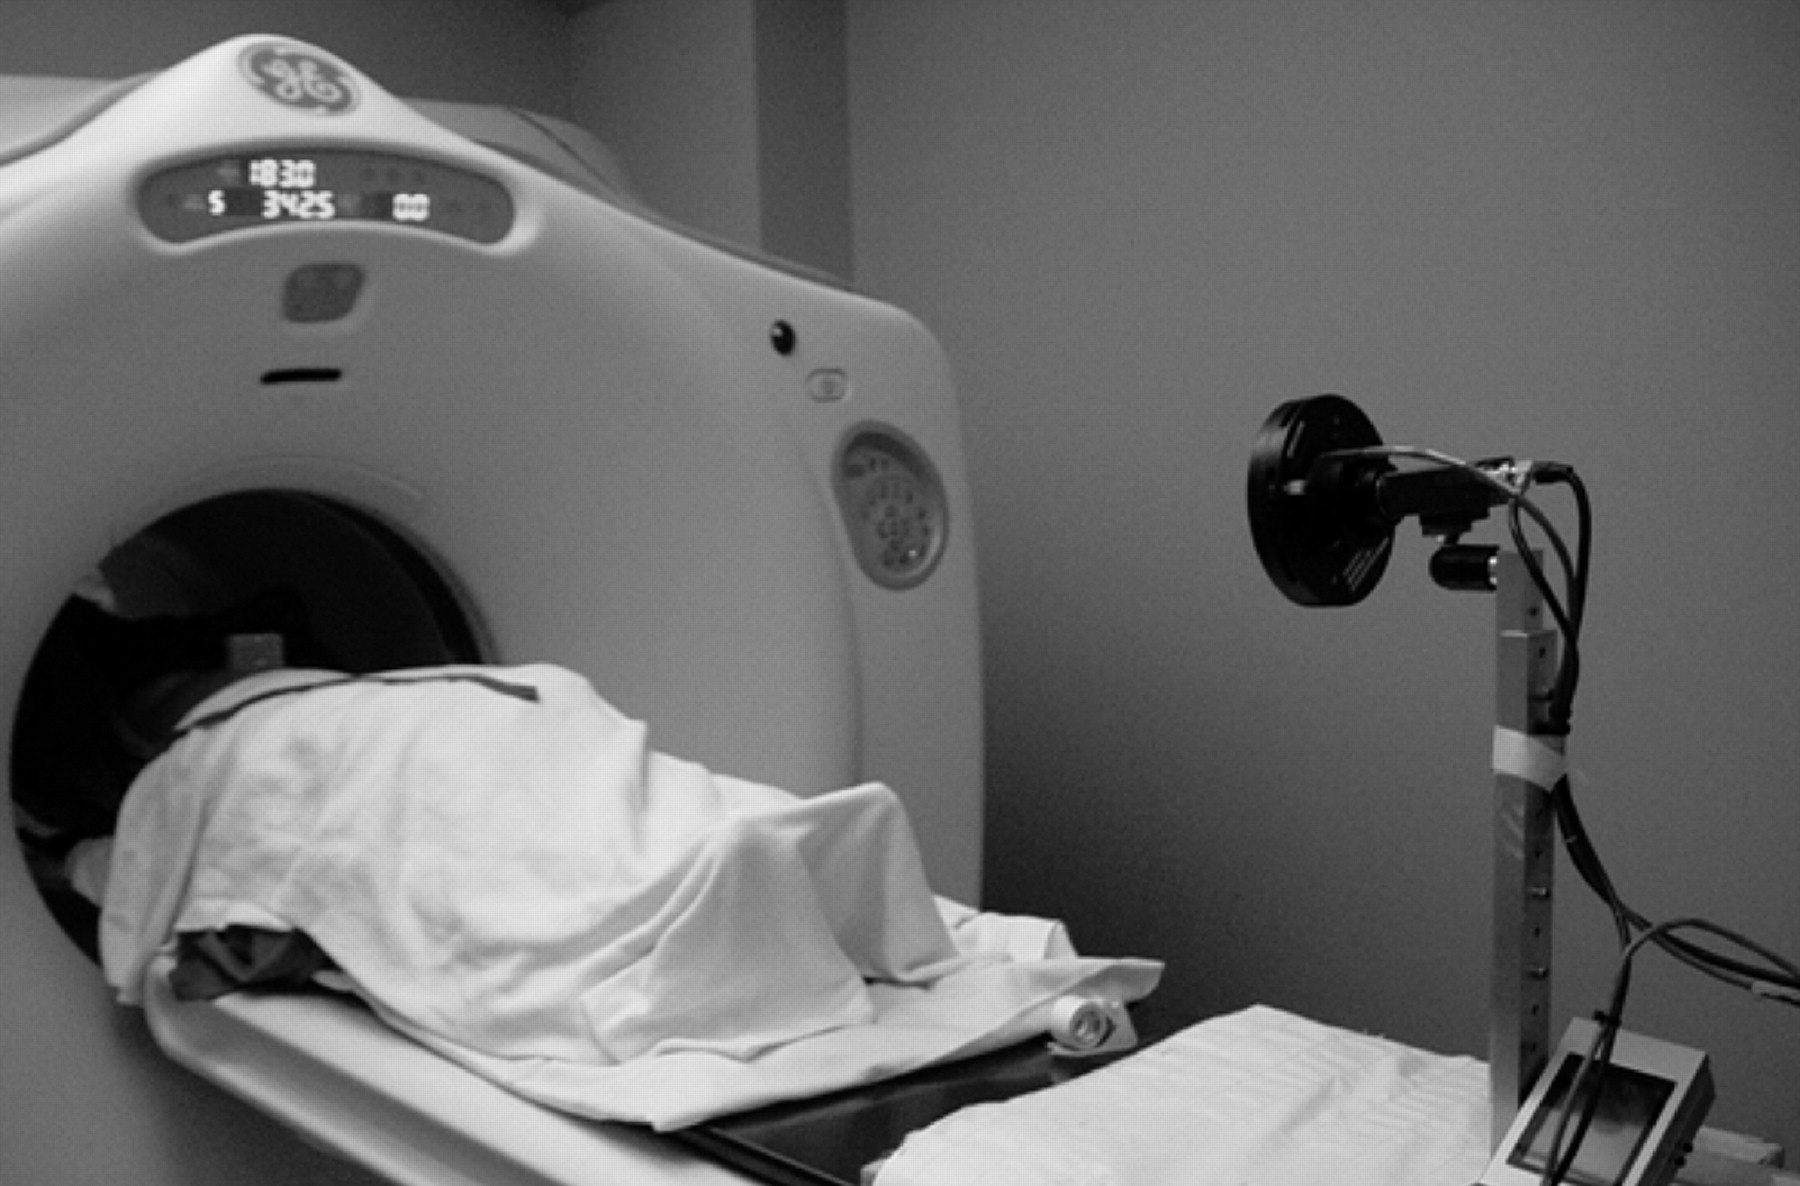
Patient setup in Discovery LS PET/CT scanner (Advance NXi/LightSpeed 4-slice; General Electric Medical Systems) with RPM system in place.
PET/CT Scanner
PET and CT data were acquired on a Discovery LS PET/CT scanner (Advance NXi/LightSpeed 4-slice; General Electric Medical Systems). The CT scanner has a 50-cm transaxial field of view and an available slice thickness of between 0.63 and 20.0 mm. The tube current can be varied between 10 and 440 mA, and the tube voltage settings are 80, 100, 120, and 140 kVp. The PET whole-body scanner has a transaxial field of view of 55 cm and an axial field of view of 15.2 cm. The scanner was used in 2-dimensional (septa extended) mode for high-resolution imaging. The image resolution is 4.2 mm in full width at half maximum.
Patient Data and Preparation
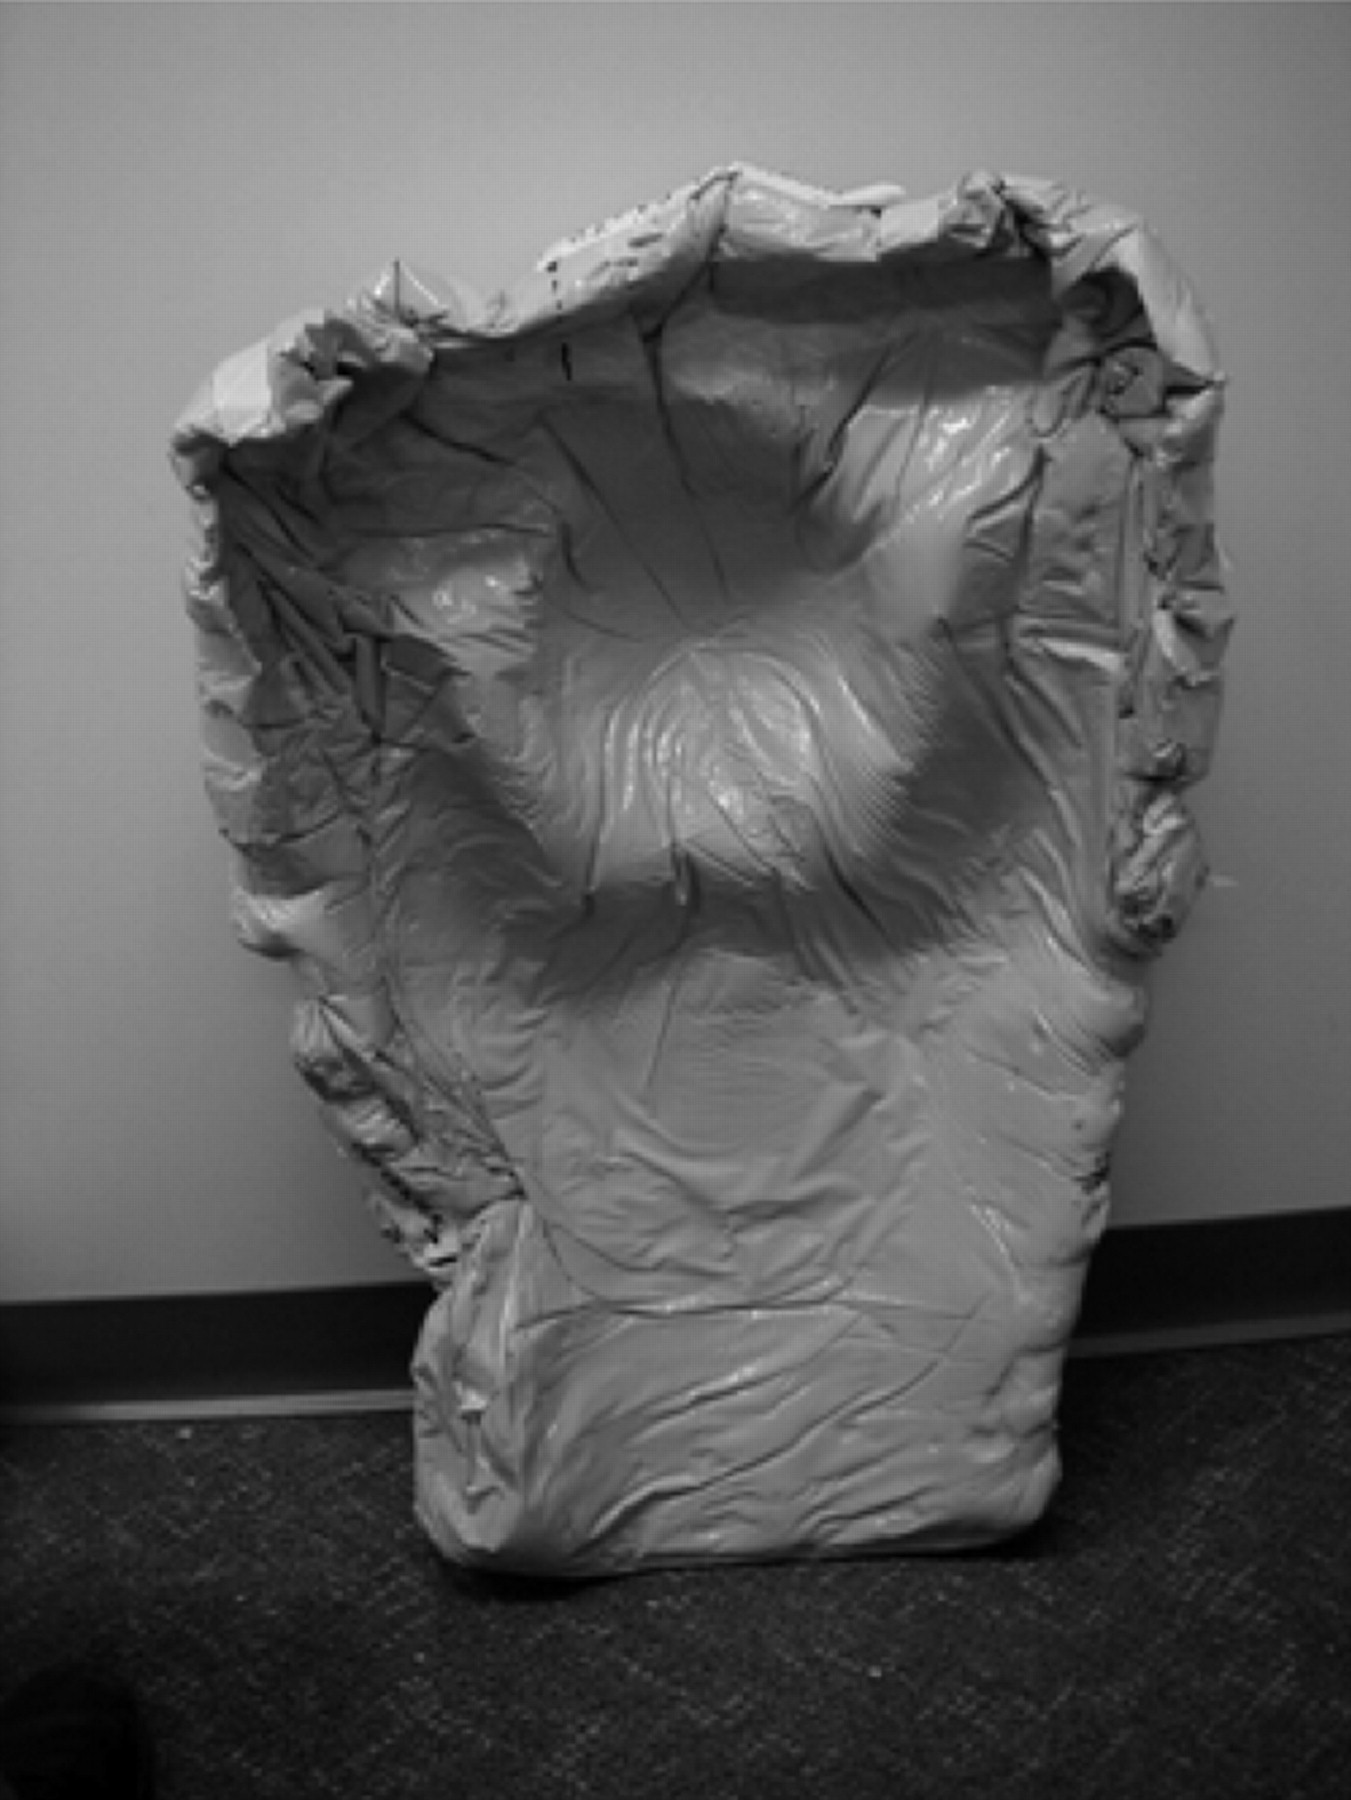
Five patients, designated P1–P5 (2 male and 3 female, aged 59–83 y), with non–small cell lung carcinoma and simulated for gated radiotherapy were included in this study. The patients had been trained to follow customized verbal breathing instructions (“breathe in, breathe out”) during their radiotherapy simulations (10). The same instructions were used during PET/CT studies performed with Advantage 4D software (General Electric Medical Systems). The breathing period for each of the 5 patients was optimized to approximately 5 s. Patients received an intravenous injection of 444–555 MBq of 18F-FDG, which was followed by an uptake phase of approximately 60 min. The patients were then set up as during the simulation CT—that is, supine with arms behind the head—using a customized patient mold (Alpha Cradle Molds) to assist immobilization (Fig. 2).

Immobilization cast that is manufactured for each patient to assist positioning for radiation therapy and 4D PET/CT scanning.
Cine CT Data Acquisition
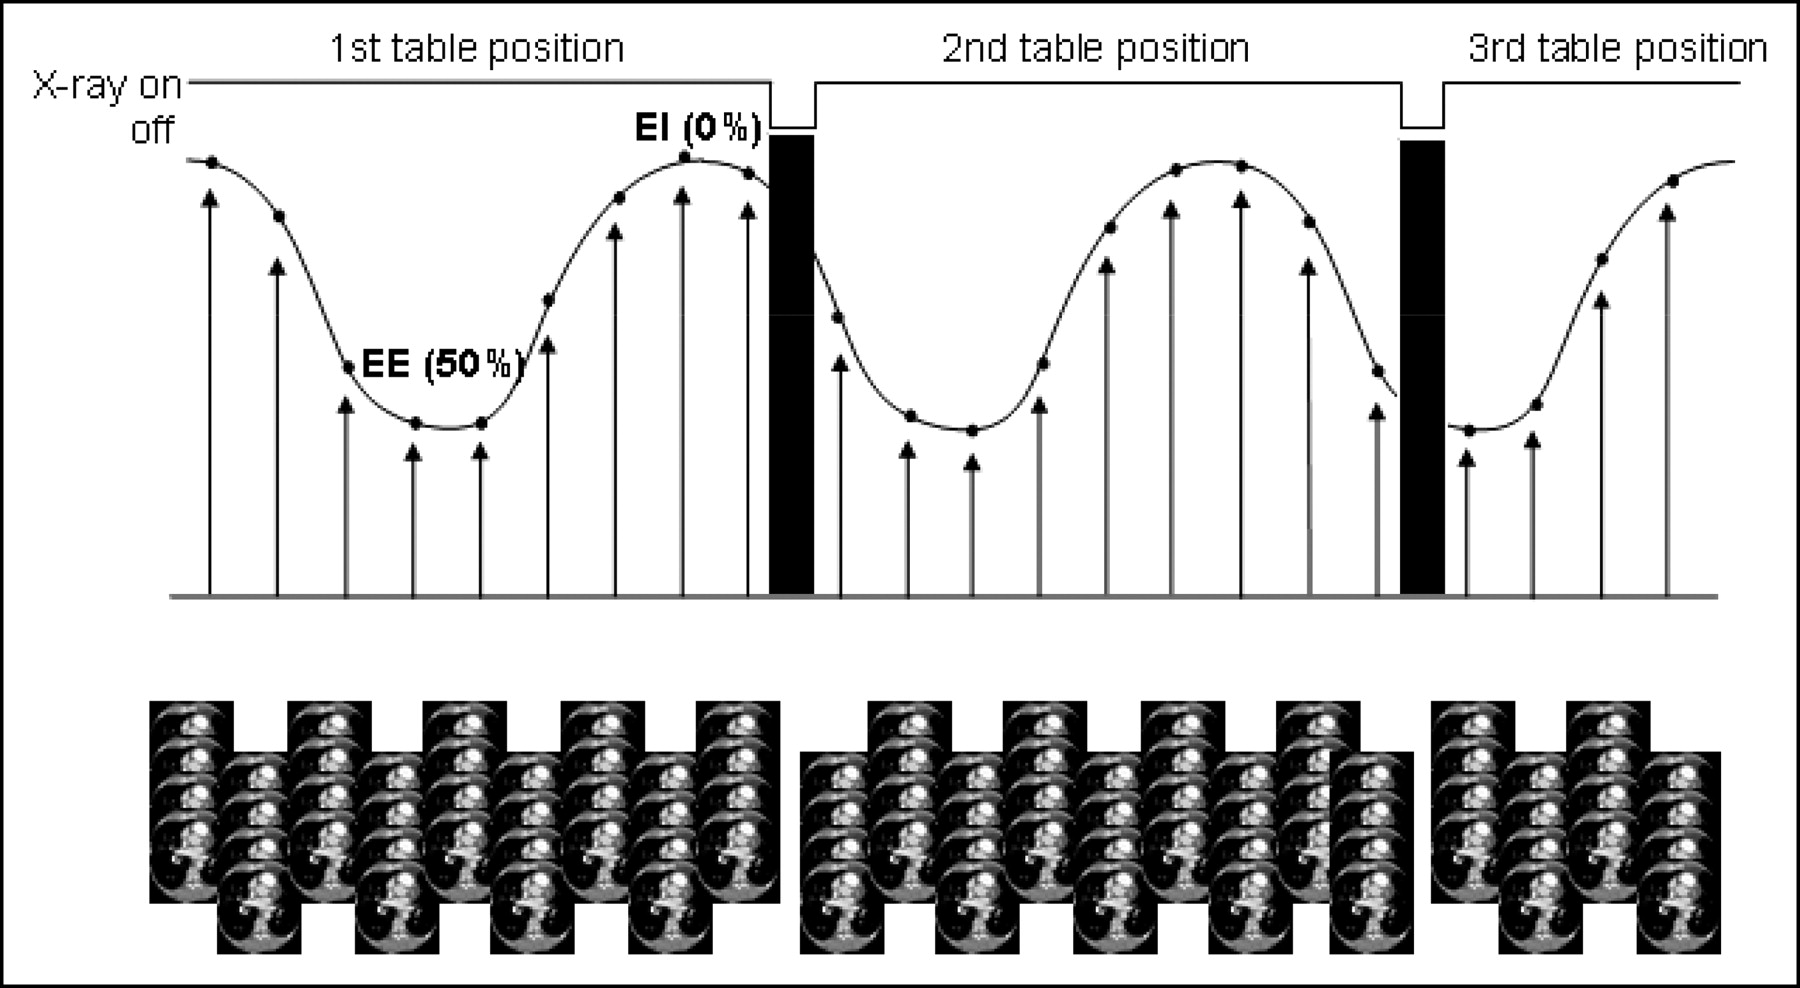
CT data were acquired in cine mode, using a step-and-shoot technique, at 140 kVp and 175 mA with 4- to 2.5-mm slices, yielding an axial field of view of 10 mm at each bed position. The cine duration was set to one respiratory period of the patient plus 1 s with gantry rotation at 0.5-s intervals between images of 0.45 s, and the total reconstruction angle was 360°. The total axial field of view was set to cover the whole lung from the apex to 1–2 cm below the diaphragm at end inspiration. The respiratory motion data recorded by the RPM included a flag to indicate the time the x-ray tube was on. The CT acquisition requires about 3 min on average, depending on the patient breathing period and the axial length of the lungs. Figure 3 illustrates the location of each CT scan with respect to the respiratory waveform and the definition of phases.

Illustration of respiratory waveform recorded by RPM. Arrows demonstrate the acquisition of CT scans. At each acquisition, 4 CT slices are generated.
Clinical PET/CT Data Acquisition
A scout image with settings of 30 mA and 120 kV was first acquired to determine the scanning field of the patient. Helical CT followed, using scanning parameters of 140 kV, 80 mA, a 5-mm slice thickness at 4.25-mm intervals, and a gantry rotation period of 0.8 s. This scan was then followed by a PET scan, which covered the same area at 3 min per bed position. The effective axial field of view was 14.8 cm for each bed position, as there was a 1-slice overlap between each axial field of view. During the PET scan, the patients received audio prompting for inhalation and exhalation to help maintain regular breathing.
CT and PET Data Processing
The CT images (approximately 1,100–1,300 per study) were transferred to the Advantage 4D workstation for processing. During the reconstruction, the workstation uses the respiratory signal recorded by the RPM system to correlate the CT images with phase and then to sort the CT images into 10 equally spaced phase groups, from 0% to 90% in 10% increments, where 0% and 50% correspond to end of inspiration (EI) and end of expiration (EE), respectively (Fig. 4). The 4D CT algorithm selects images that are within a user-specified tolerance (usually 4%) in each phase group. In cases where, because of irregular patient breathing, a phase group did not have images within the tolerance at one or more couch positions, we reviewed the patient’s respiratory cycles and manually selected images within either a 5% or 6% tolerance. In addition, the 2.5-mm-thick cine images were rebinned into 5.0-mm slices at the locations of the helical CT slices, to ensure that the center location and thickness of the CT images at each phase would coincide with those of the PET images (9). The rebinned CT data were then transferred to the PET workstation, where attenuation correction files were generated for PET image reconstruction. An ordered-subsets expectation maximization algorithm with 2 iterations and 28 subsets using a loop filter of 1 cycle/cm (4.3 mm) and a postfilter of 1.4 cycles/cm (6 mm) was applied for reconstruction of PET emission data. The final reconstructed image size was 128 by 128 pixels, and slice thickness was 4.25 mm.
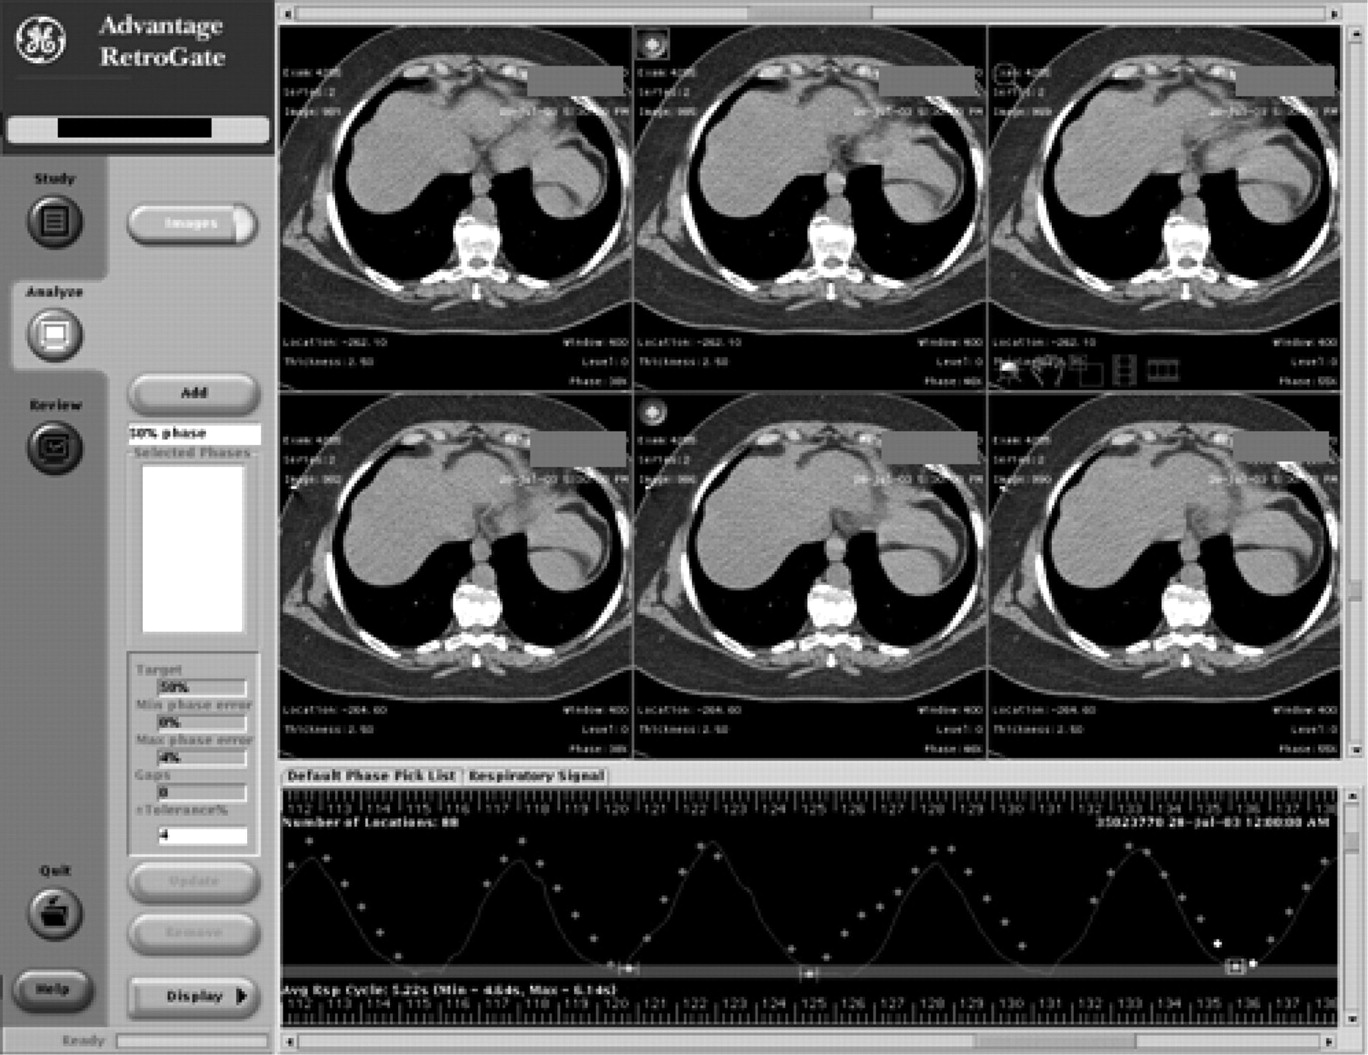
Advantage 4D (General Electric Medical Systems) CT software sorts the CT data into corresponding phases of the respiratory cycle. A respiratory phase can be selected from the default phase list, and the software marks all images at that phase with a blue dot on the upper left corner.
Analysis of CT Motion
The delineation of lung lesions and the calculation of tumor centroids and displacements were done using software written in-house. The lung lesion at each respiratory phase was delineated in the following manner. First, the gross target volume (GTV) of a lesion in the image set that corresponds to EE was drawn by the attending radiation oncology physician who was overseeing the patient’s treatment. A lesion was contoured in a lung window (width = 1,600 and length = −300). The contours of a lesion that corresponded to the 50% phase (EE) were then copied onto the image sets at the other respiratory phases and edited to follow the GTV of a tumor in a specific phase of the respiratory cycle. The CT number–weighted coordinates of the lesion centroid (XC, YC, and ZC) at each phase were determined from:
 Eq. 1
Eq. 1
where xi, yi, and zi are the coordinates of the pixel i in the tumor volume, wi is the CT number for the pixel i, and N is the total number of pixels in a lesion defined by regions of interest.
These coordinates of the centroid were determined for a lesion in phase from 0% to 90% at 10% increments, where 0% corresponds to EI and 50% corresponds to EE. The 3-dimensional displacement (D) of the lesion at each phase relative to the 50% phase is given by:
 Eq. 2
Eq. 2
where Xi, Yi, and Zi are the CT number–weighted coordinates of the centroid at phase I% and X50, Y50, and Z50 are the CT number–weighted coordinates of the centroid at phase 50%.
Measurement of PET SUV
Because of reproducibility concerns, we used the maximum SUVs (SUVmax) for this analysis, and they were retrieved from the PET images using the manufacturer’s software. The method entailed locating the lesion within the slices and recording the maximum pixel of the PET image within the region of interest. We computed the percentages describing absolute value of the difference between the 2 SUVs of the 0% (EI) and 50% (EE) phases:
 Eq. 3
Eq. 3
Computation of Volume and Displacement
To study lesion displacement with respiration in relation to lesion size, we estimated the volume of each lesion at the 50% phase from the CT images as viewed with lung window/level settings and calculated the maximum CT displacement between the 50% phase and the phase of maximum displacement as follows:
 Eq. 4
Eq. 4
RESULTS
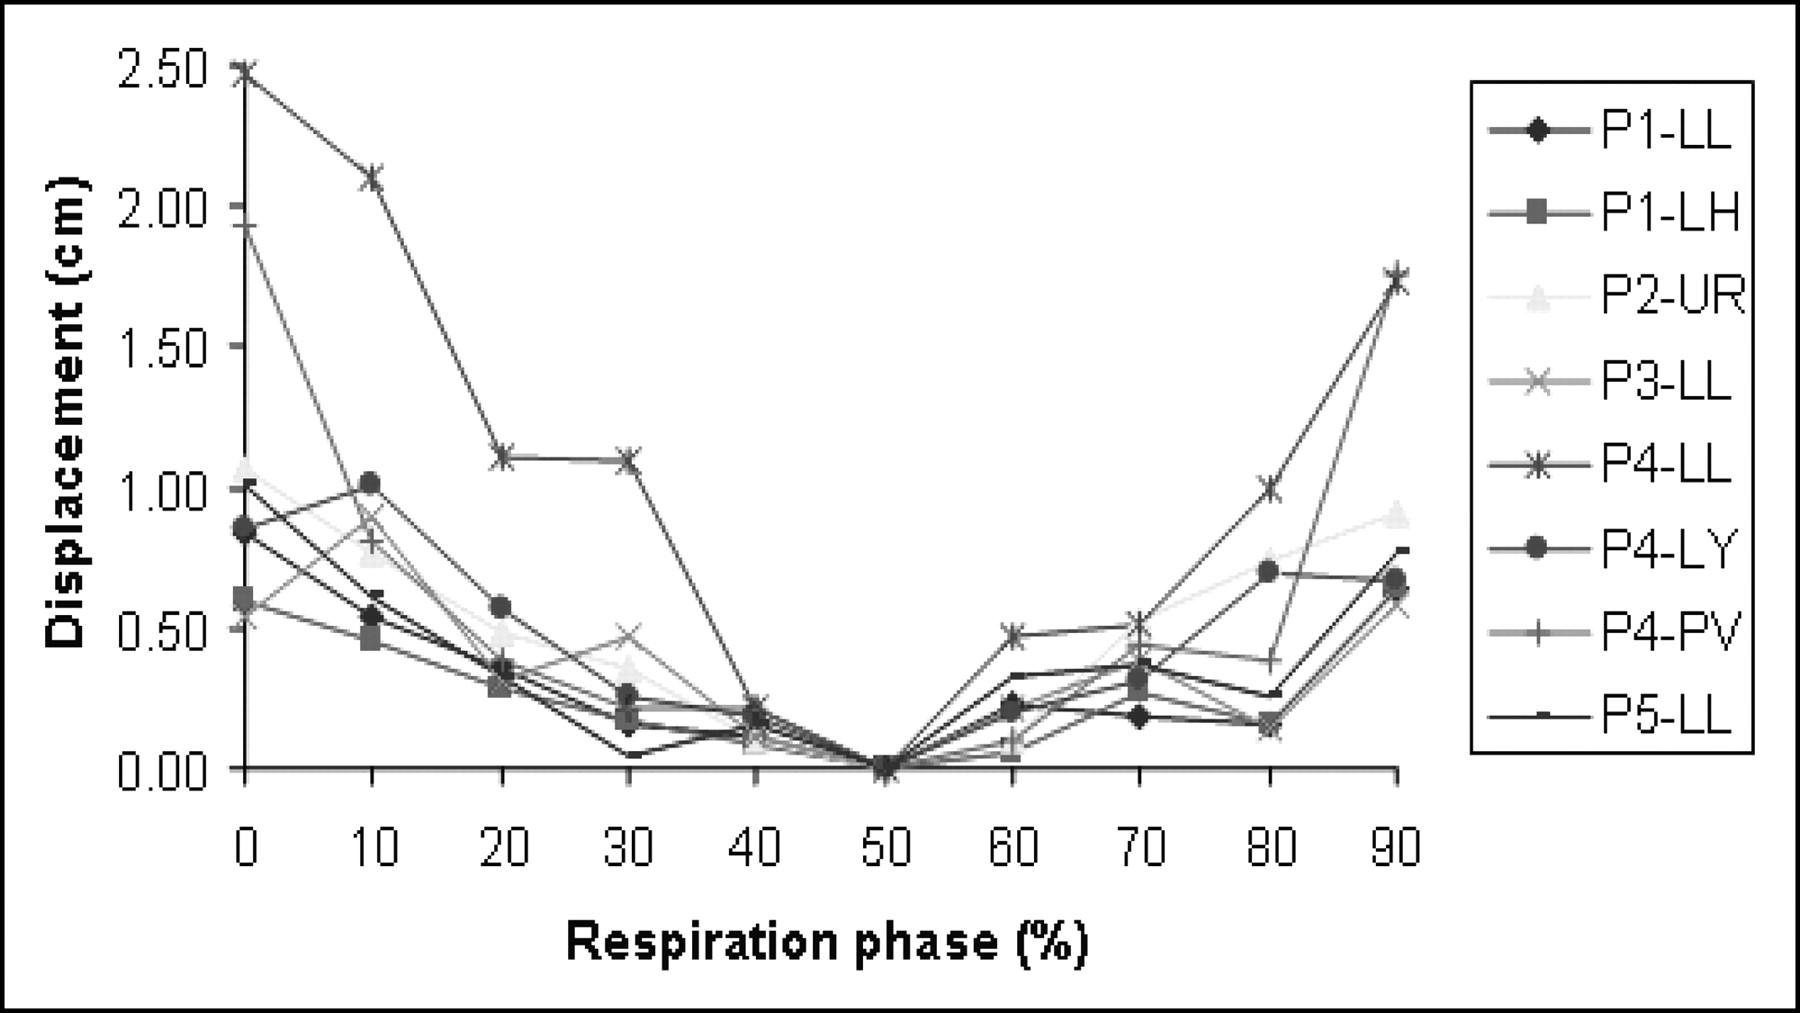
There were 2 lesions in patient 1, 3 lesions in patient 4, and 1 lesion in each of the other patients. Figure 5 shows CT-based lesion displacements in all patients with respect to the EE phase. Percentage differences in SUVmax based on the attenuation correction using the EI and EE phases (Eq. 3) are given in Table 1 along with the corresponding lesion motion measured from the CT images (Eq. 2). Table 1 also shows GTVs measured from EE (50% phase) images. We calculated the percentage displacement of GTV50 with respect to lesion motion between the EI and EE phases (Eq. 4). By expressing the displacement in terms of its relationship to the cube root of the lesion volume for comparative purposes, we observed that a larger percentage of volume displacement corresponded to larger SUV changes. Using attenuation correction obtained from respiratory phases other than EE has resulted in an obvious underestimation of SUVs. Two-tailed paired t testing yielded a P value of 0.015 for SUVs measured at the EE and EI phases. We observed SUVmax changes of up to 24% for the same emission scan, depending on whether it was reconstructed with CT data at the 0% phase or with CT data at the 50% phase. If we consider all phases (in increments of 10% between 0% and 90%), the SUVmax variation can be even higher—for example, in P3, the SUVmax varies by as much as 26% between the 50% and 90% phases, as shown in Figure 6. Figure 6 also shows a significant displacement of the lesion at the 90% phase, compared with other phases. The volume of this lesion, calculated using a published thresholding method (11), was 21% smaller at the 90% phase than at other phases.

Lesion motion quantitated from CT images for all 5 patients with 8 lesions. The displacement at EE (50% phase) was set to 0 so that relative motion with respect to that phase could be measured. The abbreviations are for the lesion locations in the lungs. LH = left hilar; LL = lower left; LY = mediastinal lymph node; PV = prevascular lymph node in mediastinum; UR = upper right.

(A) P3 coronal image with an upper-left lung lesion. (B) The variation of SUVmax with the phases of respiration. (C) After the display thresholds have been set, the lesion boundary is drawn on the 0% phase and copied onto other phases. At the 90% phase, 9-mm displacement of the region of interest can clearly be seen.
Data for 5 Patients with 8 Lesions: Displacement of Lesion Position Between EI and EE Phases, GTV50, Displacement Volume, and Difference in SUVmax
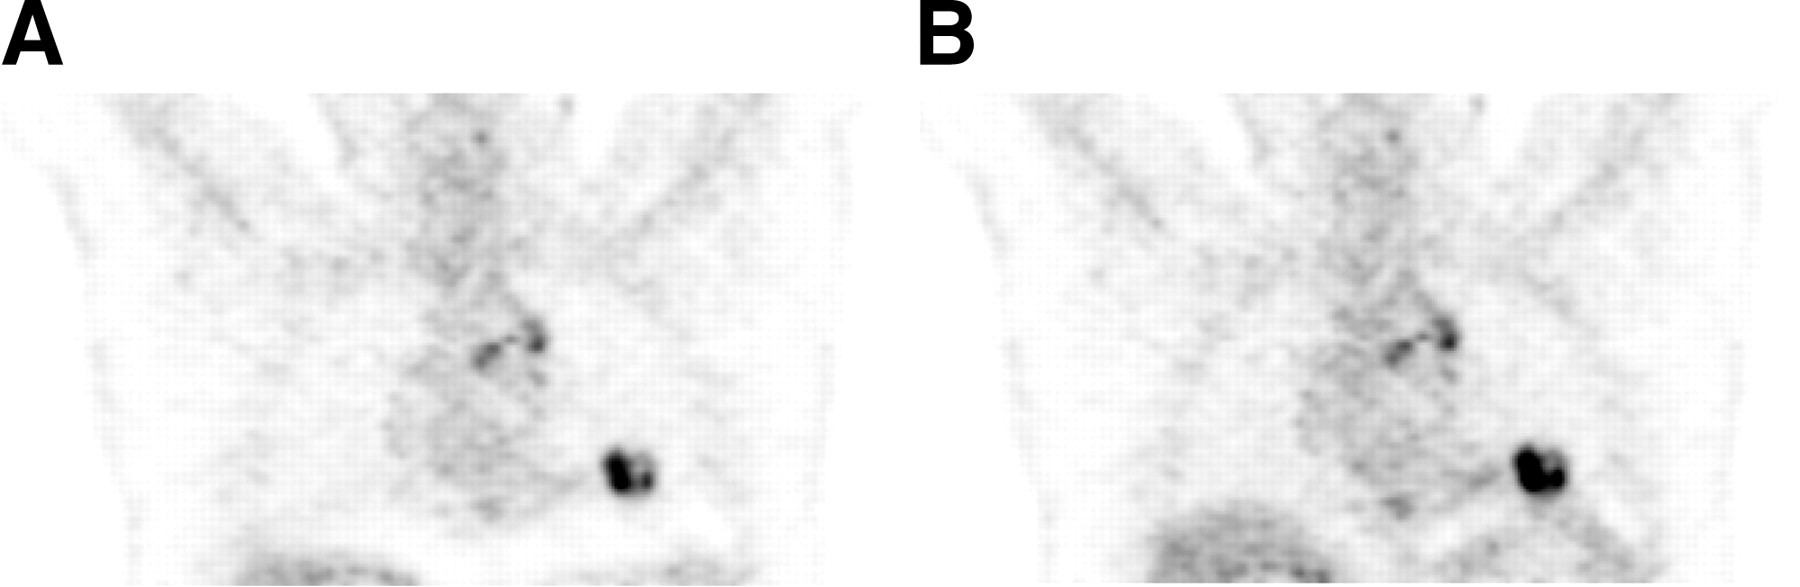
We also analyzed clinical SUVs from the helical CT scans that were used for patient management. To capture the phase information (for only the central slice of the lesion) during the helical CT scans, we acquired the respiratory signal from 2 patients. The findings are summarized in Table 2. As can be seen from the data, SUVs calculated from the clinical CT scans at certain phases of the respiratory cycle fall within the range of SUVs calculated from all phases of respiration. Figure 7 shows the 2 images that yielded the highest and lowest SUV (P4-LL) for the same contrast window settings. The visible difference between the intensities is due to the different CT phases used in the attenuation correction. There is also a difference in the liver and diaphragm positions in these 2 images, although both images were generated from the same PET emission data.

(A) Coronal image of P4-LL reconstructed with CT scans acquired at the 0% phase (EI). The SUVmax of the lesion is 11.5, and lungs are fully expanded. (B) Coronal image of the same lesion reconstructed with the CT scans acquired at the 70% phase. The highest SUV (15.6) is yielded by the 70% phase, rather than the EE phase, because of inaccuracies in calculating the correct phase, changes in the patient breathing pattern, and shifts in the maximum activity pixel between phases. In this 70% phase, the diaphragm is at its highest position in the craniocaudal direction. Both images were captured with the same contrast window settings to eliminate the effects of image perception.
Data for P4 and P5: Lesion Phase, Clinical SUVmax, and Range and % Change of SUVmax for All CT Phases
DISCUSSION
Even with coached breathing, this study has shown a variability of up to 30% for SUVs and up to 21% for PET-measured volumes, generated by the CT attenuation-corrected PET images, as a consequence of CT data acquisition in different respiratory cycles. However, the use of normal expiration rather than coached breathing remains a possible alternative to obtain precise SUVs. Past studies have accepted normal expiration during CT scanning as a feasible protocol for accurate PET and CT image coregistration (3). Alternatively, the uncertainty in SUVs can be managed by measuring and reporting, along with other diagnostic parameters, the respiratory phase (i.e., for the central lesion slice) acquired during the CT transmission scan. Because different sections of the lung experience different amounts of respiratory movement, the effect of CT data on PET reconstruction is influenced by location. For many patients, respiratory motion of the base of the lung, adjacent to the diaphragm, exceeds that of the central or apical regions (3). Lesions near the base should be analyzed with particular caution, since diaphragmatic motion could induce serious fusion errors and remarkable variation in SUVs with different respiratory phases. Additionally, the degree of expansion of the lung tissue changes the photon equivalent pathlength, and consequently, quantitative SUV may be disturbed. In patient 4, a prevascular mediastinal lymph node displayed remarkable displacement that approached 2 cm. For centrally located lesions, respiratory motion artifacts are expected to be less evident, and if we exclude accidental patient motion during CT data acquisition, a remaining explanation could be an augmented effect because of a nearby pulsating vascular structure that pushed this small lymph node in the same direction as a synchronously occurring respiratory movement.
Establishing a breath-hold protocol for CT scanning can delay diaphragmatic motion. Because PET emission scanning covers the entire respiratory cycle, the breath should be held between EI and EE to minimize the difference between the measurement and the nearest true value of SUVmax. However, data acquisition between EI and EE will not be free of errors, and the best fusion match between CT and PET can be achieved through acquiring the CT data for any given region of interest during normal expiration. This breathing protocol can minimize fusion inaccuracies and, consequently, the dependent errors of quantitative measurements. Another option is to use a “slow CT” acquisition, which makes possible the use of a longer gantry rotation (e.g., 4 s) during CT scanning, generating average respiratory effects for each slice (12). The PET SUVs from the patients in this study displayed a range of changes that could also perhaps be attributed to a combination of lesion size and motion amplitude. However, the amplitude of respiratory motion was clearly the major factor causing SUV changes. In general, when motion was about 10 mm or more, we measured SUV changes on the order of 20%. Our observation of a larger percentage of volume displacement, corresponding to larger SUV changes, may be related to our underestimating the CT number of a lesion during CT reconstruction by virtue of spreading its density over an erratic, larger surface area. Using these data to create an attenuation correction map would underestimate the final quantitative measurements. Nevertheless, the type of lung lesion can be variable and can include lymph and lung nodules. Greater lesion displacement and SUV variations should be expected for lung parenchymal lesions, in contrast to lymph nodes, which are relatively anatomically fixed. A higher number of lesions could demonstrate differences between lung nodules and lymph nodes and between locations within the lung. However, to generalize this statement, we need to evaluate more patients. On the other hand, the influence of lesion size can potentially complicate the monitoring of tumor response to radiotherapy. As the tumor undergoes radiation therapy and shrinks, its CT displacements and SUV variability could affect the interpretation of treatment response and result in a misleading indication that treatment was successful.
CONCLUSION
SUV changes that we observed have never been observed with PET scanners using rod sources, since rod transmission scans acquire data averaged over many breath cycles. However, new PET/CT scanners have made it possible to acquire transmission scans in times on the order of seconds rather than minutes. This captures a snapshot of a lesion in motion for only part of the respiratory cycle, giving rise to the problem of accurate attenuation correction. To resolve this motion uncertainty for the measured SUV, the respiratory phase at which the lesion was captured during the transmission CT scan should be measured and reported along with other diagnostic parameters. Because this task will be labor intensive, the alternative of breath-hold or “slow” CT may help improve the reproducibility of SUVs for patients during follow-up scanning. However, patient training is required to ensure that reproducibility.
Acknowledgments
This study was supported in part by research agreements with General Electric Medical Systems and Varian Medical Systems. We also thank Dr. D. Michael Lovelock for software to analyze lung lesion positions in the CT data.
Footnotes
Received Dec. 31, 2003; revision accepted Feb. 5, 2004.
For correspondence or reprints contact: Yusuf E. Erdi, DSc, Department of Medical Physics, Memorial Sloan-Kettering Cancer Center, New York, NY 10021.
E-mail: erdiy{at}mskcc.org


Jump to section
Related Articles
Cited By...
- Improved Alignment of PET and CT Images in Whole-Body PET/CT in Cases of Respiratory Motion During CT
- Gated 18F-FDG PET/CT of the Lung Using a Respiratory Spirometric Gating Device: A Feasibility Study
- Evaluation of a Novel Elastic Respiratory Motion Correction Algorithm on Quantification and Image Quality in Abdominothoracic PET/CT
- Generation of 4-Dimensional CT Images Based on 4-Dimensional PET-Derived Motion Fields
- Respiratory Motion Correction in Oncologic PET Using T1-Weighted MR Imaging on a Simultaneous Whole-Body PET/MR System
- Variable Lung Density Consideration in Attenuation Correction of Whole-Body PET/MRI
- Value of 4-Dimensional 18F-FDG PET/CT in the Classification of Pulmonary Lesions
- Autocontouring and Manual Contouring: Which Is the Better Method for Target Delineation Using 18F-FDG PET/CT in Non-Small Cell Lung Cancer?
- Implementation of an Automated Respiratory Amplitude Gating Technique for PET/CT: Clinical Evaluation
- Single 20-Second Acquisition of Deep-Inspiration Breath-Hold PET/CT: Clinical Feasibility for Lung Cancer
- Role of 18F-FDG PET in Assessment of Response in Non-Small Cell Lung Cancer
- Standards for PET Image Acquisition and Quantitative Data Analysis
- Software Fusion: An Option Never Fully Explored
- Deep-Inspiration Breath-Hold PET/CT of Lung Cancer: Maximum Standardized Uptake Value Analysis of 108 Patients
- Use of H215O-PET and DCE-MRI to Measure Tumor Blood Flow
- Partial-Volume Effect in PET Tumor Imaging
- Dynamic Threshold for Radiation Target Volume by PET/CT
- Deep-Inspiration Breath-Hold PET/CT: Clinical Findings with a New Technique for Detection and Characterization of Thoracic Lesions
- Deep-Inspiration Breath-Hold PET/CT of the Thorax
- 18F-FDG PET Definition of Gross Tumor Volume for Radiotherapy of Non-Small Cell Lung Cancer: Is a Single Standardized Uptake Value Threshold Approach Appropriate?
- The role of PET/CT scanning in radiotherapy planning
- Tissue Characterization of Solitary Pulmonary Nodule: Comparative Study Between Helical Dynamic CT and Integrated PET/CT
- Use of combined PET/CT images for radiotherapy planning: initial experiences in lung cancer
- Attenuation Correction of PET Images with Respiration-Averaged CT Images in PET/CT