


Abstract
Respiratory motion can potentially reduce accuracy in anatomic and functional image fusion from multimodality systems. It can blur the uptake of small lesions and lead to significant activity underestimation. Solutions presented to date include respiration-synchronized anatomic and functional acquisitions. To increase the signal-to-noise ratio of the synchronized PET images, methods using nonrigid transformations during the reconstruction process have been proposed. In most of these methods, 4-dimensional (4D) CT images were used to derive the required deformation matrices. However, variations between acquired 4D PET and corresponding CT image series due to differences in respiratory conditions during PET and CT acquisitions have been reported. In addition, the radiation dose burden resulting from a 4D CT acquisition may not be justifiable for every patient. Methods: In this paper, we present a method for the generation of dynamic CT images from the combination of one reference CT image and deformation matrices obtained from the elastic registration of 4D PET images not corrected for attenuation. On the one hand, our approach eliminates the need for the acquisition of dynamic CT. On the other hand, it also ensures a good match between CT and PET images, allowing accurate attenuation correction to be performed for respiration-synchronized PET acquisitions. Results: The proposed method was first validated on Monte Carlo–simulated datasets, and then on patient datasets (n = 4) by comparing generated 4D CT images with the corresponding acquired original CT images. Different levels of PET image statistical quality were considered in order to investigate the impact of image noise in the derivation of the 4D CT series. Conclusion: Our results suggest that clinically relevant PET acquisition times can be used for the implementation of such an approach, making this an even more attractive solution considering the absence of the extra dose given by a standard 4D CT acquisition. Finally, this approach may be applicable to other multimodality devices such as PET/MR.
Respiratory motion is a source of artifacts in PET, leading to a reduction of both the qualitative and the quantitative accuracy of PET images. Because of the duration of the whole-body PET/CT acquisition, the patient is usually asked to breathe shallowly. As a result, the PET image is a representation of the average respiratory position of the different organs throughout the acquisition (1,2). Vedam et al. (3) characterized respiration as a cyclic process subdividing breathing into 8 phases, namely, peak exhalation; early, mid, and late inhalation; peak inhalation; and early, mid, and late exhalation. Within the context of 4D CT imaging (3-dimensional CT volumes plus time), the robustness of this phase model was unreliable in the case of irregular breathing (3). Alternative approaches accounting for irregular breathing cycles have been proposed, such as adaptive phase binning accounting for the length of individual cycles or, alternatively, the use of respiration amplitude binning (4).
Similarly, in PET imaging, proposed correction methodologies involve the acquisition of gated frames synchronized with patient respiratory motion (5,6). However, the resulting gated images are of lower signal-to-noise ratio (SNR) relative to the respiratory average images, because each of the frames contains only part of the available counts (7). Such synchronized acquisitions facilitate in principle the fusion of PET and CT images without respiratory motion–associated issues. In addition, 4D PET/CT images can be used to derive motion matrices, allowing the combination of respiration-synchronized 4D PET datasets (8–12). Such a process has been previously proposed using either 4D CT images (9,11,12) or, directly, the gated PET frames (8,10). 4D PET/CT acquisitions using such approaches can reduce smearing, improving, in principle, the accuracy in PET/CT image fusion and increasing the accuracy of measured semiquantitative indices such as standardized uptake values.
There are, however, several issues associated with 4D CT images. The first is the increased dose, which cannot be easily justified for all patient acquisitions, delivered by 4D CT. In addition, differences between corresponding gated frames in the 4D PET and 4D CT series have also been reported while using multimodality imaging devices. These differences result in mismatches in respiratory phase–matched PET/CT images (13) and errors associated with the derivation of displacement vectors from 4D CT frames for motion correction in PET (9). Such mismatches are related to differences in the conditions of respiration-synchronized PET and CT acquisitions. A 4D CT image of the thorax can be acquired in less than 1 min, whereas the PET acquisition of the same field of view (FOV) requires 6–9 min (2–3 min per axial FOV). Consequently, a 4D CT image is acquired over 5–6 respiratory cycles; in the case of the PET acquisitions, however, there are several respiratory cycles per axial FOV. Depending on the variability of patients’ respiratory cycle, the level of misalignment between synchronized PET and CT frames can vary. Pan et al. studied the frequency and magnitude of misalignment between the CT and PET data in 100 consecutive PET/CT studies (14). Fifty percent of these cases showed a misalignment, with 34% of these (17% of the whole population) showing a misalignment of more than 2 cm. Such a mismatch leads to various artifacts and compromises quantitative accuracy in the functional images caused by the use of the 4D anatomic datasets for attenuation correction of the corresponding 4D PET acquisitions (14,15).
The main objective of this study was to evaluate the potential of using a standard 4D PET acquisition in combination with a single helical CT image to reproduce the dynamic 4D CT image series. On the basis of the single CT image, the proposed approach consists of generating CT images corresponding to each of the PET respiration-synchronized frames. This generation process is accomplished using the 4D PET image series reconstructed without attenuation correction to derive motion-transformation matrices that are subsequently applied to the single acquired CT image. The proposed method was first tested and evaluated using Monte Carlo–simulated PET datasets of the anthropomorphic (nonuniform rational basis spline) NURBS-based cardiac-torso (NCAT) phantom (16,17), followed by a clinical evaluation using four 4D PET/CT patient datasets.
MATERIALS AND METHODS
General Method Description
On the basis of the availability of a dynamic respiration-synchronized PET image series and a unique helical CT image, the proposed method aims at generating the CT images corresponding to each PET respiration-synchronized frame. The developed methodology involves several steps. First, using the temporal characteristics of the single CT image (phase of the acquired CT) and the temporal information extracted from the PET list-mode data, we reconstructed a PET frame corresponding to the single acquired CT frame with a list-mode–based reconstruction. From here onward, this latter reconstructed PET frame will be referred to as the reference PET frame. The second step involved the reconstruction of non–attenuation-corrected (NAC) respiration-gated PET frames, which are subsequently registered to the reference PET frame using a nonrigid registration to derive the motion matrices. The third and last step consisted of the direct application of the derived transformation matrices to the helical CT image (usually acquired either in full inhale or exhale) to generate the corresponding respiration-synchronized CT frames. The individual steps are described in more detail in the following sections.
Elastic Registration
The elastic registration was performed using a spatiotemporal algorithm for motion reconstruction from a series of images. This method uses a semilocal spatiotemporal parametric model for the deformation based on B-splines and reformulates the registration task as a global optimization problem (18). The obtained transformation, Ut(x), between the PET gated frame, g(x,t), at time t and the PET reference frame, g(x,0), is defined as a linear combination of B-spline basis functions, located in a rectangular grid:
Reference and Synchronized PET Image Generation
Once a single CT image for a given patient is acquired, one can deduce from a synchronized respiratory signal the corresponding temporal information (20). A PET image corresponding to the acquired CT image is reconstructed (reference PET frame) using the PET list-mode data and the acquired CT temporal characteristics. The 1-pass list-mode expectation maximization reconstruction algorithm was used in this study (18). All reconstructed PET volumes were 128 × 128 × 48 voxels, with a voxel size of 4 × 4 × 3.2 mm3 (x,y,z, respectively).
As a next step, NAC PET respiration-synchronized frames (8 and 6 frames for simulated and patient datasets, respectively) are reconstructed and registered to the reference PET frame using the elastic registration method described above. The obtained displacement matrices are subsequently used to generate the 4D CT synchronized frames.
Synchronized CT Frame Image Generation
One way to apply the deformation matrices to the single CT frame, (f(x)), would be to approximate the derived B-spline coefficients using 3-dimensional voxel-based displacement vectors. To avoid such approximations, (f(x)) is instead represented using a 2-dimensional spline interpolation as follows:
Simulated Datasets
A digital NURBS-based 4D cardiac torso phantom (NCAT) (17) was used in the first part of the validation. Eight 3-dimensional emission images and corresponding attenuation maps distributed throughout a regular 5-s respiratory cycle were produced. Spheric lesions of different sizes (diameter, 7, 11, 16, and 21 mm, respectively) were included at different locations throughout the lungs. The first frame represented full exhalation, whereas the maximum magnitude of respiratory motion (full inspiration) occurred between the fourth and fifth frames. The mean motion amplitude was 19.5 and 20.2 mm at the level of the left diaphragm and the tumor, respectively.
The 4D NCAT phantom images were subsequently combined with the model of a clinical PET/CT system developed using GATE (Geant4 Application for Tomographic Emission) (16) to produce dynamic emission images throughout a respiratory cycle. A total of 5.4 million detected coincidences per axial FOV (corresponding to typical clinical acquisition counting rates) were simulated for each of the 8 NCAT temporal frames (9) and stored in a list-mode format.
Clinical Datasets
As a second validation step, the 4D PET/CT acquisitions of 4 patients were used. The clinical data were acquired on a Discovery PET/CT scanner (GE Healthcare). The real-time position management (Varian Medical Systems) was used to display and record the breathing trace of the patients (22). A phase-based threshold was set within the respiratory cycle to initiate the PET gated acquisition or control the CT x-ray tube. The time and the patients’ breathing amplitude and phase were monitored for the duration of the acquisition. The mean motion amplitude and corresponding SD measured on these 4 patients was 16.9 ± 5.9 and 14.2 ± 9.1 mm at the level of the left diaphragm and the tumor, respectively.
Patients received an intravenous injection of 395–555 MBq of 18F-FDG, followed by an average fasting period of 60 min. Patients were then positioned supine on the scanner bed with their arms raised above their head. A specific pillow was used to keep the patient immobilized for the duration of the acquisition. Patients were asked to breathe normally and regularly. All patients provided written informed consent for participation in the 4D PET/CT study, which was approved by the local institutional review board.
Image Analysis and Validation
To validate our approach on simulated datasets, we compared the original NCAT attenuation maps and the corresponding warped attenuation maps produced using the proposed algorithm. Regarding clinical datasets, the acquired 4D CT series (which will be referred to as the original 4D CT) from each patient was compared with the derived 4D CT series. In addition, the derived 4D CT series was used as attenuation maps for the reconstruction of attenuation-corrected PET images with the 1-pass list-mode expectation maximization algorithm. These were subsequently compared with the PET images, which were attenuation-corrected using the original 4D CT images. For the attenuation-correction process, CT images were rescaled to the PET image resolution. Apart from the respiratory motion synchronization, no other form of motion correction was considered in the reconstructed PET images.
Variable levels of statistics were considered in the reconstruction of the NAC PET images to investigate the effect of variable noise levels in the accuracy of the derived CT images. More specifically, NAC-reconstructed images for all 4 patients were produced using 100%, 75%, 50%, and 25% of the overall available statistics (corresponding to a 12-min PET acquisition per bed position).
Local image analysis was performed using profiles over moving parts of the patient’s anatomy such as the diaphragm. In addition, a region-of-interest analysis in the lungs was used to facilitate a comparison between the different attenuation-corrected PET images obtained using the 4D CT series. Within this context, the mean intensity in five 4-cm-diameter regions of interest placed throughout the lung fields was calculated for the different attenuation-corrected PET images.
Finally, a qualitative and quantitative global comparison was performed using difference images and 2 different correlation metrics, respectively. More specifically, the correlation ratio and correlation coefficient metrics were used for multimodal PET/CT comparison (to assess the PET/CT correspondence) and for monomodal CT–CT and PET–PET comparisons, respectively.
The correlation ratio was chosen because of its efficiency in comparing multimodal images (23), measuring the functional dependency between 2 images. Its values range between 0 (no functional dependence) and 1 (purely deterministic dependence). The correlation ratio
The second metric used was the correlation coefficient, which measures a linear affine relationship between the intensities of the compared images. The correlation coefficient
Finally, a validation based on landmark identification was performed (24). A radiologist with more than 15 y of experience in CT imaging was asked to select the same easily identifiable anatomic landmarks in both the original CT images (corresponding to the ground truth) and the warped CT volumes. The Euclidian distance (ED) was subsequently calculated between each point in the reference volume and the warped CT volumes, using the following equation:
RESULTS
Registration Algorithm
Figure 1 shows 2 gated NAC PET images from one of the patients (frames 1 and 4, between which the displacement due to respiratory motion was maximal), reconstructed using only 25% of the available statistics. The warped frame 1 image, also shown, corresponds to the image derived by registering the original frame 1 to the original frame 4. Finally, the corresponding image difference between the original frame 4 and the warped frame 1 is displayed, showing no significant visual differences and intensity differences of less than 1%. Moreover, a high correlation (correlation coefficient, 0.93) was obtained between these 2 latter images. Considering the registration results between frame 1 and all respiratory phases, a mean correlation of 0.95 ± 0.03 was obtained. No differences (mean correlation coefficient, 0.96 ± 0.02) in registration accuracy were seen by increasing the statistical image quality of the gated PET frames, relative to the use of the lower statistics.
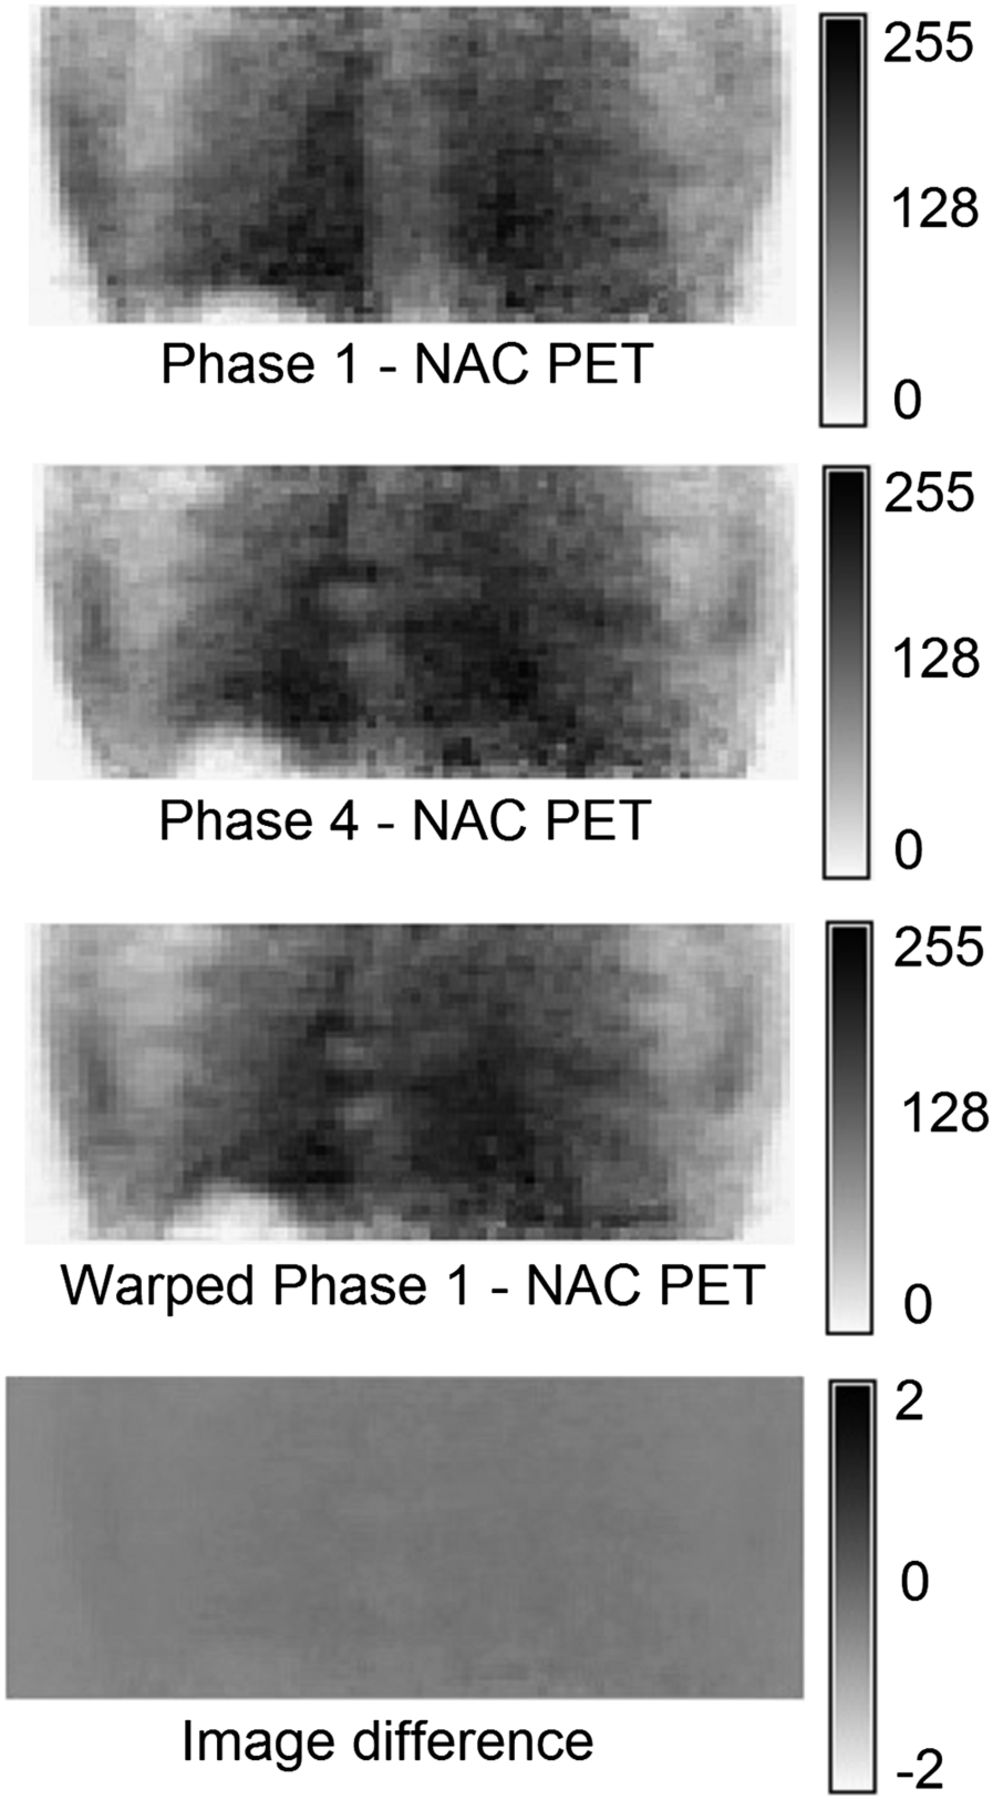
Elastic registration of first and fourth PET frames (patient 1), corresponding warped PET image 1 (frames 1–4), and image difference between original frame 4 and warped frame 1.
Simulated Datasets
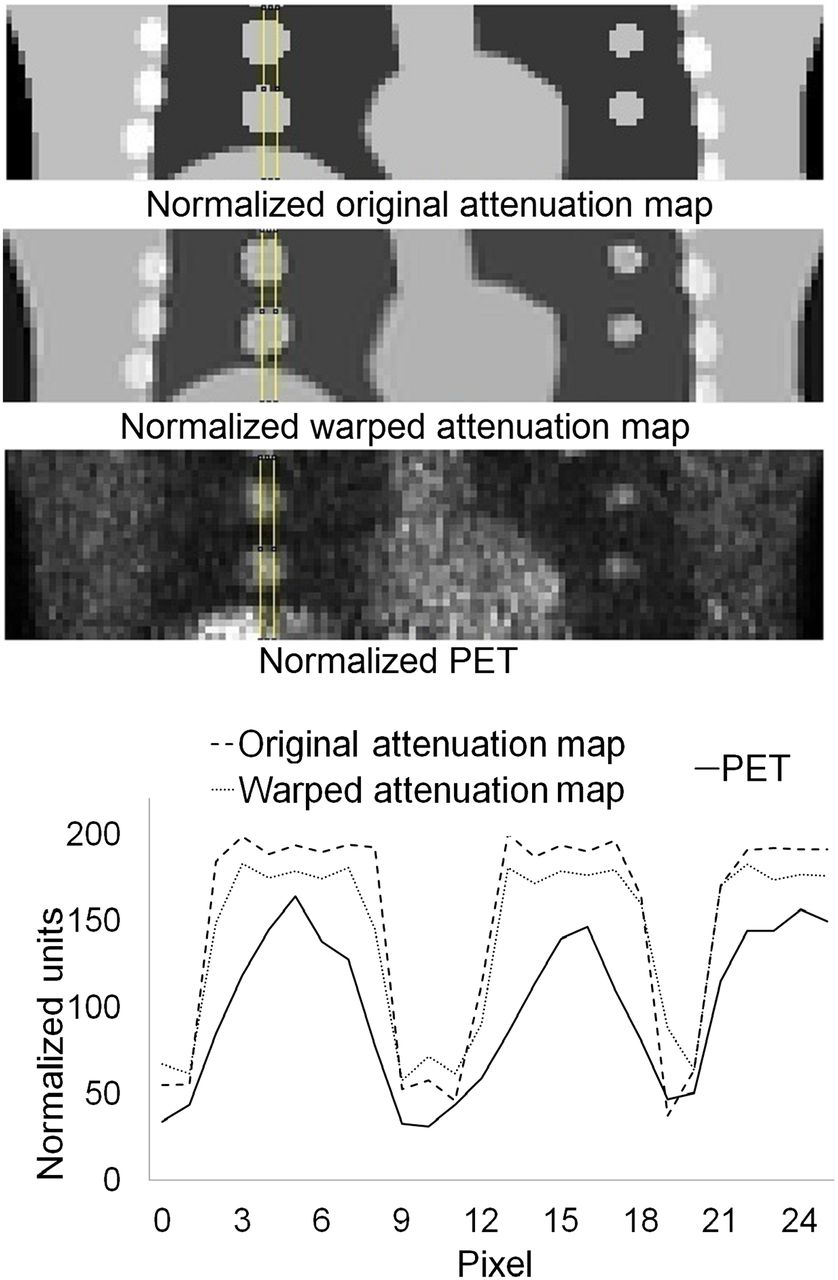
Figure 2 shows an example of an NCAT attenuation map (frame 5 where the motion amplitude is larger), warped attenuation map, and corresponding PET frame used in the warped attenuation map generation. These 3 images were consequently compared by drawing the profile along the simulated lung lesions and the diaphragm. Results indicate a good match between the original and warped attenuation maps, with some voxel intensity loss within the homogeneous regions and the edges due to a global scaling factor introduced during the registration process and the smoothing characteristics introduced by the B-spline registration process. The original attenuation maps and the corresponding PET frame were also compared using the same profile comparison after all these images were normalized (to intensities between 0 and 255). This normalization was necessary to compare multimodal images. Results indicate a good match between the original attenuation map and the corresponding PET frame, which is an important result given that this match is a prerequisite as indicated above. Moreover, a correlation ratio of 0.97 ± 0.02 between the original attenuation map and the corresponding PET frame strengthens the previous results. Finally, the correlation coefficient between the original and corresponding warped NCAT attenuation maps for all 8 frames demonstrated a high correlation of 0.988 ± 0.003. This correlation is to be compared with a low mean correlation (0.259 ± 0.122) between the different synchronized NCAT attenuation maps indicating large motion effects.

Slice of normalized original NCAT frame (frame 5), corresponding normalized warped attenuation map, and PET frame used to generate warped attenuation map. Profile comparison through simulated lung lesions and diaphragm is shown.
Clinical Datasets
The proposed methodology was also tested on 4 patient datasets. The correlation ratio between the single acquired CT and the PET reference images (0.96 ± 0.02 for all patients) indicates a higher correlation than that of the single CT image with any of the synchronized 4D PET frames (0.78 ± 0.08 for all phases and patients). This higher correlation was expected because the PET reference frame was reconstructed using list-mode data from the same temporal interval corresponding to the acquired CT image.
Figure 3 shows an example of a warped CT image (frame 4 of patient 1), derived using different statistics in the NAC PET images, in comparison to the corresponding slice from the original CT series for a patient with a good match between the original 4D PET and CT series. The profile results across the diaphragm of the same slice of the warped CT match closely that of the original CT image. Finally, no significant differences were seen in the warped CT series as a result of using lower statistical quality PET images for their generation. These results suggest that a standard PET acquisition (25% of statistics equivalent to 3 min per axial FOV) contains sufficient statistics for the accurate derivation of 4D CT series from the 4D NAC PET images.

Original CT frame 4 (patient 1) with corresponding warped CT, generated considering variable statistical quality NAC PET images. Corresponding profiles over diaphragm are shown.
The mean correlation between the single CT image, used to derive the reference PET frame, and the other original 4D CT frames was low for all patients (0.136 ± 0.152), demonstrating the presence of substantial motion during the 4D CT acquisition. On the other hand, Table 1 shows a high correlation between warped and original CT images for the first 3 patients. However, a lower correlation was seen for patient 4, probably because of a worse match between the original 4D CT images and the corresponding 4D PET frames. This could be caused by different respiratory conditions during the 4D PET and CT acquisitions, leading subsequently to worse matching between the original and warped 4D CT series.
Correlation Coefficients Between Original and Corresponding Warped CT Frames Using Different PET Image Statistics
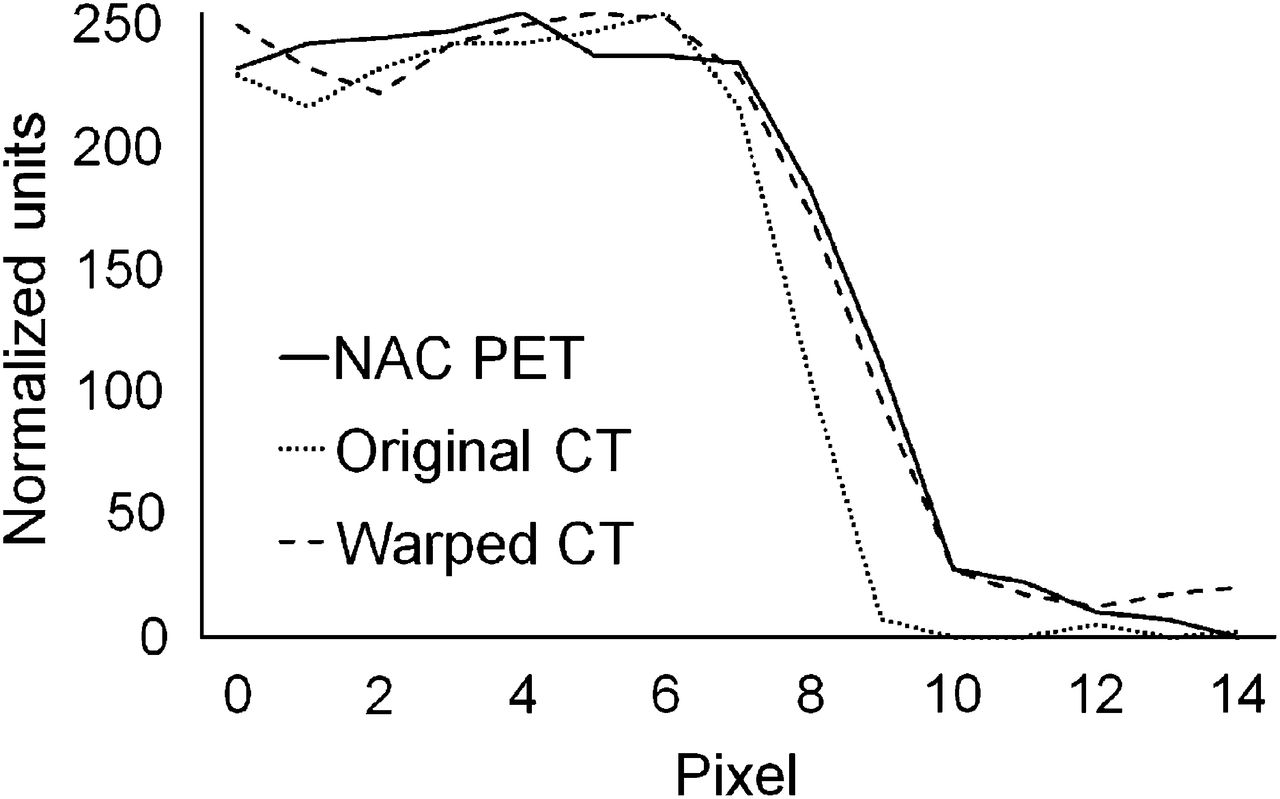
To prove that this difference is due to such respiratory condition differences we compared the original CT (frame 4 of patient 4) with the corresponding warped CT and the NAC PET frame. The profiles over the diaphragm in Figure 4 show that the warped CT image corresponds more closely to the NAC PET image than to the acquired CT frame. Therefore, warped CT images generated using the proposed method correlate better with the 4D PET series than with the original 4D CT images.

Profile across the diaphragm of frame 4 (patient 4) showing difference among NAC PET, original CT image, and warped CT image.
These qualitative impressions were also quantitatively confirmed using the correlation ratio on a frame-by-frame basis (Table 2). As can be seen from these ratios, the warped CT frames closely match the 4D PET images, compared with the original 4D CT frames. On the other hand, as shown in the results of the first column in Table 2, a high correlation was obtained between the single acquired CT frame and the derived reference PET image, which is an essential first step in allowing an accurate matching between the warped CT and the corresponding PET frames. These results have been obtained using the NAC PET images reconstructed with only 25% of the available statistics, showing no need for longer PET acquisitions with the proposed approach and confirming that the high correlation between warped and original CT images is independent of the NAC PET image statistical quality (Table 1).
Correlation Ratios Between Different PET and CT Frames for Patient 4
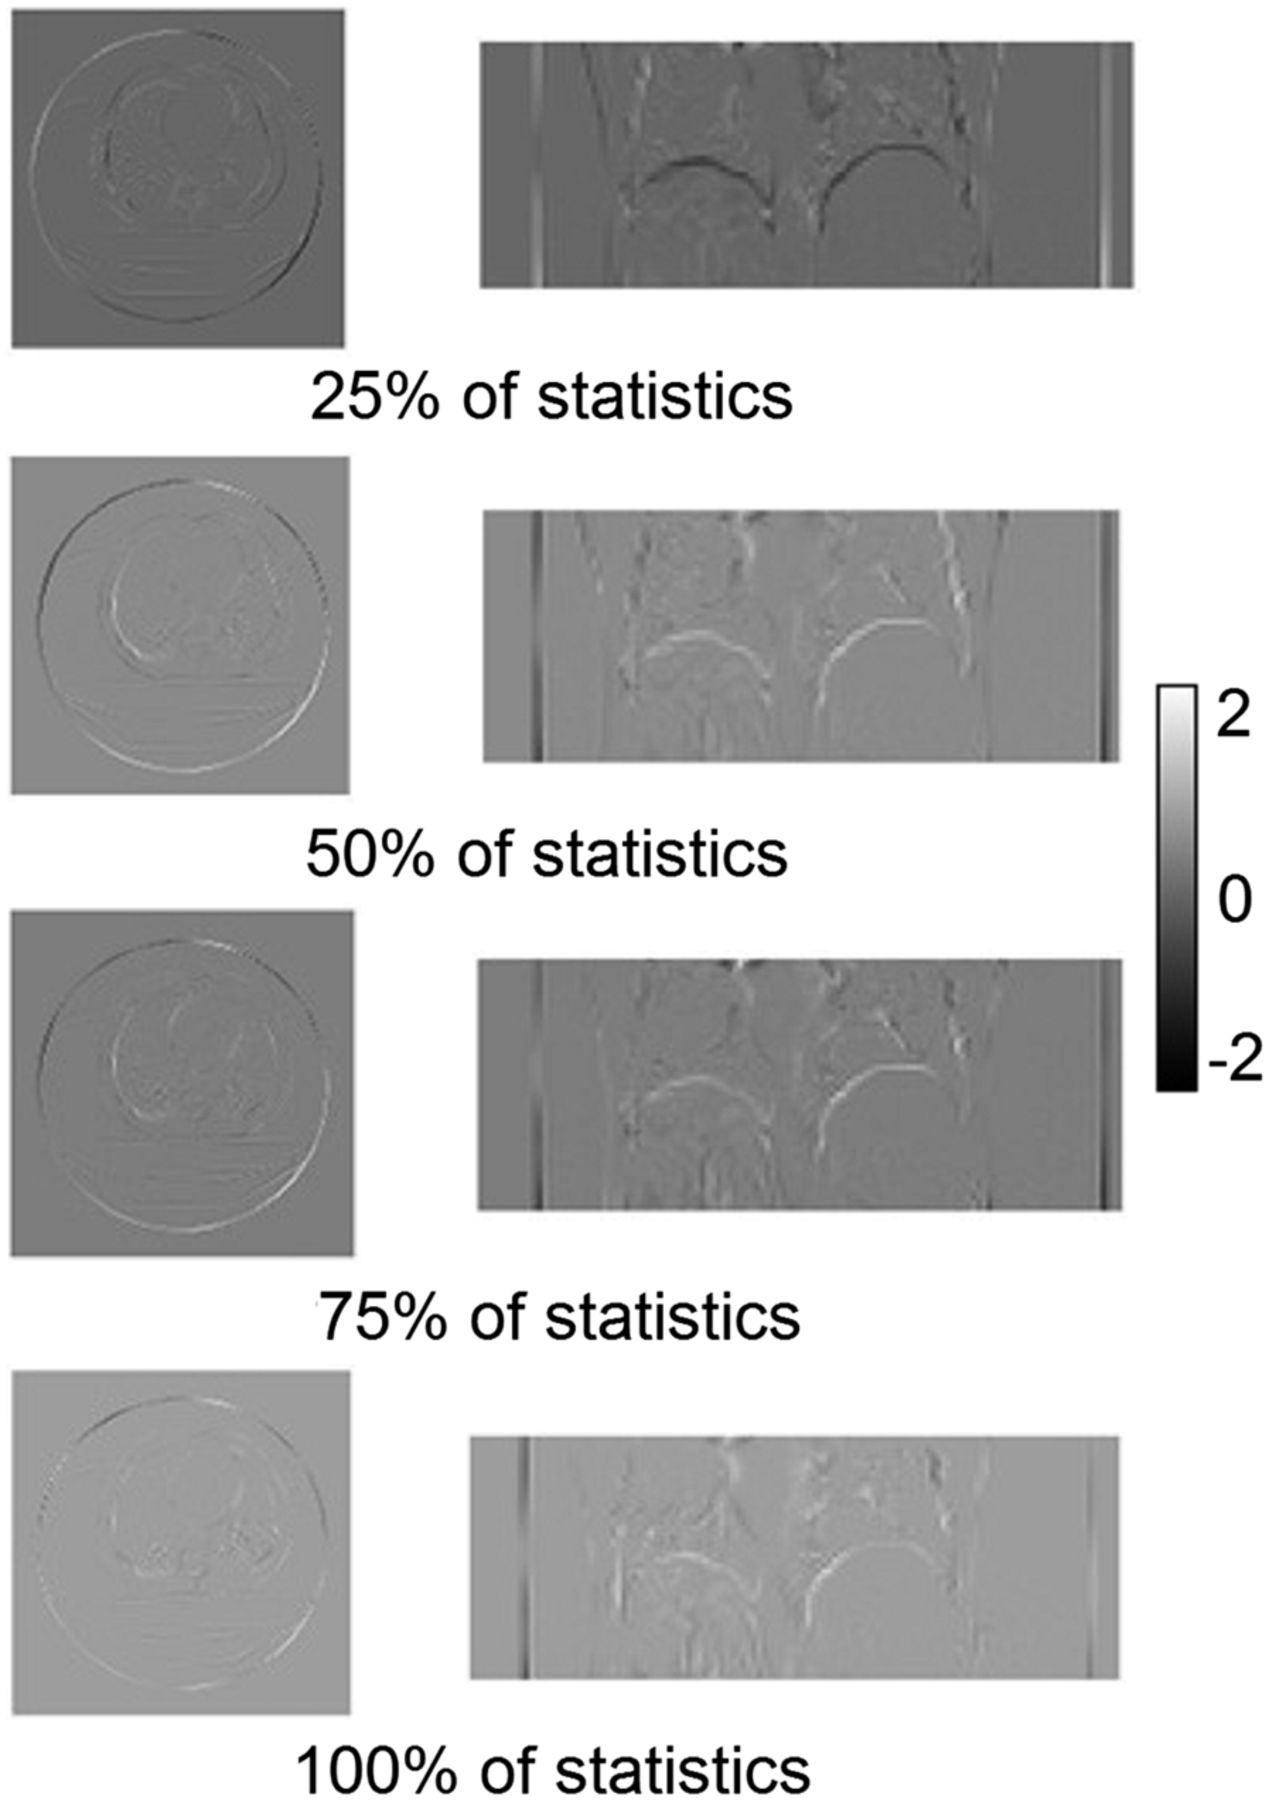
To further strengthen this conclusion, Figure 5 shows the difference images between the original (frame 4) and warped CT derived using NAC PET images of different statistical quality for patient 1. These images demonstrate small differences (−0.96 to +0.45 with 100% statistics to between −1.72 and +1.77 for 25% statistics, representing differences of <1% given that images were normalized between 0 and 255). Finally, Figure 6 shows the mean ED results and the corresponding SD between original and corresponding warped CT images (for all respiratory phases of every patient). A mean ED of less than 3 and 6 mm was measured for the first 3 patients and the fourth patient, respectively.

Difference images between original and warped CT frame 4 (patient 2) generated using NAC PET images of variable statistical quality.

Comparison of ED (in mm) and corresponding SD for all anatomic landmarks considered in all 4 patient datasets.
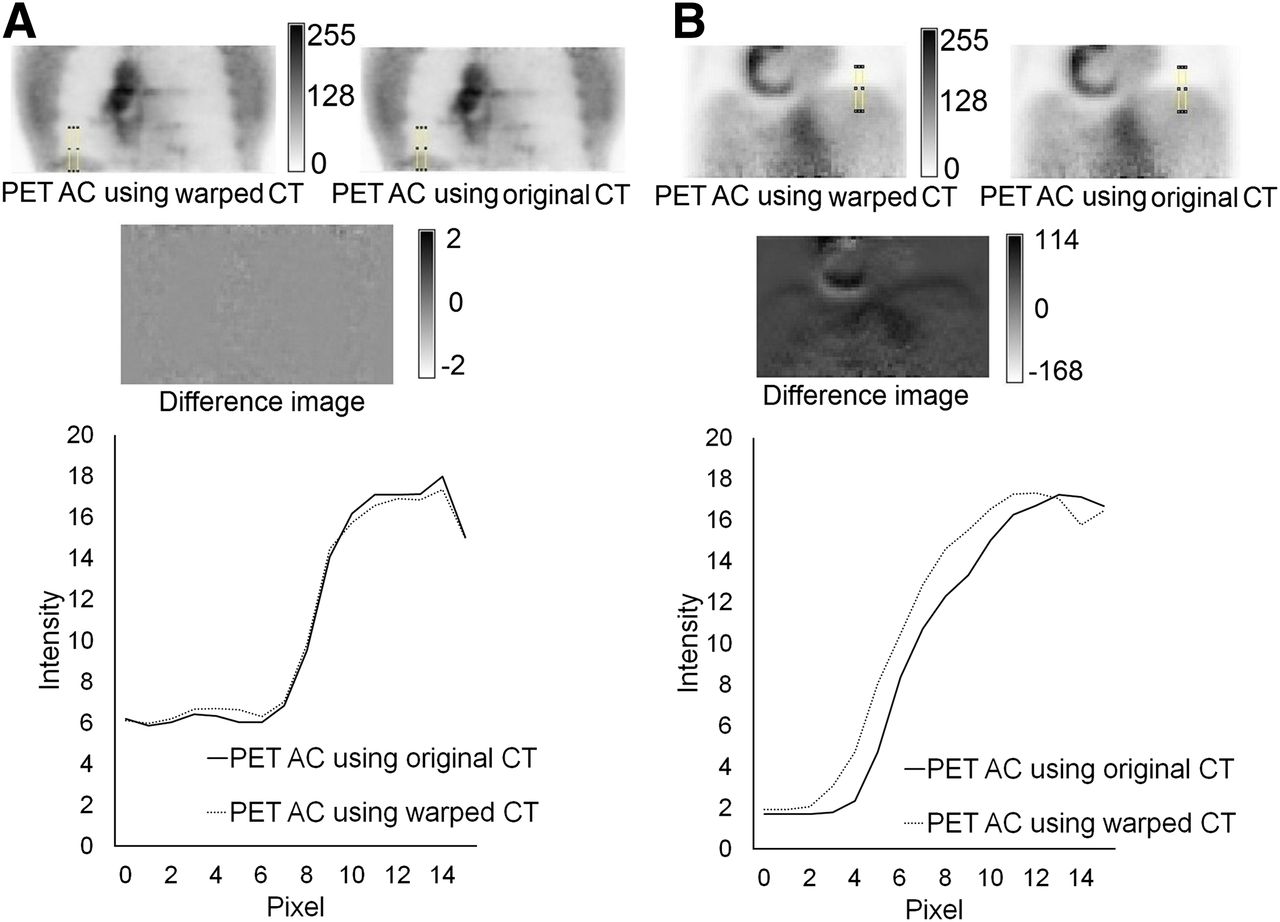
Finally, the original and warped CT series were used to create attenuation-correction maps for the corresponding 4D PET frames. The 2 obtained attenuation-corrected PET series were compared. Figure 7 shows an example of a single synchronized attenuation-corrected PET frame (frame 4 of patients 1 [Fig. 7A] and 4 [Fig. 7B]). PET images corrected for attenuation using the corresponding warped and original CT images as well as difference images and corresponding diaphragm profiles are shown for both patients. In the case of patient 1, small differences are seen irrespective of the use of the original or warped 4D CT images in the PET attenuation-correction process. On the other hand, larger differences are evident for patient 4 as a result of the worse mismatch between original 4D PET and corresponding 4D CT images. These differences were larger in regions such as the diaphragm and the heart where respiratory motion effects are expected to be more significant. These results were similar for different statistics used in the reconstruction of the NAC PET images (Table 3). The region-of-interest analysis in the attenuation-corrected PET images, using the original and warped CT attenuation maps for all patients, led to a mean difference of 2.88%, with corresponding intensities of 16.67 ± 2.28 and 16.19 ± 1.99, respectively.

Attenuation-corrected PET frame 4, for patients 1 (A) and 4 (B), using warped and original corresponding CT frame, including diaphragm profile differences and difference image. AC = attenuation correction.
Correlation Coefficients Between Attenuation-Corrected (Using Original and Warped CT) PET Images
DISCUSSION
The goal of this study was to investigate the potential of producing a 4D CT series from the corresponding NAC 4D PET images and a single CT acquisition in a particular position of the respiratory cycle, leading to 2 specific advantages over the use of 4D CT. First, the warped CT frames have the same respiratory motion–related characteristics as the 4D PET images, ensuring a good match between the obtained 4D CT and 4D PET frames. Hence, the assumption that the patient respiratory signal is the same during 4D CT and 4D PET acquisitions is no longer necessary. This PET and CT reference frame matching is ensured using a list-mode PET data format containing temporal information, allowing the reconstruction of a PET frame that corresponds to the same temporal instance as the single acquired CT. Second, the proposed approach eliminates the need to acquire a full 4D CT series, replacing it by 1 reference CT image, leading to a significant dose burden decrease for the patients. It also allows the attenuation correction of each frame of a 4D PET acquisition using matched CT frames.
The NCAT phantom, describing a realistic motion model including nonrigid motion effects, was used for the validation step. Lung lesions of variable size and location were introduced. The 4D NCAT phantom images were subsequently combined with the model of a clinical PET/CT system developed using GATE to create dynamic emission images throughout a respiratory cycle. An elastic registration algorithm based on B-splines was used to register these emission images and to generate all necessary displacement matrices. The obtained transformation matrices from the 4D NAC NCAT emission image registration were used to warp the reference original attenuation NCAT image, creating all NCAT attenuation maps corresponding to the 4D emission series. The warped NCAT attenuation maps were compared with original attenuation maps using global comparison metrics, such as the correlation coefficient, and local comparisons, such as profiles drawn on the diaphragm or the lesions. Results showed a good match between original and warped NCAT attenuation maps.
Four patient datasets were also included in the validation. For 3 of 4 patients, warped CT frames were closely correlated with the original CT frames. For the fourth patient, given that the original 4D CT and their corresponding 4D PET did not highly correlate, we found that the original and warped 4D CT images were not well correlated. However, the warped 4D CT correlated better with the 4D PET than with the original 4D CT images, clearly demonstrating one of the advantages of the proposed approach. The method allows numerous relevant issues, previously highlighted in the literature (9,13–15), to be addressed.
These results indicate the ability of the proposed methodology to derive 4D CT frames from 4D NAC PET image registration and 1 reference CT frame. In addition, the warped CT frames can be used to create attenuation maps to improve CT-based attenuation correction in PET imaging. For all 4 patients, the obtained attenuation-corrected PET images using the warped CT attenuation maps correlated well with attenuation-corrected PET images using the original acquired CT for the attenuation map creation. Finally, the proposed approach could be of interest with other multimodality imaging systems such as PET/MR, reducing the need for PET attenuation correction in 4D MR image acquisitions.
A possible limitation of this study is the relatively small numbers of patients. Additional patients may further enhance the impact of the proposed methodology, especially where the 4D PET and CT correspondence is questionable. However, the use of simulated and patient (n = 4) datasets should be sufficient for such a methodology feasibility study.
CONCLUSION
The present study demonstrates the potential of using the acquired 4D NAC PET images for the derivation of a matching CT series from a single CT image corresponding to a specific part of the respiratory cycle. The performance of the proposed methodology was evaluated on simulated and clinical datasets. Furthermore, clinically relevant PET acquisition times can be used for the implementation of such an approach, making this an even more attractive solution considering the absence of an extra dose given by a standard 4D CT acquisition. A comparison of the warped 4D CT series and the original 4D CT series on the one hand and of the 4D PET attenuation-corrected images using a warped 4D CT series and the original 4D CT series on the other hand demonstrated the efficiency of the proposed approach.
DISCLOSURE
The costs of publication of this article were defrayed in part by the payment of page charges. Therefore, and solely to indicate this fact, this article is hereby marked “advertisement” in accordance with 18 USC section 1734. No potential conflict of interest relevant to this article was reported.
Footnotes
Published online Mar. 7, 2013.
- © 2013 by the Society of Nuclear Medicine and Molecular Imaging, Inc.
REFERENCES
- Received for publication July 9, 2012.
- Accepted for publication November 6, 2012.


Jump to section
Related Articles
Cited By...
- Respiratory Motion Compensation for PET/CT with Motion Information Derived from Matched Attenuation-Corrected Gated PET Data
- 4-Dimensional MRI and Attenuation Map Generation in PET/MRI with 4-Dimensional PET-Derived Deformation Matrices: Study of Feasibility for Lung Cancer Applications
- Imaging Atherosclerosis
- Reconstruction-Incorporated Respiratory Motion Correction in Clinical Simultaneous PET/MR Imaging for Oncology Applications