


Abstract
Recent advances in the technology of helical multidetector CT allow precise evaluations of nodule hemodynamics. In addition, the efficacy of tissue characterization has improved, and now sensitivity and specificity of >90% are achieved. Moreover, the efficacy of PET for the tissue characterization of solitary pulmonary nodules (SPNs) has also become of importance. The purpose of this study was to compare the diagnostic accuracy of helical dynamic (HD) CT (HDCT) and integrated PET/CT for pulmonary nodule characterization. Methods: One hundred nineteen patients with an SPN underwent both HDCT (unenhanced scans, followed by series of images at 30, 60, 90, 120 s and at 5 and 15 min after intravenous injection of contrast medium) and integrated PET/CT. On HDCT, a nodule was regarded as malignant with a net enhancement of ≥25 Hounsfield units (HU) and a washout of 5–31 HU. On integrated PET/CT, nodules were considered malignant with a ≥3.5 maximum standardized uptake value and an 18F-FDG uptake greater than that of mediastinal structures. The sensitivity, specificity, and accuracy of the 2 modalities for malignancy were compared using the McNemar test. Results: There were 79 malignant and 40 benign nodules. The sensitivity, specificity, and accuracy for malignancy on HDCT were 81% (64/79 nodules), 93% (37/40), and 85% (101/119), respectively, whereas those on integrated PET/CT were 96% (76/79), 88% (35/40), and 93% (111/119), respectively (P = 0.008, 0.727, and 0.011, respectively). All malignant nodules were interpreted correctly on either HDCT or PET/CT. Conclusion: Integrated PET/CT is more sensitive and accurate than HDCT for the malignant nodule characterization; therefore, PET/CT may be performed as the first-line evaluation tool for SPN characterization. Because HDCT has high specificity and acceptable sensitivity and accuracy, it may be a reasonable alternative for nodule characterization when PET/CT is unavailable.
The characterization of solitary pulmonary nodules (SPNs) is a major concern not only for radiologists but also for clinicians, because SPNs have a 30%−40% chance of being malignant (1–6). Morphologic evaluation would help differentiate benign and malignant nodules when they have typical benign or malignant features, but there is considerable overlap between benign and malignant nodules in terms of morphologic presentation in many cases (7). Though various strategies other than morphologic evaluation have been applied to the differentiation of malignant and benign nodules, the most promising, up-to-date, and noninvasive way of approaching the characterization of pulmonary nodules involves the evaluation of their hemodynamic characteristics by helical dynamic (HD) CT (HDCT) (8–10) or the assessment of their metabolic characteristics by 18F-FDG PET (11).
Recent advances in the technology of helical multidetector CT allow precise evaluations of nodules hemodynamics. In addition, the efficacy of tissue characterization has improved, and now sensitivity and specificity of >90% are achieved on the basis of evaluations of washout patterns in the delayed dynamic phase (12). Moreover, the efficacy of PET for the tissue characterization of SPNs has also become of importance. This is not only because FDG PET is sensitive for the diagnosis of SPN malignancy with relative high specificity (11,13) but also because FDG PET has been shown to be a cost-effective component of diagnostic strategies (14).
The purpose of our study was to compare the diagnostic accuracies of HDCT and integrated PET/CT for pulmonary nodule characterization, with a focus on comparing the efficacies of HDCT and PET/CT in the diagnosis of malignant SPNs.
MATERIALS AND METHODS
Patient Enrollment
From August 2003 to July 2004, 330 patients (177, 153 women; age range, 22–85 y; mean age, 56 y) with an SPN (≤3 cm in the longest diameter, approximately spheric; short- and long-axis diameters were within a factor of 1.5 of each other) on chest radiography underwent thoracic HDCT. Of the 330 patients, we selected 137 nonrandom patients who underwent both HDCT and integrated PET/CT during this period. At our institution, integrated PET/CT was usually recommended for cancer staging before surgery in patients who had a proven lung cancer or for tissue characterization in patients who had clinically indeterminate SPNs. Of 193 other patients in whom only HDCT was performed, 41 proved to have malignant nodules and 86 had benign nodules. In 66 patients, neither histopathologic examination nor follow-up study was obtained because of follow-up loss.
Of these 137 selected patients, 18 were excluded because follow-up imaging study and cytologic or histologic diagnosis were unavailable. Therefore, we included 119 patients—that is, 62 men and 57 women ranging in age from 31 to 81 y (mean age, 55 y). Of the 119 patients, 86 belonged to the patient population of one (12) of our 2 recent reports, and 60 belonged to that of the other study (15). These patients underwent transthoracic needle biopsy (n = 24) or surgery (n = 75) including lobectomy (n = 65) or wedge resection (n = 10). Twenty patients, in whom CT and clinical findings suggested a benign nodule but in whom histopathologic diagnosis was not obtained, were regarded as having a benign nodule, because nodules showed no change (n = 17) or a reduction (n = 3) in size on follow-up CT studies performed at least once over a period of >12 mo.
HDCT Imaging Acquisition
HDCT was performed using a 4-row (LightSpeed QX/i scanner; GE Healthcare) or 16-row (LightSpeed Ultra or Ultra16 scanner; GE Healthcare) multidetector CT (MDCT). Our institutional review board approved the study protocol for this CT study, and written informed consent was obtained from all patients.
Before intravenously injecting contrast medium, a series of 13 images were obtained through a nodule covering 30 mm along the z-axis with 2.5-mm collimation at 120 kVp, 90 mA, 0.8-s gantry rotation time, and a table speed of 3.75 mm/s, over 8 s. Thereafter, an additional 6 series of images were obtained at 30, 60, 90, and 120 s and at 5 and 15 min after intravenous injection of contrast medium (3 mL/s, total of 120 mL of Iomeron 300, Iomeprol; Bracco) using a power injector (MCT Plus; Medrad) and using the same parameters as used for the initial preenhancement series (total series of 7 images at T0 s, T30 s, T60 s, T90 s, and T120 s and at T5 min and T15 min). Image data were reconstructed with a thickness of 2.5 mm (13 images in each cluster; the total number of dynamic images = 13 × 7 = 91 images) using a standard algorithm. Immediately after the dynamic study at 120 s, helical CT (125 mA, 120 kVp, 5-mm collimation, table speed of 15 mm/s) scans were obtained from lung apices to the level of the middle portion of both kidneys for tumor staging. All thin-section and dynamic CT image data were directly interfaced to our picture archiving and communication system (PACS) system (Pathspeed; GE Healthcare), which displayed all image data on monitors (4 monitors, 1,536 × 2,048 image matrices, 8-bit viewable gray scale, and 60-foot-lambert luminescence). On the monitors, both mediastinal (window width, 400 HU; window level, 20 HU) and lung (window width, 1,500 HU; window level, −700 HU) window images were viewed.
Integrated PET/CT Acquisition
All 119 patients underwent an integrated PET/CT study within 7 d of HDCT (mean, 3.5 d; median, 3 d). All patients fasted for at least 6 h before integrated PET/CT examination, although oral hydration with glucose-free water was allowed. After ensuring a normal blood glucose level in peripheral blood, patients received an intravenous injection of 370 MBq (10 mCi) of 18F-FDG and then rested for approximately 45 min before undergoing imaging. Image acquisition was performed using an integrated PET/CT device (Discovery LS; GE Healthcare) consisting of an Advance NXi PET scanner and an 8-slice Light Speed Plus CT scanner. The axes of both systems were mechanically aligned so that shifting the examination table by 68 cm moved the patient from the CT gantry into the PET gantry. The resulting PET and CT images were coregistered on hardware.
CT was performed from the head to the pelvic floor using a standardized protocol involving 140 kV, 80 mA, a tube-rotation time of 0.5 s per rotation, a pitch of 6, and a section thickness of 5 mm, which matched the PET image section thickness. Patients were in normal shallow respiration during the acquisition of CT scans. No contrast material was administered. Immediately after CT, PET was performed in the identical axial field of view. The acquisition time for PET was 5 min per table position. CT data was resized from a 512 × 512 matrix to a 128 × 128 matrix to match the PET data so that the images could be fused and CT transmission maps generated. PET image datasets were reconstructed iteratively using the ordered-subsets expectation maximization algorithm and measured attenuation correction (2 iterations, 28 subsets) using the CT data. Coregistered images were displayed using eNTEGRA software (GE Healthcare).
HDCT Image Evaluation
All nodule evaluations were performed using the software package provided by our PACS (Pathspeed; GE Healthcare). Nodule sizes were recorded by observing unenhanced thin-section CT scans. After viewing all 91 images of a nodule as thumbnail images on PACS monitors, we selected 1 image for analysis from 13 images of a nodule at a given time. The selected image was the transverse section with the largest diameter (scanned at the equator of the nodule). We measured nodule attenuation values in the same area on the selected image for each cluster on each time (from unenhanced image to image acquired at 15 min). A circular region of interest (ROI) was placed over a nodule, and we examined an ROI that covered about one half of the diameter of the nodule at the equator. When we confronted calcified (n = 3), cavitary (n = 5), or necrotic (n = 10) areas, they were avoided so that the ROI was made as large as possible in the areas removed from the areas. All Hounsfield unit (HU) measurements were performed on mediastinal window images to ensure that partial-volume averaging was minimized. Two radiologists with 4 and 14 y of chest CT experience independently measured the attenuation values. All measurements were made at the time of the CT examination. Radiologists were unaware of patient features such as patient's age and clinical history. Two measurements were obtained for each nodule at each imaging phase by each observer. Each observer recorded the mean attenuation values and then analyzed and calculated the following dynamic characteristics of tumor enhancement using contrast medium washin and washout values: peak enhancement (PE), net enhancement (NE, washin of contrast medium), and absolute loss of enhancement (washout). PE attenuation was defined as the maximum attenuation value of a nodule over the entire time course of the dynamic study. NE attenuation was calculated by subtracting preenhancement attenuation from peak enhancement attenuation. Absolute loss of enhancement at delayed imaging time was calculated by subtracting the attenuation value at 15 min from peak enhancement attenuation.
By observing PE, NE, and washout attenuation values of a nodule on serial images on HDCT, nodule enhancement patterns were determined by the same 2 radiologists who took part in nodule attenuation value measurements. Decisions were reached by a consensus. Pulmonary nodules were differentiated using washin/washout cutoff values as determined during our previous HDCT study (12), in which a nodule was regarded as malignant if it had a washin (NE) of ≥25 HU and a washout of 5–31 HU.
Integrated PET/CT Image Analysis
Integrated PET/CT datasets were evaluated by 1 of 2 nuclear medicine physicians (with 11 and 5 y of experience and 2 y of experience of integrated PET/CT analysis each) who were unaware of all CT (previous HDCT findings obtained before the integrated PET/CT study), clinical, and pathologic results. Pulmonary nodules of increased glucose uptake with a distinct margin were considered positive. The nodules were regarded to have increased uptake when they demonstrated 18F-FDG uptake at a level greater than that of the surrounding tissue as determined by qualitative analysis, and with a maximum standardized uptake value (SUV) (adjusted for patient's body weight) of >3.5 as determined by quantitative analysis. By ROC analysis using different SUV threshold cutoffs, we decided that an SUV of 3.5 was optimum for differentiating between benign and malignant tissue on our machines (15,16).
Data and Statistical Analysis
Statistical analyses were performed using commercially available software (SAS 8.2; SAS Institute). Agreement between the 2 observers in terms of nodule-measured attenuation values was analyzed by calculating intraclass correlation coefficients.
The Student t and Mann–Whitney tests were used to analyze statistical differences in nodule sizes, SUVs obtained by integrated PET/CT, and attenuation values by unenhanced study, and PE and NE between malignant and benign nodules. P values < 0.05 were regarded as significant.
Diagnostic characteristics—that is, sensitivity, specificity, accuracy, and positive and negative predictive values—were calculated by considering both the washin (NE) and washout (absolute loss of enhancement) levels that signified a positive test (malignant with NE of ≥25 HU and washout of 5–31 HU) on HDCT and by considering SUVs on integrated PET/CT. The McNemar test was used to compare HDCT and integrated PET/CT with respect to sensitivity, specificity, and accuracy. P values < 0.05 were regarded as significant.
For the nodules, in which HDCT and integrated PET/CT disclosed wrong or dissociated results for tissue characterization compared with the histopathologic reports, we analyzed cell types of malignant nodules, tissue characteristics of benign nodules, and enhancement patterns of the nodules on HDCT. For the nodules < 10 mm in diameter, we evaluated how accurately integrated PET/CT and HDCT did characterize the nodules. The size of the smallest malignant nodule correctly characterized at either modality was recorded.
RESULTS
Good interobserver agreement was obtained between the 2 observers in terms of measured nodule attenuation values (intraclass correlation coefficient = 0.837–0.912, P < 0.0001) on HDCT.
Nodule Characteristics on Pathologic Examination, HDCT, and PET/CT
Of 119 nodules, 79 (66%) proved to be malignant and 40 (34%) benign (Table 1). The sizes of these 119 nodules were as follows: ≥6.2 mm but <10 mm in diameter in 8 patients, ≥10 mm but <15 mm in 14 patients, ≥15 mm but <20 mm in 28 patients, ≥20 mm but <25 mm in 25 patients, and ≥25 mm but <30 mm in 44 patients. Malignant nodules (23.3 ± 5.6 mm; range, 9.0–30.0) were larger than benign nodules (18.7 ± 7.4; range, 6.2–30.0) (P = 0.038, Student t test).
Frequency of Nodule Diagnosis (n = 119)
Characteristics on early-phase HDCT and integrated PET/CT are summarized in Table 2. On early-phase HDCT, the extents of PE and NE of malignant nodules were significantly greater than those of benign nodules. On integrated PET/CT, SUVs were significantly higher for malignant nodules (9.4 ± 4.9, maximum SUV of malignant nodule; 24.0) than benign nodules (2.9 ± 2.5, maximum SUV of benign nodule; 11.5) (P < 0.001, Mann–Whitney test). The mean maximum SUVs of individual histopathologic cell types in malignant nodules were as follows: adenocarcinoma (n = 54; 10.6 ± 3.9), squamous cell carcinoma (n = 9; 11.5 ± 3.1), metastatic carcinoma (n = 6; 5.4 ± 2.5), non–small cell lung cancer (n = 4; 9.2 ± 1.2), small cell carcinoma (n = 2; 7.3 ± 0.6), pleomorphic carcinoma (n = 2; 13.8 ± 7.3), and carcinoid tumor (n = 2; 5.2 ± 1.9).
Nodule Characteristics on HDCT and Integrated PET/CT
Patterns of nodule enhancement are summarized in Table 3. Most malignant nodules (75/79, 95%) showed NE ≥ 25 HU. However, 4 malignant nodules (4/79, 5%) showed NE < 25 HU. Sixty-four of the 79 (81%) malignant nodules showed washin ≥ 25 HU and 5–31 HU washout. A persistent enhancement pattern without any washout was noted in 7 of the 79 (9%). In 4 patients (5%), washout > 31 HU was noted (mean, 52 HU; range, 48–79).
Patterns of Nodule Enhancement in Early and Delayed Enhanced CT
Efficacy of HDCT and PET/CT for Tissue Characterization
Of 119 nodules, 93 showed concordant results for nodule characterization (Fig. 1) and 26 had discordant results between 2 studies (Figs. 2 and 3). When applying diagnostic criteria for malignancy fulfilling both ≥25 HU washin and 5–31 HU washout on HDCT, sensitivity, specificity, accuracy, positive predictive, and negative predictive values for malignant nodules were 81% (64/79 nodules), 93% (37/40), 85% (101/119), 96% (64/67), and 71% (37/52), respectively. Diagnostic characteristics on integrated PET/CT were as follows: sensitivity, 96% (76/79); specificity, 88% (35/40); accuracy, 93% (111/119); positive predictive value, 94% (76 of 81); and negative predictive value, 92% (35 of 38) (Table 4). The sensitivity of integrated PET/CT was significantly higher than that of HDCT (P = 0.008, McNemar test), but the specificity of HDCT tended to be higher than that of integrated PET/CT, but not statistically significant (P = 0.727, McNemar test). The accuracy of integrated PET/CT was significantly greater than that of HDCT (P = 0.011, McNemar test).
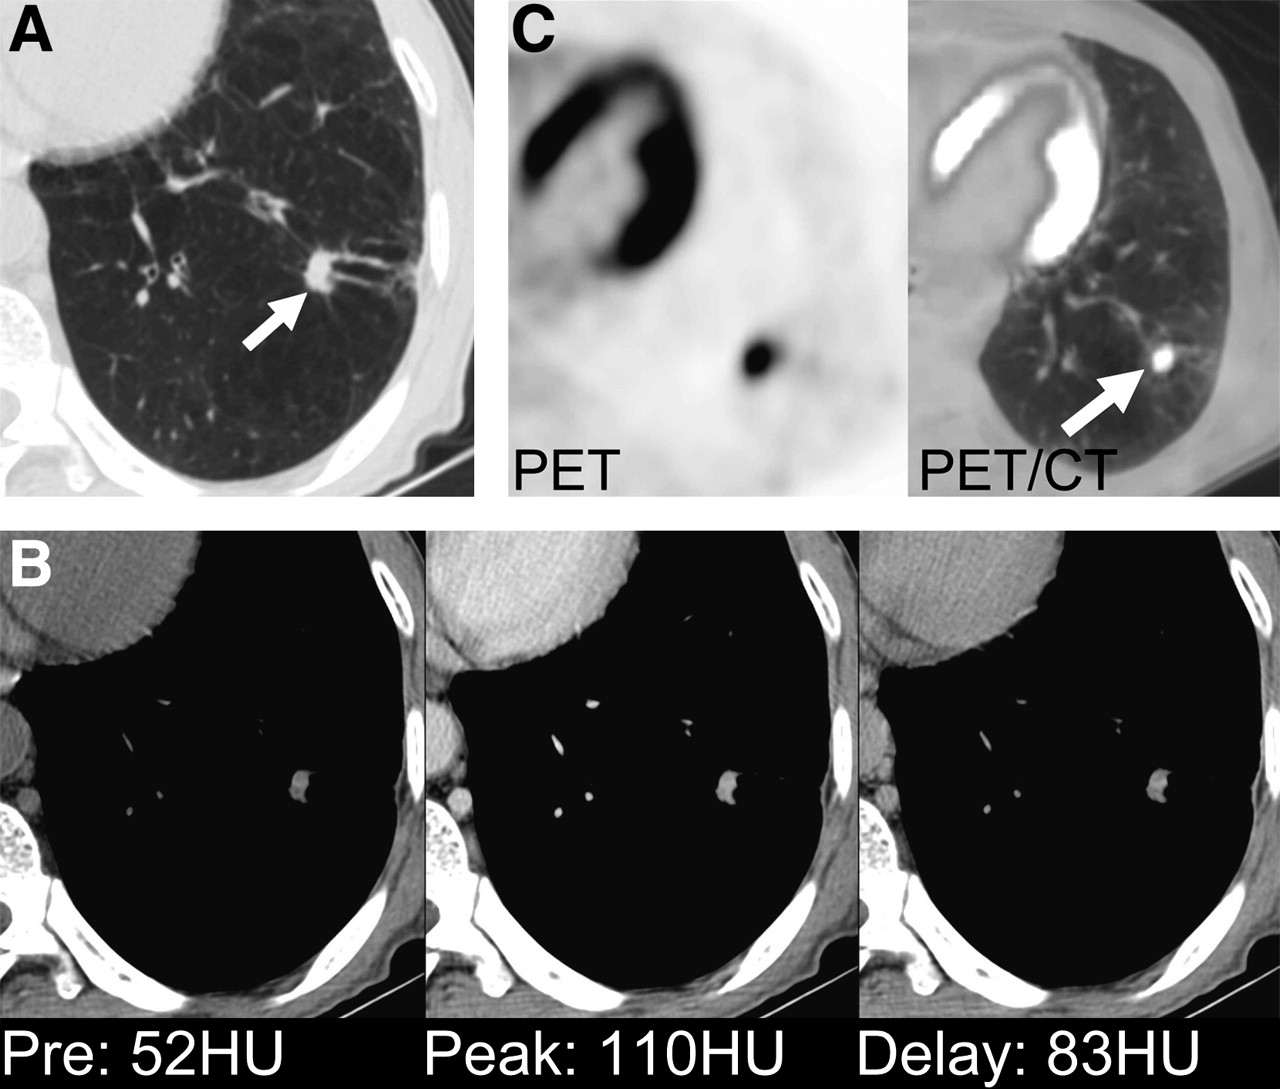
Adenocarcinoma shows NE of ≥25 HU and washout of 5–31 HU on HDCT and positive uptake on integrated PET/CT in 58-y-old man. (A) Lung window of transaxial thin-section (2.5-mm collimation) CT scan obtained through left lower lobe shows 9-mm nodule (arrow) in left lower lobe with lobulated and spiculated margin. (B) Attenuation measurements of HDCT through nodule indicate malignant characteristics, showing PE of 110 HU, NE of 58 HU, and absolute loss of enhancement (washout) of 27 HU. (C) PET image shows nodule of positive 18F-FDG uptake with maximum SUV of 8.1. PET image was integrated with CT image (arrow).
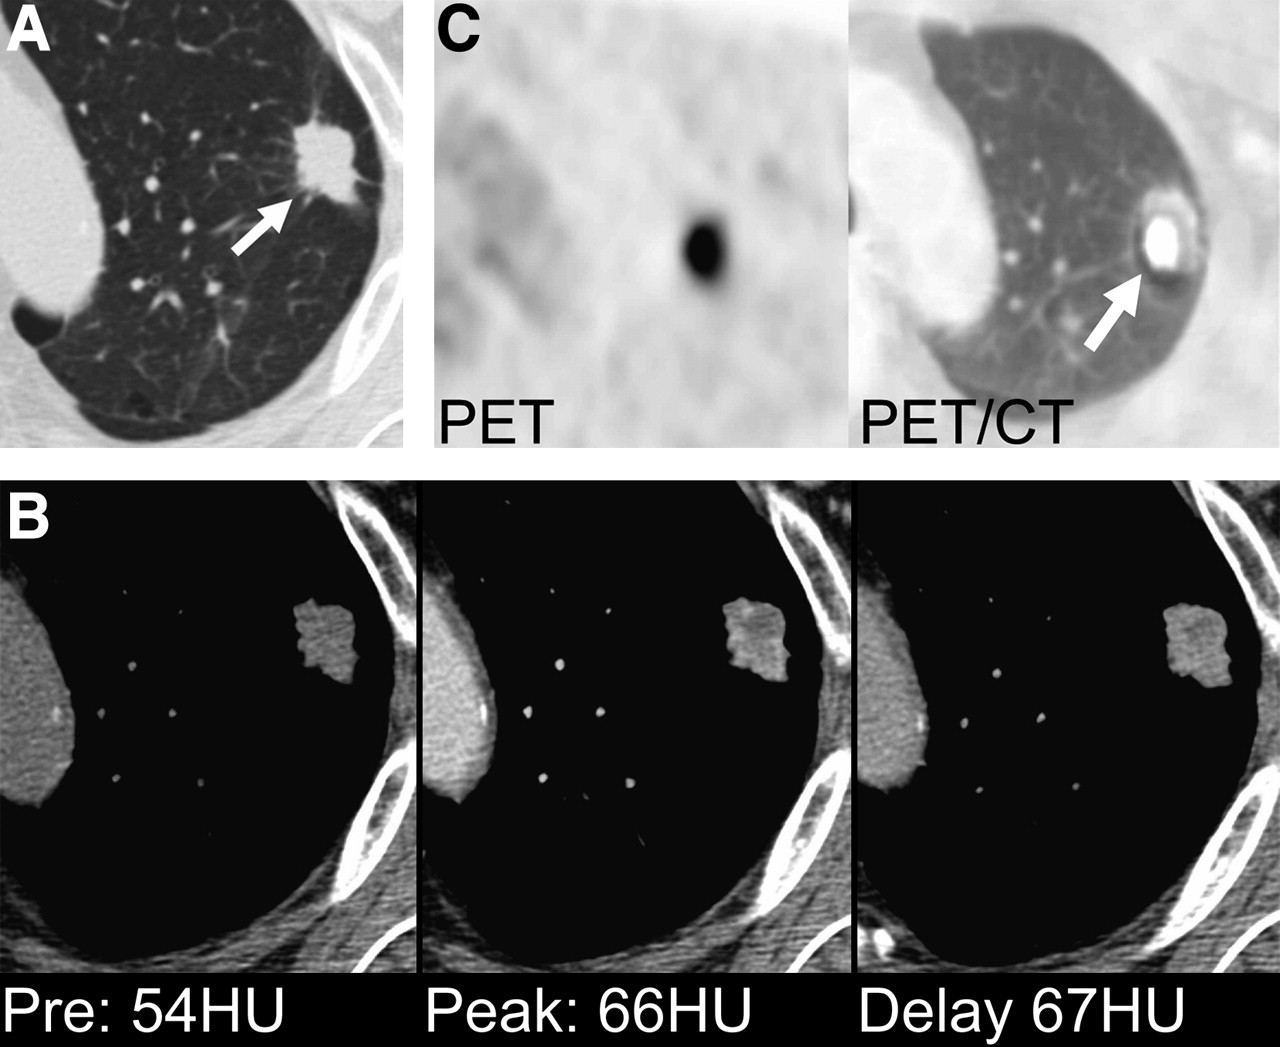
Adenocarcinoma shows NE of <25 HU on HDCT and positive uptake on integrated PET/CT in 60-y-old man. (A) Lung window of transaxial thin-section (2.5-mm collimation) CT scan obtained at level of aortic arch shows 22-mm nodule (arrow) in left upper lobe with lobulated and spiculated margin. (B) Attenuation measurements of HDCT through nodule indicate benign characteristics, showing PE of 66 HU, NE of 12 HU, and absolute loss of enhancement (washout) of 0 HU; (C) PET image shows nodule of positive 18F-FDG uptake with maximum SUV of 8.2. PET image was integrated with CT image (arrow).

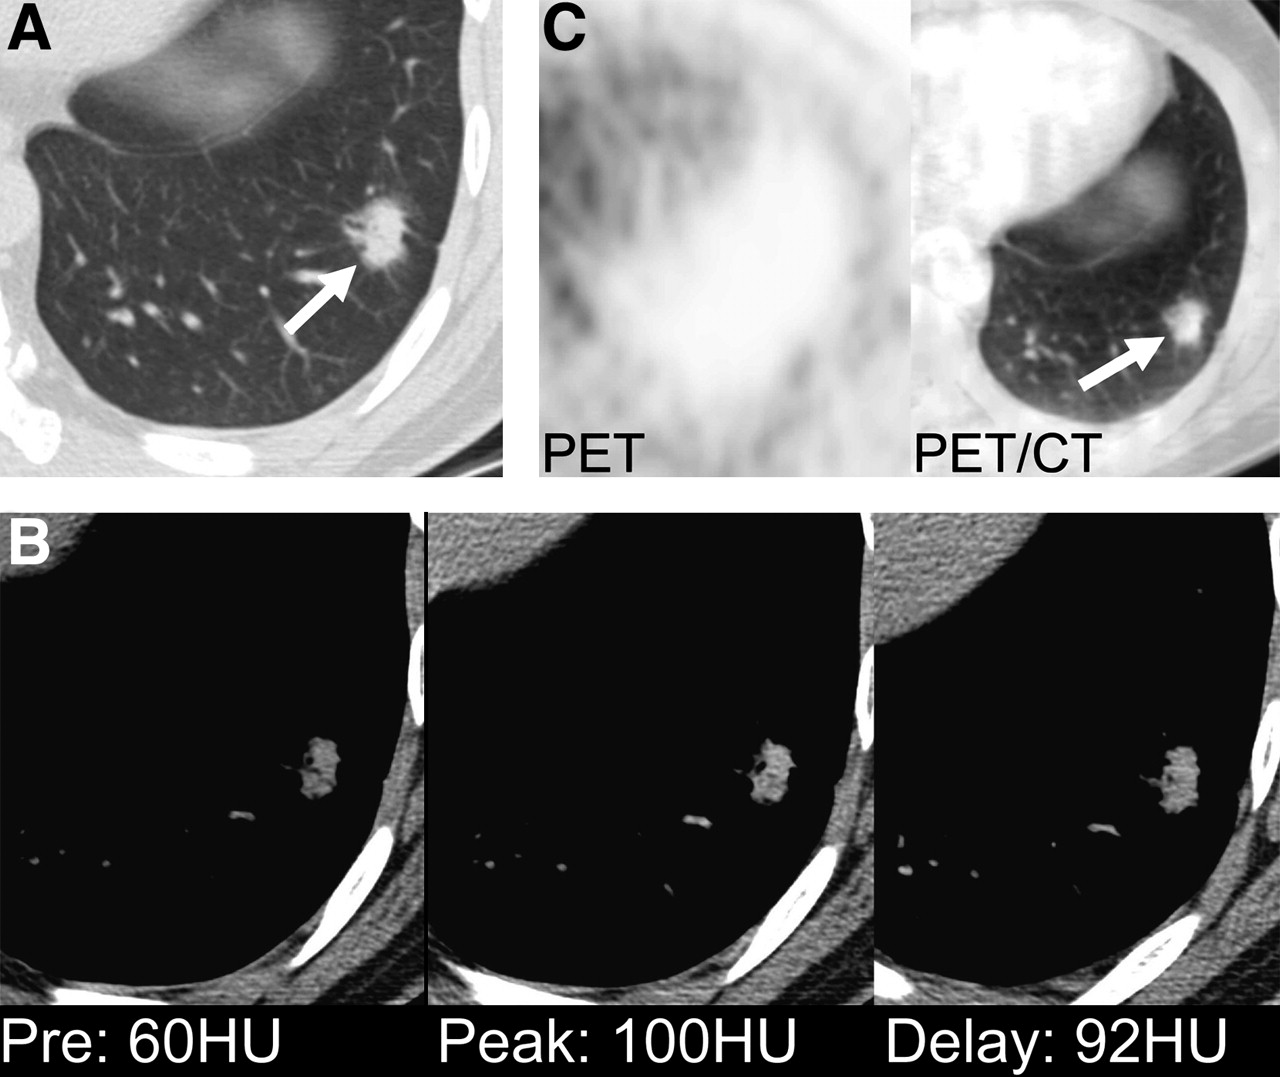
Adenocarcinoma with bronchioloalveolar carcinoma component shows NE of ≥25 HU and washout of 5–31 HU on HDCT and negative uptake on integrated PET/CT in 40-y-old man. (A) Lung window of transaxial thin-section (2.5-mm collimation) CT scan obtained through left lower lobe shows 17-mm nodule (arrow) in left lower lobe with spiculated margin and surrounding ground-glass opacities. (B) Attenuation measurements of HDCT through nodule indicate malignant characteristics, showing PE of 100 HU, NE of 60 HU, and absolute loss of enhancement (washout) of 8 HU. (C) PET image shows nodule of little 18F-FDG uptake with maximum SUV of 1.4. PET image was integrated with CT image (arrow).
Diagnostic Rates of HDCT and Integrated PET/CT
Results of Imaging Studies and Pathology
All nodules were interpreted correctly on either HDCT or PET/CT. False-negative results were obtained for 9 adenocarcinomas, 4 squamous cell carcinomas, and 2 metastatic carcinomas on HDCT (Fig. 2). These 15 falsely interpreted malignant nodules on HDCT were correctly diagnosed as malignant on PET/CT. Three benign nodules were falsely diagnosed as malignant nodules, showing ≥25 HU of net enhancement and 5–31 HU of washout. One of these nodules proved to be focal pneumonia by gun biopsy and 2 of these nodules showed an interval decrease in size at follow-up CT.
All 3 malignant nodules false-negatively interpreted on PET/CT (3 adenocarcinomas with bronchioloalveolar carcinoma component; one had bronchioloalveolar carcinoma component of >50% of tumor volume and the other 2 of <50% of tumor volume) were correctly diagnosed as malignant on HDCT (Fig. 3). There were 5 false-positive nodules on PET (2 tuberculomas, 2 benign nodules on follow-up study, and 1 focal pneumonia). All of these 26 dissociated HDCT and PET/CT results are summarized in Table 5.
Summery of Dissociated Results of HDCT and PET/CT
Of 8 nodules <10 mm in diameter (5 benign and 3 malignant nodules), 7 were correctly diagnosed on integrated PET/CT and 8 on HDCT. The smallest malignant nodule correctly diagnosed on both PET/CT and HDCT was 9.0 mm in diameter.
DISCUSSION
Though many efforts have been made to diagnose malignant SPNs, hemodynamic differences are noteworthy, as malignant nodules tend to enhance significantly more than benign nodules (8–10,17). The report by Swensen et al. (8) represents a milestone. In this study, a threshold value of 15 HU produced a sensitivity of 98%, a specificity of 58%, and an accuracy of 77% for malignant nodules. Cut-off values for the differentiation of benign and malignant nodules have increased, since higher dynamic study peak enhancements were obtained by HDCT than in previous studies using conventional or single helical CT (10). All of these previous dynamic CT studies (8–10,17), focused on the early phase of dynamic CT scans, showed low specificity ranging from 54% to 77% and produced false-positive results for active granulomas or benign vascular tumors in terms of the diagnosis of malignant nodules. By adding delayed phase to HDCT studies, specificity was raised to >90% due to the additional hemodynamic information and the extent of nodule washout (12). In our study, the sensitivity, specificity, and accuracy of HDCT for malignancy were 81% (64/79 nodules), 93% (37/49), and 85% (101/119), respectively. With our HDCT parameters, the measured total organ doses were 84–102 mGy at nodule location sites and 36–40 mGy elsewhere in the lungs. Although bandlike areas (3-cm length along z-axis) of nodule location get high radiation dose, it is more than twice larger than that (39–40 mGy) of standard helical CT with a multidetector CT at our institution (12).
On the other hand, PET is also considered an accurate, noninvasive diagnostic test, with a sensitivity of 92% and a specificity of 90% for malignant nodules (11). After the introduction of integrated PET/CT, better anatomic details of nodules were available with PET/CT than with PET only, thus helping enhance diagnostic accuracy with morphologic information added to metabolic information. Morphologic information on CT is an independent crucial variable in determining malignancy and benignancy (12). In the present study, the sensitivity, specificity, and accuracy for predicting malignant nodule at integrated PET/CT were 96% (76/79), 88% (35/40), and 93% (111/119), respectively. This sensitivity and accuracy were significantly better than those of HDCT.
In terms of devising diagnostic strategies for SPNs, the following questions may be raised: Should both examinations be performed despite possible radiation hazards and the higher cost, or one of them? If so, which is technically better and which is more cost-effective? Regarding the diagnosis of malignancy, all nodules were interpreted correctly in 1 of 2 studies. PET/CT was more sensitive (96%) and accurate (93%) than HDCT, which had 81% sensitivity and 85% accuracy. According to our study, PET/CT provides the most sensitive noninvasive diagnostic modality for malignant nodule diagnosis. Having considered our results in perspective, we believe that SPNs may be initially evaluated using integrated PET/CT rather than HDCT. Because HDCT is less expensive for examination and more available in most institutions and because CT has high specificity (93%) and acceptable sensitivity and accuracy for malignant nodule detection, it may be a reasonable alternative when PET/CT is unavailable.
Integrated PET/CT has a high negative predictive value (92%; 35/38 nodules interpreted as benign proved to be benign) for malignant nodule characterization. This high negative predictive value may allow us to wait and have a follow-up evaluation of the SPN after a certain time interval of 3 or 6 mo. Moreover, PET/CT also provides the most accurate means of performing a staging evaluation on the whole body, when a nodule has been proven malignant (18), and therefore useful in terms of the cost-effectiveness and the avoidance of inappropriate benign SPN resection (14,19).
On integrated PET/CT, 3 malignant nodules were erroneously interpreted as benign. These 3 nodules were adenocarcinomas with bronchioloalveolar carcinoma components: >50% of nodule volume in 1 and <50% in 2. It is well known that focal bronchioloalveolar carcinoma with ground-glass opacity areas within it on thin-section CT shows little 18F-FDG uptake (20).
The accuracy of percutaneous needle biopsy or aspiration requires elaboration. According to one study of 122 transthoracic needle biopsies (21), the overall diagnostic yield for coaxial transthoracic needle biopsies was 88%; for malignancy its sensitivity was 95%, whereas a specific benign diagnosis was obtained in 91%. These described diagnostic yields are lower than those obtained by PET/CT in our study, with the exception of specificity, which suggests that percutaneous transthoracic biopsy cannot totally replace PET/CT for nodule characterization.
HDCT provides morphologic and hemodynamic information on nodules. On HDCT, nodules with ≥25 NE and 5–31 HU of washout can be diagnosed as malignant nodules with high specificity. Of 15 malignant nodules falsely interpreted as negative on HDCT, only 4 nodules had an NE of <25 HU. The remaining 11 nodules were misinterpreted as benign due to an unusual malignant nodule washout pattern as for a malignant nodule (12); specifically, 7 showed persistent enhancement without washout, and 4 showed washout of >31 HU, although they had an NE of >25 HU. Therefore, when a nodule shows ≥25 HU NE on HDCT, the possibility of malignancy should be considered regardless of the delayed washout pattern, because 11 of our 15 false-negative nodules had a NE of ≥25 HU. Interestingly, all of these 15 falsely interpreted malignant nodules were correctly diagnosed on integrated PET/CT.
The nodules with <25 NE on HDCT have only a low possibility of being malignant (range, 0%−5%) (12). However, when nodules with NE of <25 show malignant morphologic features of a lobulated and spiculated margin but without satellite nodules, PET/CT may suggest malignancy with high 18F-FDG uptake. According to a study by Jeong et al. (12), multivariate analysis was used to identify the criteria on HDCT independently associated with a diagnosis of a malignant nodule with higher odds ratio for malignancy—namely, both >25 HU washin and 5–31 HU washout (P < 0.001, odds ratio = 25.7), a lobulated margin (P = 0.011, odds ratio = 41.7), a spiculated margin (P = 0.006, odds ratio = 35.3), and the absence of a satellite nodule (P = 0.004, odds ratio = 13.8). Therefore, when nodules have the malignant morphologic features of a lobulated or spiculated margin without satellite lesions but HDCT suggests benign especially with >25 HU of NE (washin), PET/CT study should be done even though its availability is inconvenient.
The percentage of nodules <10 mm in diameter in our study was low at only 7% (8/119 nodules). Moreover, contrary to the expectation that the characterization of nodules <10 mm in diameter would be difficult on HDCT or PET/CT, these small nodules were correctly diagnosed on both HDCT and PET/CT, except for one nodule. Specifically one benign nodule was falsely diagnosed as malignant on PET/CT, but correctly on HDCT. However, our results on diagnostic accuracies for nodules <10 mm in diameter are based on numbers that are too small for generalization.
Our study has several limitations. The first one is selection bias. In our study, malignant nodules (79/119 nodules, 66%) were more selectively included, therefore, were much higher than their usual percentage of about 40% among SPNs (5,7). Because PET/CT studies were executed in patients with probable malignant nodules (indeterminate HDCT study results may have served as a preselection inclusion criterion) and because we included patients in whom both HDCT and PET/CT were performed, more patients with malignant nodules were undoubtedly included. The higher proportion of patients with malignant nodules might have contributed to the enhancement of observed positive predictive value and specificity of integrated PET/CT. Likewise, malignant nodules (mean diameter, 23 mm) were significantly larger in diameter than benign nodules (mean, 18 mm), which may also have contributed to the improvement of integrated PET/CT sensitivity. However, PET/CT studies were evaluated in conditions blinded to all previous HDCT, clinical, and pathologic results. Second, we did not obtain respiration-gated PET/CT images. It is well known that respiratory motion is a major error source in the quantification of lesion activity on integrated PET/CT, especially for small nodules (22). In such conditions, by obtaining respiration-correlated CT for attenuation correction, the fluctuations of PET SUVs can be quantified, thus optimizing SUVs and reducing activity loss related to motion artifact (23). Third, follow-up period (only >12 mo) was insufficient for presumed benign nodules (20/119, 17%). Nodules are usually considered benign when they show no growth or decrease in size or disappearance over the follow-up period of >24 mo.
CONCLUSION
Integrated PET/CT is an important diagnostic tool for the tissue characterization of SPNs with higher sensitivity and accuracy values than those of HDCT; therefore, PET/CT may be performed as the first-line evaluation tool for SPN characterization. Because HDCT has high specificity and acceptable sensitivity and accuracy values, it may be a reasonable alternative for nodule characterization when PET/CT is unavailable.
References
- Received for publication August 29, 2005.
- Accepted for publication November 15, 2005.


Jump to section
Related Articles
Cited By...
- Patients presenting with metastases: stage IV uveal melanoma, an international study
- Large adrenal mass heralding the diagnosis of occult extra-adrenal malignancy in two patients
- Does aggressive management of solitary pulmonary nodules pay off?
- Lung Cancer Screening, Version 3.2018, NCCN Clinical Practice Guidelines in Oncology
- Accuracy and cost-effectiveness of dynamic contrast-enhanced CT in the characterisation of solitary pulmonary nodules--the SPUtNIk study
- Assessment of incidental and clinically unsuspected fluorodeoxyglucose-avid foci detected on oncological positron emission tomography/CT
- Investigating the solitary pulmonary nodule
- Lung Cancer Screening
- Preliminary study on the correlation between grading and histology of solitary pulmonary nodules and contrast enhancement and [18F]fluorodeoxyglucose standardised uptake value after evaluation by dynamic multiphase CT and PET/CT
- PET/CT assessment of clinically unsuspected, incidental FDG-avid lesions in oncological patients
- Improvements in Cancer Staging with PET/CT: Literature-Based Evidence as of September 2006