


Abstract
Respiratory motion during the CT and PET parts of a PET/CT scan leads to imperfect alignment of anatomic features seen by the 2 modalities. In this work, we concentrate on the effects of motion during CT. We propose a novel approach for improving the alignment. Methods: Respiratory waveform data were gathered during the CT and PET parts of 28 PET/CT scans of cancer patients with 40 lesions up to 3 cm in size in the lung or upper abdomen. PET list-mode data were reconstructed by 3 reconstruction methods: PET/static (the standard method with no motion correction); PET/ex (a method that calculates a range of expiratory amplitudes from the lowest one to the highest one); and PET/matched (a novel method that uses both waveforms). The 3 methods were compared. The distance between tumor positions in PET and CT were characterized in visual interpretation by physicians as well as quantitatively. Tumor SUVs (SUVmax and SUVpeak) were determined relative to SUV based on the static method. Image noise was evaluated in the liver and compared with PET/static. Results: In visual interpretation, the rate of good alignment was 13 of 21, 13 of 23, and 18 of 21 for the PET/static, PET/ex, and PET/matched methods, respectively, and the mean PET/CT distances were 3.5, 5.1, and 2.8 mm. In visual comparison with PET/ex, the rate of good alignment was increased in 1 of 10 and 7 of 10 cases for PET/static and PET/matched, respectively. SUVmax was on average 21% higher than PET/static when either PET/ex or PET/matched was used. SUVpeak was 12% higher. Image noise in the liver was 15% higher than PET/static for the PET/ex method, and 40% higher for PET/matched; that is, noise was much lower than in gated PET. Conclusion: Acquiring respiratory waveforms both in PET (as in the current state of the art) and in CT (an unusual key step in this approach) has the potential to improve the alignment of PET and CT images. A proposed method for using this information was tested. Improved alignment was demonstrated.
Whole-body PET/CT uses a fast free-breathing CT scan followed by a free-breathing PET scan. Because of respiratory motion during either part of the procedure—CT or PET—the alignment of anatomic features seen by the 2 modalities is never perfect (1,2). This is rather different from reduced PET image sharpness due to breathing, which has been well studied (3). Misalignment can potentially degrade the interpretation of the physician reading the scan and cause quantitative errors in SUVs based on incorrect attenuation and scatter correction (AC). In this work, we concentrate on the effects of respiratory motion in CT. Our premise is that respiratory motion during PET, since it is unavoidable, provides an opportunity to select the most useful part of the PET measurement to improve both the alignment and the image sharpness. We propose a novel correction method based on this premise.
Years ago, it was proposed that respiratory gating—based on hardware to measure a respiration-correlated signal during the scan—should be able to be beneficial. Three-dimensional images (3D) were replaced with 4-dimensional (4D) ones (including a respiratory phase or amplitude in addition to the 3 spatial dimensions). Some of the earliest papers on this topic combined 4D PET and 4D CT in the expectation of accurate spatial alignment (4–6). Sharper PET images and improved spatial alignment were demonstrated, but there were practical disadvantages: the large number of PET and CT images was not easily viewed and interpreted; a long time was required for acquisition and reconstruction; image noise was high; the use of 4D CT increased acquisition time and radiation exposure; and accuracy could still be limited by variabilities in the patient’s breathing. To overcome some of these difficulties, optimal respiratory gating (OG) was introduced (7), a method that uses a third of all counts acquired near the end of exhalation to reconstruct a single sharp 3D PET image with better image noise properties than 4D. In a recent advance, image noise was reduced by methods such as elastic motion deblurring (8,9). Other approaches used a displacement field, in some cases addressing the alignment of PET to CT by using PET displacements to distort the CT images in various respiratory phases (10–12).
Chang et al. proposed a protocol with acquisition of respiratory-gating waveforms in spiral CT and in PET (13). Waveform amplitude was recorded when the CT scanner’s x-ray source passed over a tumor of interest. In the corresponding PET bed position, data were prospectively gated to select that waveform amplitude. Good spatial alignment was demonstrated for the tumor of interest, though misalignment could occur in other areas.
In this paper, we describe a synthesis of these approaches, one that has a simple workflow and is effective in whole-body PET/CT based on the principle of matching waveforms acquired during CT and PET. We have described this approach previously (14) but, until now, have not published the results. Data are acquired in a normal whole-body PET/CT acquisition that includes a fast spiral CT scan and acquisition of respiratory waveforms during CT and PET. The matching method is evaluated in cancer patients’ PET/CT scans and compared with reconstructions based on static reconstruction and elastic motion deblurring.
MATERIALS AND METHODS
Patient Accrual, Acquisition, and Reconstruction
Patient data in this study had been used in previous work (9). The institutional review board approved the study (approvals 2015-0989 and PA18-1159). All subjects gave written informed consent before undergoing imaging. The earlier study was based on 46 patients, selected prospectively from patients referred for whole-body PET/CT for management of cancer with lung or liver lesions less than 3 cm in diameter. The work reported here excluded cases in which the respiratory waveform quality was inadequate. Patients fasted for 6 h before injection of 323 ± 56 MBq of 18F-FDG. One hour after injection, a PET/CT scan was performed with a Biograph mCT Flow PET/CT system (Siemens Medical Solutions USA, Inc.). The CT scan used a standard spiral acquisition with 19.2-mm axial collimation, 0.5 s/rotation, and a pitch of 1.3. List-mode PET data were acquired during continuous bed motion with a bed speed of 0.8 or 1 mm/s, slowed to 0.5 mm/s in a 30-cm region over the lungs and liver. CT and PET data were acquired during free breathing. Respiratory waveforms were acquired during CT and PET with the Anzai strain-gauge system (Anzai Medical).
Three PET reconstruction methods were compared. In this paper, we use the names PET/static, PET/ex, and PET/matched for the 3 methods, emphasizing their relation to the patient’s breathing during the PET scan, especially exhalation and inhalation. PET/static reconstruction was the standard method with no motion correction. It used ordered-subsets expectation maximization reconstruction of the static sinogram and included time-of-flight point-spread function modeling, a 200 × 200 matrix size, 2 iterations, 21 subsets, and a 5-mm gaussian smoothing kernel. The acquired CT series was used for AC. PET/ex reconstruction was the OncoFreeze method (Siemens) that has been described previously (8,9). OncoFreeze calculates a range of amplitudes from a lower one to an upper one, using a low-frequency baseline correction for the waveform, an essential step that improves consistency between the gated and static sinograms. This range corresponds to exhalation. OncoFreeze sorts this part of the list into a sinogram, from this reconstructs an OG or HD-Chest image (Siemens) (not used in this analysis because of a higher level of image noise), compares the OG image to the static one to determine a position-dependent respiratory blurring kernel, and finally uses this as an adjustment to the point-spread function kernel to reconstruct the static sinogram, creating the PET/ex image that has the sharpness of OG and better noise properties than gated PET. PET/ex used the same reconstruction parameters as PET/static.
PET/matched reconstruction was the novel method that is described for the first time in this paper. The reconstruction uses 2 respiratory waveforms: one acquired in CT and one acquired in PET. CT and PET waveforms were recorded by different computers. The CT waveform was not baseline-corrected because the duration was only a few breaths; as described above, the PET waveform was corrected. Like the OG and PET/ex methods, the PET/matched method uses a sinogram based on only part of the PET data list. In 2 respects, PET/matched differs from OG and the PET/ex method. First, whereas OG uses the same end-of-exhalation range of waveform amplitudes for the whole PET scan, PET/matched uses a different range of amplitudes at each axial position, selected to match the CT waveform. Second, whereas OG reconstructs sharp images based on about a third of the PET data (this is the duty cycle), PET/matched has to use a smaller fraction of the data to reduce respiratory motion blurring. In this work, we used a duty cycle of one eighth. Similarly to the PET/ex reconstruction, PET/matched calculates lower (depending on axial position) and upper (also depending on axial position) respiratory amplitudes at each axial position in the PET scan, based on 2 requirements: first, the range from lower to upper includes one eighth of all the PET list data at that position, and second, respiration in PET and CT are matched by comparing the average waveform amplitude at each position during PET (lower to upper) with the actual waveform amplitude at the same position in CT. One tries to make the average amplitude in PET equal the amplitude in CT. Since this cannot be done at all positions because of the variability in patient breathing during the PET scan, the first requirement takes precedence. PET data in the range from lower to upper are sorted into a waveform-matched sinogram, which is reconstructed to create a preliminary PET/matched image. This is noisy, similar to 4D PET, since the underlying sinograms have only an eighth of the counts of the static sinogram, potentially leading to a high rate of false-positive readings. The matched image is made with the OncoFreeze approach. The algorithm compares the preliminary PET/matched image with the static image to determine a position-dependent respiratory blurring kernel associated with matching, then uses the kernel to reconstruct the static sinogram, creating a PET/matched image that has the sharpness of the preliminary PET/matched image and better noise properties than gated PET. The PET/matched method used the same reconstruction parameters as PET/static and PET/ex.
For the PET/matched method to work properly, the CT and PET waveforms should measure the patient’s breathing accurately, without technical errors. We inspected both waveforms for every patient and in some cases noticed errors, such as when the recorded waveform stayed at the minimum or maximum value of the hardware for longer than a few seconds. When such technical errors were noticed, data from that patient were excluded from this analysis.
Using the CT Waveform to Predict PET/CT Alignment Accuracy
A respiratory waveform can be represented graphically as an amplitude plotted versus time from the start of the scan, and the graph can be aligned with the CT image so that each anatomic region can be associated with a phase of respiration. We made such figures to analyze the patient data in this study, as shown, for example, in Figure 1, where the black curve shows the waveform during CT. Peaks are seen at full inhalation (CT/in) and valleys at exhalation (CT/ex). Blue curves in the figure represent the range of amplitudes used in PET/matched, the limits lower to upper that are described above.
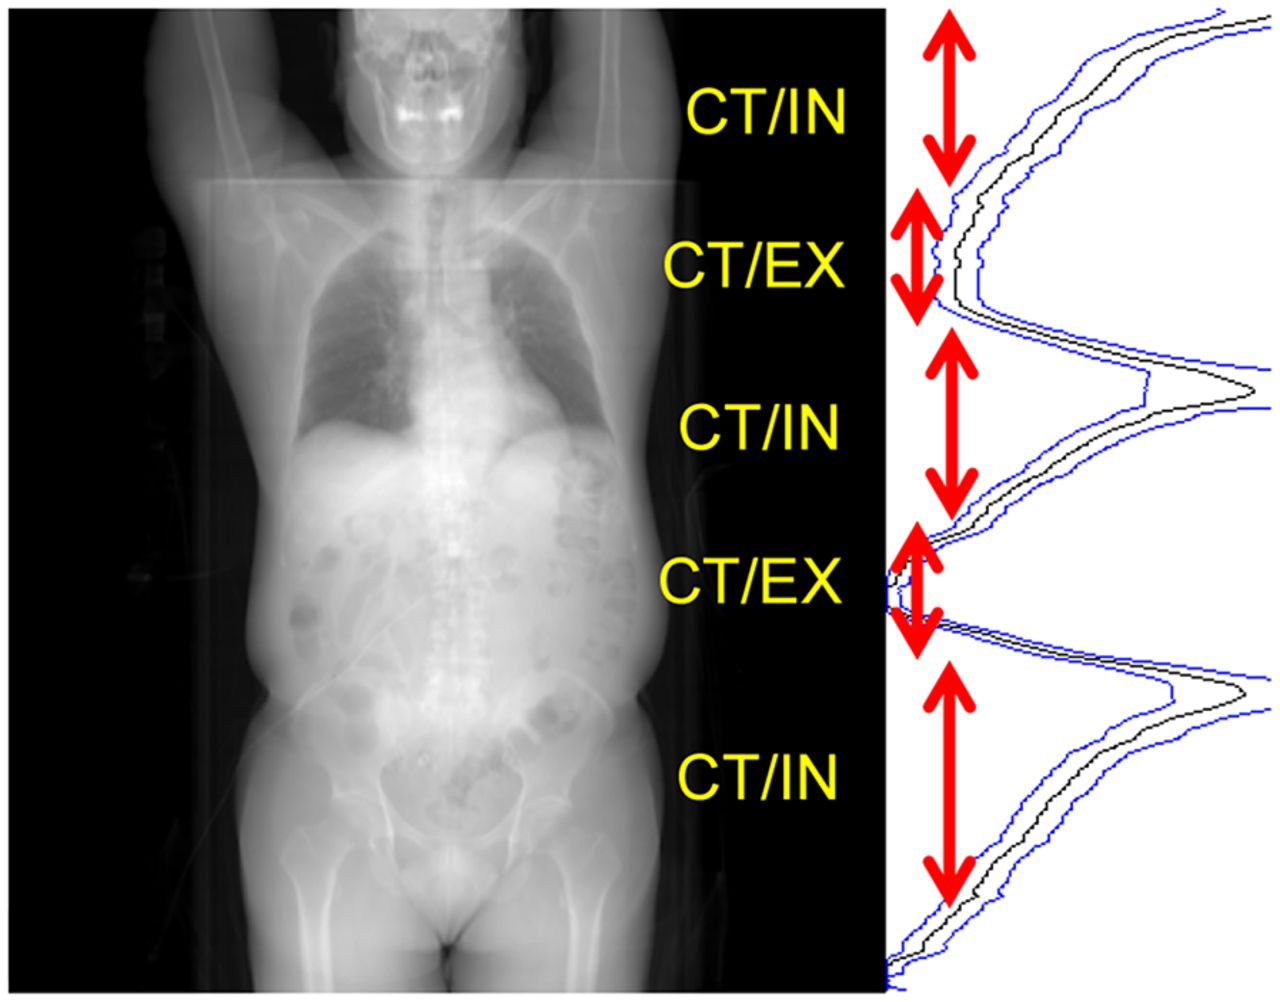
Anterior projection of patient’s whole-body CT image series, alongside a respiratory waveform aligned with the CT projection, with increasing amplitude toward right. Axial zones where CT/in and CT/ex occurred are indicated.
Because the PET/ex method is based on end of exhalation, one expects PET/ex to be well aligned with CT in the CT/ex regions, such as in the upper lungs in Figure 1 and the middle of the abdomen. Conversely, imperfect alignment and potential AC errors are possible in the CT/in regions, such as in the lower lungs and the upper abdomen in Figure 1. PET/matched should be well aligned everywhere, and a good AC is expected. As for PET/static, the effect of motion on alignment and accuracy is not easily predicted (2). We attempted to characterize all lesions in the study as CT/ex or CT/in based on inspection of a graphic such as Figure 1. In a few cases, computer files with the waveform information could not be located during analysis, resulting in classification as CT/unknown. We expected good alignment in these cases: for PET/matched, always, and for PET/ex, in the CT/ex regions and in cases where tumors do not move with respiration. For PET/static, no prediction could be made.
Evaluation
The evaluation had 3 parts: comparison of lesion locations in CT versus PET/static, PET/ex, and PET/matched reconstructions; a comparison of lesion SUV; and a visual comparison. The distance between CT and PET locations was estimated numerically in lung tumors but not for abdominal ones that were inconspicuous on CT. In CT and PET, center-of-gravity coordinates were calculated in 3D with MIM software, version 6.6 (MIM Software, Inc.). For CT, this calculation was based on a threshold of −400 Hounsfield Units and, in some cases, an additional contour to exclude adjacent tissue. For PET, an isocontour used a threshold of 42% of SUVmax. If the lesion could not be separated automatically from surrounding tissue, the PET Edge calculation of the software was used. The PET/CT distance was calculated in the superior–inferior direction (z), the direction of most motion, making it independent of uncertainties in the orthogonal directions. SUVmax and SUVpeak were determined by the MIM software. Noise was modeled by computing SUV SD in disease-free 3-cm spheric volumes in the liver as described in the procedure used by Meier et al. when analyzing data from the same patients (9).
The visual comparison provided a clinical interpretation. In a masked comparison, 3 nuclear medicine physicians (readers) were asked to assess the spatial alignment. For each case, PET/static, PET/ex, and PET/matched images were presented side by side in a scrambled order. For each lesion and each reconstruction method, each reader described the lesion alignment (PET relative to CT), choosing among these possibilities: good, acceptable, poor, and cannot tell. The readers recorded their answers in a spreadsheet. A PET image of a tumor was said to be aligned with CT, in the interpretation of a given reader, if the recorded answer was good or acceptable, and it was said to be not aligned if the interpretation was poor. These results were combined on the basis of a consensus of at least 2 of the 3 readers. For example, if 2 readers recorded “poor” and 1 recorded “good” or “cannot tell,” it was concluded that PET and CT were not aligned in that case.
RESULTS
Of 46 patients in the original study, 28 were included in this analysis on the basis of acceptable waveform quality during both CT and PET (61%). The number of lesions per patient included in this study was either 1 or 2 based on the lesion inclusion in the original study, a total of 40. Respiratory phases during CT were classified as 14 lesions at CT/ex, 21 at CT/in, and 5 at CT/unknown. The classification was ambiguous in some cases. The locations were 27 in or adjacent to the lung and 11 in the abdomen. The distance between CT and PET locations could be estimated numerically for 26 lung tumors. In the masked visual comparison, 23 lesions in 17 patients were selected for inclusion in this part of the study when tumor location could be appreciated on the basis of CT while excluding cases of CT/ex. The results from the quantitative and qualitative analysis are in Tables 1 and 2. In only 1 case did we have to rely on the PET Edge calculation to separate a lesion from surrounding tissue.
PET/CT Distances, Changes Relative to Static Image, and Liver Noise
Visual Assessment of Relative Alignment of PET and CT Tumor Locations
Figure 2 represents, as a function of time, the scan of the patient in Figure 1, also showing the baseline-corrected waveform during the PET scan and the acquisition time intervals and the range of amplitudes, lower to upper, used for PET/ex and PET/matched. PET/ex was based on data acquired when the waveform fell in the range illustrated by A in the figure, that is, the OG image used a third of all data. PET/matched at the 5 positions (B–F) used an amplitude range that varied with position. The preliminary PET/matched image was based on an eighth of the data in each position. These corresponded to 2 positions in the upper lung and then to successive positions in the middle lung, the lower lung, and the liver. In each case (B–F), 12.5% of the PET data were selected on the basis of the waveform values between lower and upper, and the average waveform amplitude matched the CT waveform amplitude in all cases except E, where the matching CT amplitude was too high, and in this case the top 12.5% of the amplitudes were used. Figure 2 is qualitative; exact times and amplitudes used in the calculation might have been slightly different from the ones shown.

Respiratory waveform amplitudes plotted vs. time in PET scan. (A) Amplitude range used for OG. (B–F) Time and amplitude ranges for successive positions between upper lung and upper abdomen. a.u. = arbitrary units.
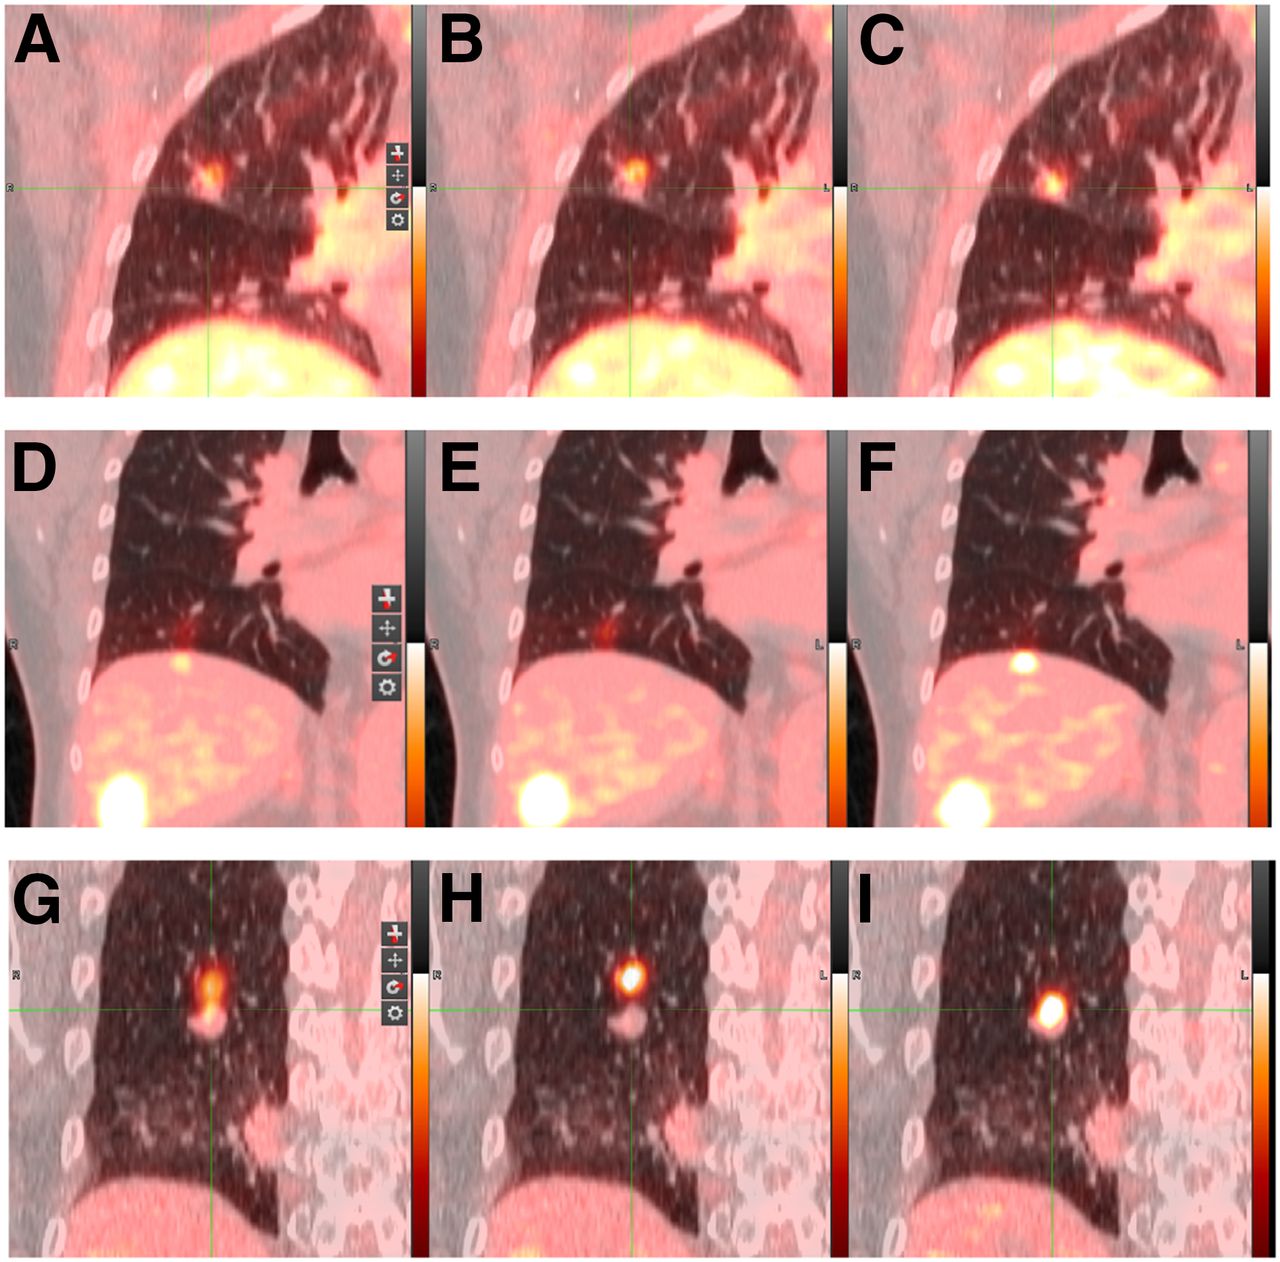
Figure 3 shows fused PET/CT images, made with PET/static, PET/ex, and PET/matched reconstructions, for 3 lesions in 3 patients, all acquired at CT/in. The top row illustrates a 1.1-cm3 nodule near the horizontal fissure in the right lung, with SUVs of 2.9, 3.4, and 3.3 in the 3 images. PET-to-CT distances were 7.4, 7.5, and 5.8 mm, respectively. The middle row shows a streak of PET uptake near the liver dome or in the inferior right lobe with SUV measurements of 3.2, 2.6, and 5.8, respectively. This was the same patient as that whose CT waveform is shown in Figure 1. Because this was CT/in, one expects that the diaphragm may have been shifted inferiorly during the CT measurement, resulting in underestimation of the attenuation in PET/static and PET/ex. The PET-to-CT distance was not estimated in this case. The bottom row illustrates a 1.4-cm3 right-lung nodule with SUV measurements of 5.4, 8.4, and 9.7, respectively. PET-to-CT distances were 11.2, 17.0, and 5.2 mm, respectively.

Coronal PET/CT images from 3 patient scans. Static (A, D, and G), PET/ex (B, E, and H), and PET/matched (C, F, and I) reconstructions are shown.
DISCUSSION
This paper introduces the PET/matched method and presents a 3-way comparison of images of 40 tumors created by the PET/static, PET/ex, and PET/matched methods. The comparison is summarized in Tables 1 and 2 and in Figure 3. In most cases, the distances between images of the tumors on PET and CT were only a few millimeters, whatever the reconstruction method. The largest PET/CT distances were associated with CT/in. The PET/matched method aligned the modalities better than the PET/static or PET/ex method. This improvement was clearly shown by the fact that when experienced nuclear medicine physicians performed a masked comparison, the PET/matched images were aligned with CT/in in 6 of 8 cases in which PET/static was poorly aligned and in 7 of 10 cases in which PET/ex was poorly aligned. In 3 lesions, areas of PET uptake were not clearly related to anatomy seen on CT, resulting in an assessment of poor alignment for all reconstruction methods.
Because both PET/ex and PET/matched reduced respiratory motion blur, some increase in SUV would be expected for both. Table 1 indicates that this was the case. One anticipates a smaller SUV advantage for PET/matched because of intraframe blurring, yet Table 1 shows that the SUV changes were on average the same for the 2 methods. A possible explanation is that AC was more accurate when matching was used. However, this possibility has not been proven. AC errors in the PET/static and PET/ex methods could either increase or decrease SUV in various cases. The complicated interplay between effects is a topic for future investigation.
Table 1 demonstrates that the matching method resulted in somewhat higher image noise, 140% relative to PET/static, compared with 115% when PET/ex was used. In previous work that used some of the same patient data, noise in PET/ex was also 115%, whereas noise in images based on OG was 156% and noise based on 8 phase gates was 270% (9). The increase is likely due to noise in the OncoFreeze deblurring kernel. In fact, image noise in optical-flow calculations has been a recognized problem for many years (10), and OncoFreeze is based on the optical flow concept.
In a few cases, the use of PET/matched reconstruction improved the PET/CT alignment remarkably. Figure 3 presents 2 such cases: a hot spot that we interpreted as a tumor near the dome of the liver, and a mobile tumor in the right lung, both of which were not properly handled by the state of the art. We expect such cases of serious mispositioning to occur rarely, as noted long ago by Osman (1), and were gratified to see that the PET/matched method seemingly improved the situation. In future work, we hope to identify more cases such as these, in a larger study of PET/matched reconstructions with more patients, to see if matching has the potential to change patient management. No such conclusion can be drawn from this initial study.
The combination of respiration measurements during fast spiral CT and normal 3D PET has to our knowledge not been used since the work of Chang et al. (13). Other proposals have been made to address the underlying concerns. The combination of 4D CT and 4D PET was demonstrated many years ago yet has been little used, perhaps because of the technically difficult protocol (3,4). Van der Vos et al. demonstrated that the CT scanner, operated in sequence mode, could be triggered at exhalation to generate low-dose CT images well matched to OG PET, but the investigators did not pursue this course of inquiry for several reasons, including the long CT acquisition time (15). Pan et al. proposed respiration-averaged CT scans to reduce the level of artifact, though this reduction was at the cost of a somewhat more complicated workflow and, depending on the implementation, could increase patients’ radiation exposure (16). Lu et al. avoided respiration artifacts in PET by deriving the attenuation coefficients from the PET data. This method has promise but has not been tested clinically (17).
In this work, 18 of 46 patients were excluded from the study because of technical errors in acquisition of the respiratory waveforms. Such errors would disappear with the adoption of data-driven gating. This is called PET data-driven gating, an approach in which the PET scanner itself detects respiratory motion, avoiding the need for hardware dedicated to generation of a gating signal (18,19). The PET/matched method additionally requires a waveform from the CT scan, and to our knowledge no one has demonstrated a CT data-driven gating method for high-pitch CT, although a proxy-free approach was demonstrated by Werner et al. in the case of low pitch (20). Until CT data can be robustly gated in a data-driven approach, the PET/matched approach will require hardware to gate at least the CT, so it is of interest to develop a method by which hardware measurements and be made more easily. For example, microwave-based detection of respiration has been proposed as a technique for CT and PET that may require little or no operator setup (21). Widespread use of the PET/matched method may require some such simplification in the clinical routine.
CONCLUSION
The PET/matched method, with a simple workflow, combines respiratory waveforms acquired in CT and PET to sharpen a PET image and improve the alignment with CT. The method uses a different part of the patient’s breathing cycle at each axial position. This approach can overcome certain breathing-related artifacts in PET/CT, such as incorrect PET tumor positioning near the dome of the liver as in Figures 3D–3F. Although other approaches, notably the one proposed by Lu et al. (17), bring similar advantages and better noise properties, the proposed method has a unique ability to spatially match PET to acquired CT images even when CT is distorted by motion.
DISCLOSURE
James Hamill is employed by Siemens Medical Solutions USA, Inc. No other potential conflict of interest relevant to this article was reported.
KEY POINTS
QUESTION: Can spatial alignment of the position of a lesion on CT and PET images be improved by a novel reconstruction method based on respiratory waveforms measured in CT and PET?
PERTINENT FINDINGS: Alignment based on the PET/matched method was measurably and visibly improved without a large increase in image noise.
IMPLICATIONS FOR PATIENT CARE: By reducing positioning errors, the PET/matched method has the potential to improve the accuracy of PET/CT in applications such as cancer staging and the evaluation of tumor response to therapy while increasing the confidence of the physician interpreting the scan.
Acknowledgments
Matt Mitchell, Judson Jones, and Inki Hong provided software, encouragement, and technical assistance without which this work might not have been possible.
Footnotes
Published online Jan. 31, 2020.
- © 2020 by the Society of Nuclear Medicine and Molecular Imaging.
REFERENCES
- Received for publication August 28, 2019.
- Accepted for publication January 10, 2020.


Jump to section
Related Articles
Cited By...
- No citing articles found.