


Visual Abstract

Abstract
The aims of this study were to decrease the 177Lu-SPECT acquisition time by reducing the number of projections and to circumvent image degradation by adding deep-learning–generated synthesized projections. Methods: We constructed a deep convolutional U-net–shaped neural network for generation of synthetic intermediate projections (CUSIPs). The number of SPECT investigations was 352 for training, 37 for validation, and 15 for testing. The input was every fourth projection of 120 acquired SPECT projections, that is, 30 projections. The output was 30 synthetic intermediate projections (SIPs) per CUSIP. SPECT images were reconstructed with 120 or 30 projections, or with 120 projections when 90 SIPs were generated from 30 projections (30–120SIPs), using 3 CUSIPs. The reconstructions were performed with 2 ordered-subset expectation maximization (OSEM) algorithms: attenuation-corrected (AC) OSEM, and attenuation, scatter, and collimator response–corrected (ASCC) OSEM. The quality of the SIPs and SPECT images was quantitatively evaluated with root-mean-square error, peak signal-to-noise ratio (PSNR), and structural similarity (SSIM) index metrics. From a Jaszczak SPECT phantom, the recovery and signal-to-noise ratio (SNR) were determined. In addition, an experienced observer qualitatively assessed the SPECT image quality of the test set. Kidney activity concentrations, as determined from the different SPECT images, were compared. Results: The generated SIPs had a mean SSIM value of 0.926 (SD, 0.061). For AC-OSEM, the reconstruction with 30–120SIPs had higher SSIM (0.993 vs. 0.989, P < 0.001) and PSNR (49.5 vs. 47.2, P < 0.001) values than the reconstruction with 30 projections. ASCC-OSEM had higher SSIM and PSNR values than AC-OSEM (P < 0.001). There was a minor loss in recovery for 30–120SIPs, but SNR was clearly improved compared with 30 projections. The observer assessed 27 of 30 images reconstructed with 30 projections as having unacceptable noise levels, whereas the corresponding values were 2 of 60 for 30–120SIPs and 120 projections. Image quality did not differ significantly between 30–120SIPs and 120 projections. The kidney activity concentration was similar between the different projection sets, excepting a minor reduction of 2.5% for ASCC-OSEM 30–120SIPs. Conclusion: Adopting SIPs for sparsely acquired projections considerably recovers image quality and could allow a reduced SPECT acquisition time in clinical dosimetry protocols.
Encouraging treatment effects have been reported for 177Lu-pharmaceuticals in somatostatin receptor–positive neuroendocrine tumors and metastatic prostate cancer (1,2). 177Lu-DOTATATE was recently approved for treatment of neuroendocrine tumors with a standard protocol allowing a maximum of 4 treatments with 7.4 GBq. The protocol does not require dosimetry. Nevertheless, a recent prospective dosimetry study demonstrated that an increased number of treatments can be given on the basis of total absorbed kidney dose (3), thereby avoiding undertreatment. In addition, dose–response relationships have been reported for the dose-limiting organs kidney and bone marrow, indicating the potential for dosimetry as one important factor in the individualized treatment protocol (4,5).
Recent dosimetry protocols have used SPECT and CT images or a combination of planar images and SPECT/CT (4). In the latter, the kinetics are determined from the planar images and the activity concentration from the SPECT images. In a simulation study, the relative uncertainty about kidney-absorbed doses was 32% for planar dosimetry, 15% for the planar/SPECT/CT method, and 6% for purely SPECT/CT-based dosimetry (6). This pattern indicates a clear advantage for SPECT/CT-based dosimetry, but this imaging format is time-consuming, and whole-body SPECT/CT with appropriate counting statistics is challenging to obtain.
The SPECT/CT reconstruction methods have gone from a filtered backprojection approach to the iterative ordered-subset expectation maximization (OSEM) algorithm (7). Today’s analytic OSEM reconstruction algorithms (e.g., Evolution [GE Healthcare], xSPECT [Siemens Healthineers, USA], and Flash3D [Siemens Healthineers, USA]) offer the potential to correct for attenuation, scatter, and collimator–detector resolution, with improved image quality and accuracy in activity quantification (8). Further improvements might be achieved by Monte Carlo–based OSEM reconstruction methods (9–11). According to the European Association of Nuclear Medicine/MIRD guideline for quantitative 177Lu SPECT dosimetry, the number of projections should be 60–120 (12), which was used in recent publications on clinical 177Lu dosimetry (Table 1). An Uppsala group reported the most time-consuming protocol, which used 60 or 120 projections with acquisition times of 30 min and attenuated-corrected (AC) OSEM (3,13,14). With this protocol, 4 data points at 1, 24, 96, and 168 h after injection are collected, enabling accurate 177Lu kinetics. However, at many centers, the available camera time is limited, and acquisition times are shorter (15–22). A short acquisition time may become problematic when measuring at later time points, because of increased image noise (17,23). With the introduction of 177Lu-prostate-specific membrane antigen for metastatic prostate cancer, SPECT/CT dosimetry requires 2–3 bed positions to cover the critical organs: salivary gland, bone marrow, kidneys, and targets in the pelvis region (21,24). Such protocols require restricted acquisition times per bed position for patient comfort and may still need more camera time. In these later studies, attenuation, scatter, and collimator–detector response–corrected (ASCC) OSEM reconstructions are often used for good image quality.
Clinical SPECT Acquisition Protocols for 177Lu Dosimetry
The aim of this study was to reduce the SPECT acquisition time by reducing the number of projections and to compensate for image quality degradation by including synthetic intermediate projections (SIPs) in the reconstruction. We created 3 convolutional neural networks and trained them to generate 3 × 30 SIPs from 30 acquired projections. We analyzed the image quality of phantom and patient SPECT images and estimated the kidney activity concentration for SPECT images reconstructed with the SIPs. Two SPECT/CT reconstruction methods were tested: AC-OSEM and ASCC-OSEM, using Monte Carlo methodology for the latter.
MATERIALS AND METHODS
Subjects and Image Acquisition
We retrospectively selected 304 177Lu-DOTATATE and 100 111In-octreotide SPECT images acquired between 2007 and 2018. The retrospective use of the image data and waiver of consent were approved by the Regional Ethical Review Board in Gothenburg.
The γ-cameras were a Millennium VG Hawkeye, an Infinia Hawkeye 4, and a Discovery 670 (GE Healthcare), all with a crystal thickness of ⅝ in and equipped with a medium-energy parallel-hole collimator. For 177Lu-DOTATATE examinations, we used a 20% energy window over the 208-keV photon peak, and for 111In-octreotide examinations, a 20% energy window over the 245-keV photon peak was used. The clinical SPECT images were acquired 1–3 d after injection with 110–220 MBq of 111In-octreotide or 3–7.4 GBq of 177Lu-DOTATATE, with 30-s frames for 120 projections. The matrix size was 128 × 128, with a pixel size of 4.42 mm and a slice thickness of 4.42 mm. The CT images used in the SPECT/CT reconstructions were acquired using a 140-kV tube voltage, 2.5 mAs, and a rotation speed of 2.6 rpm. The matrix size was 512 × 512, with a pixel size of 0.98 mm and a slice thickness of 5 mm.
The Convolutional Neural Network
We constructed a deep convolutional U-net–shaped neural network for generation of SIPs (CUSIPs) from a sparse set of projections, either 30 or 60 (25). We describe here the method for 30 projections; the methodology is similar for 60 projections. The data for 60 projections were evaluated only with the phantom measurements, whereas the 30 projections were evaluated more extensively.
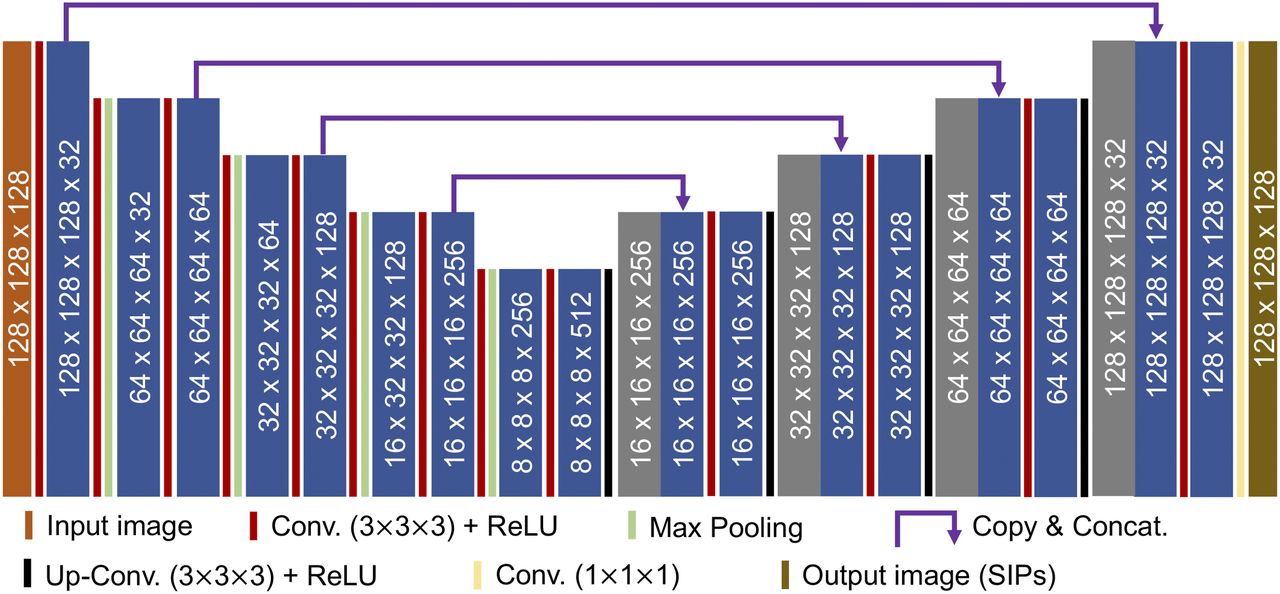
The CUSIP was implemented in the Microsoft Cognitive Toolkit, version 2.6. The 3-dimensional U-net structure consisted of encoder and decoder units with skip connections between the corresponding layers (Fig. 1). The input image consisted of 30 projections (projections 1, 5, 9…, 117) with a matrix size of 128 × 128, which was concatenated to generate a cubic matrix of 128 × 128 × 128. In this preprocessing step, the voxel values were normalized to be within the range 0–2. The input image was convolved and down-sampled in the encoder part, which consisted of a series of convolutional layers with 3 × 3 × 3 kernels followed by a rectified-linear-unit activation function. Down-sampling was performed with maximal pooling layers with stride 2. After each down-sampling step, the feature channels were doubled.

Schematic illustration of CUSIP. Numbers indicate image size and number of features at each layer. Concat. = concatenate; Conv. = convolution; ReLU = rectified linear unit.
As with the encoder, the decoder consisted of a series of convolution layers followed by a rectified-linear-unit activation function. For up-sampling, the decoder unit used transposed convolutional layers with stride 1 followed by a rectified-linear-unit activation function. The number of feature channels was halved after each up-sampling step.
Three different CUSIPs were trained to yield the following 3 SIP sets: projections 2, 6, 10…118; projections 3, 7, 11…119; and projections 4, 8, 12…120. These projection sets were cropped from the 128 × 128 × 128 matrix output images.
Training and Optimization
The 3 CUSIPs were trained by minimizing the root-mean-square error loss function between the difference in the network-generated SIPs and the input projections. The Adam optimizer with a momentum of 0.05 and a linearly decreasing learning rate from 0.000012 to 0.000008 was used to minimize the loss function. Each CUSIP was trained using 352 input images (352 × 30 projections) and validated using 37 input images (37 × 30 projections). The training used 177Lu and 111In images, whereas validation only used 177Lu images. The network was trained for 200 epochs with a mini-batch of 1 input image. To evaluate the network, we used a test set of SPECT/CT raw data from 15 patients treated with 177Lu-DOTATATE together with SPECT/CT raw data from a phantom study.
SPECT Reconstructions
SPECT images for quality evaluation were reconstructed for 3 sets of projections: the 120 acquired projections (120), 30 projections using every fourth projection of the 120 (30), and 120 projections derived from 90 (3 × 30) SIPs generated from 30 projections using the 3 CUSIPs (30–120SIPs).
The SPECT/CT reconstructions were performed using 2 OSEM reconstruction algorithms with 6 subsets and 10 iterations. The first was an AC-OSEM with gaussian postfiltering (SD of 4 mm). In the second algorithm, the Sahlgrenska Academy Reconstruction code was used for attenuation, scatter, and ASCC-OSEM reconstruction (9). The code relies on Monte Carlo simulations. The forward projections included simulation of photon attenuation, scattering, and collimator resolution with septal penetration. The scattering in the collimator is approximated with an experimentally determined photon-scattering kernel. The backward projections include collimator resolution with septal penetration. In contrast to AC-OSEM, no postfiltering was applied because the back-projector reduces noise.
Phantom Measurements
The Jaszczak SPECT phantom with sphere inserts, with a 25:1 sphere-to-background activity concentration ratio, was used to assess image quality. The phantom and the performed measurements are further described in the supplemental materials (available at http://jnm.snmjournals.org).
Quantitative Image Quality Evaluation of Patient Images
We used the peak SNR (PSNR; Supplemental Eq. 1), root-mean-square error (RMSE; Supplemental Eq. 2), and structural similarity (SSIM) index metrics (Supplemental Eq. 3) to evaluate the image quality of the SIPs and the reconstructed SPECT images for the test set of 15 patients (26). These measures give an estimate of image quality compared with a reference image—in this case, a reconstruction of all acquired 120 projections. We also performed this analysis on ASCC-OSEM 30 images that were postfiltered with a gaussian filter, SD of 4 mm.
Visual Evaluation of Image Quality
An experienced nuclear medicine physician (16 working years) visually evaluated the reconstructed SPECT/CT images of the test set, consisting of 177Lu-DOTATATE SPECT images from 15 patients. The physician scored the image quality for each patient examination by ranking the 6 reconstructed images, that is, AC-OSEM 30 projections, AC-OSEM 30–120SIPs, AC-OSEM 120 projections, ASCC-OSEM 30 projections, ASCC-OSEM 30–120SIPs, and ASCC-OSEM 120 projections. Categorical values from 1 to 6 were used as scores. A score of 1 was given to the image with the poorest quality, and a score of 6, to the image with the highest quality. For each patient, each of the 6 scores had to be assigned to 1 of the 6 reconstructions; that is, no double entries were possible. In addition, the observer noted whether the noise level was acceptable.
Activity Concentration in the Kidneys
In the test set with 15 patients, the kidney activity concentration was determined by applying a volume of interest over the right and left kidneys in the reconstructed SPECT images. The volumes of interest were manually segmented in the CT images. The volume-of-interest position in the SPECT image was manually adjusted to minimize the effect of mispositioning caused by organ or patient movement between the CT and SPECT acquisitions. The same volume of interest was used for all reconstructions of the same kidney and patient. Activity concentrations determined using 30 projections or 30–120SIPs were compared with activity concentrations determined using the original 120 projections.
Statistics
For quantitative evaluation of SPECT image quality, we analyzed the data using the paired Student t test. Visual image quality was scored with the nonparametric Friedman test, corrected for multiple testing by the honestly-significant-difference procedure of Tukey. Differences between methods were evaluated using the paired Student t test for AC-OSEM and ASCC-OSEM. The statistical tests were performed in MATLAB (MathWorks). A P value less than 0.05 was considered to indicate statistical significance.
RESULTS
Each of the 3 CUSIPs was trained to 200 epochs for which loss of convergence was obtained, that is, the validation loss function had reached its minimum. Visual inspection of the SIPs revealed a slightly smoother appearance than for the acquired projections (Fig. 2). The mean pixel difference between the acquired projections and the SIPs was close to zero (−0.046), and both negative and positive differences were observed. The mean RMSE value was 2.95 (Table 1). The PSNR value was 39.3 dB, and the SSIM value was 0.926, indicating a high SSIM between the acquired projections and the SIPs; the SSIM value for the acquired projections among the 15 patients was 0.846 (SD, 0.014).

Comparison of acquired projections with corresponding SIPs in patients 1–4 from test group. Difference images display pixel value dissimilarities between acquired projections and SIPs. Blue indicates positive pixel values, white indicates no differences, and red indicates negative values. Unit of color bar is counts.
The reconstructed SPECT images of the Jaszczak phantom demonstrated decreased noise with 30–120SIPs compared with 30 projections (Fig. 3). For AC-OSEM, the SNR was clearly improved for 30–120SIPs compared with 30 and 120 projections (Fig. 4). The image quality was higher for ASCC-OSEM than for AC-OSEM (Figs. 3 and 4). For all projection sets, the recovery and SNR for ASCC-OSEM were higher than for AC-OSEM. For ASCC-OSEM, the SNR was 2-fold higher for 120 projections than for 30 projections. By CUSIP interpolation from 30 projections to 30–120SIPs, the SNR was in parity with ASCC-OSEM 120. In Figure 4, we added data for 60 projections and data from a CUSIP that generates 60–120SIPs. The figure indicates that an increasing number of SIPs increases SNR and slightly decreases recovery.

SPECT/CT reconstructions of Jaszczak phantom with 6 hot spheres having 25 times higher 177Lu activity concentration than background. AC-OSEM and ASCC-OSEM used 30 projections, 30–120SIPs, and 120 projections. Unit of color bar is arbitrary voxel values.

Recovery and SNR for 177Lu determined in various hot spheres in Jaszczak phantom for SPECT/CT AC-OSEM (A and C) and ASCC-OSEM (B and D) with 30 projections, 60 projections, 120 projections, 60–120SIPs, and 30–120SIPs.
Figure 5 demonstrates the SPECT image quality with ASCC-OSEM using 30 projections, 30–120SIPs, and 120 projections. The noise level was much higher in the reconstruction with 30 projections. With an increased number of projections, with either 30–120SIPs or 30 projections, the noise level was decreased and a smoother activity distribution was observed. The difference images demonstrate a higher deviation in pixel values between 30 and 120 projections than between 30–120SIPs and 120 projections. RMSE, PSNR, and SSIM were statistically significantly improved between 30 projections and 30–120SIPs, both for AC-OSEM (P < 0.001) and for ASCC-OSEM (P < 0.001) (Table 2). In contrast, RMSE and PSNR tended to be worse for the postfiltered ASCC-OSEM, though not to a statistically significant extent. The SSIM value was high (0.993–0.996) for all ASCC-OSEM reconstructions. The SSIM value for the SPECT images among the 15 patients was 0.962 (SD, 0.0190). A different selection of 30 projections in 30–120SIPs revealed non–statistically different PSNR, RSME, and SSIM values (data not shown), indicating that the method is robust.
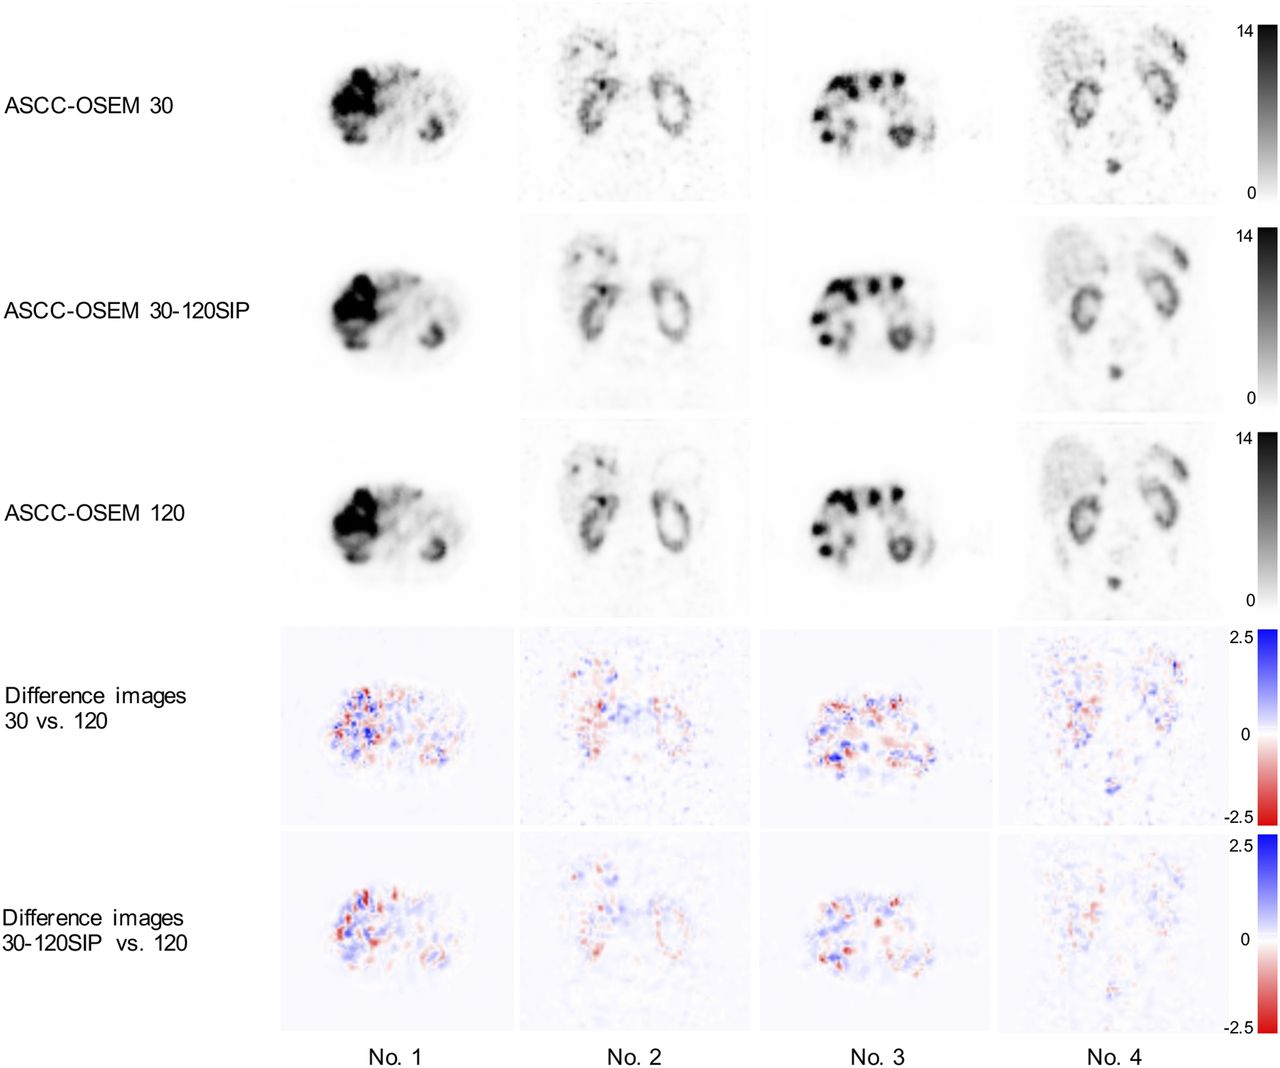
Comparison of ASCC-OSEM with 30 projections, 30–120SIPs, and 120 projections in patients 1–4 of the 15 patients in test set. Difference images display pixel value dissimilarities between ASCC-OSEM 30 projections vs. ASCC-OSEM 120 projections and ASCC-OSEM 30–120SIPs vs. ASCC-OSEM 120 projections. Blue indicates positive pixel values, white indicates no differences, and red indicates negative values. Unit of color bar is arbitrary voxel values.
RMSE, PSNR, and SSIM for SIPs and SPECT Images in Test Group
When ranked by an experienced nuclear medicine physician, ASCC-OSEM drew the highest scores, with all projection sets having higher scores than the highest score for AC-OSEM (Fig. 6). However, when using only 30 projections, the observer judged almost all SPECT images to have unacceptable noise levels, at 13 of 15 for AC-OSEM and 14 of 15 for ASCC-OSEM. When 30–120SIPs or 120 projections were used, almost all reconstructed SPECT images had acceptable noise levels; 1 of 15 for AC-OSEM 120 and 1 of 15 for ASCC-OSEM 30–120SIPs had an unacceptable level.
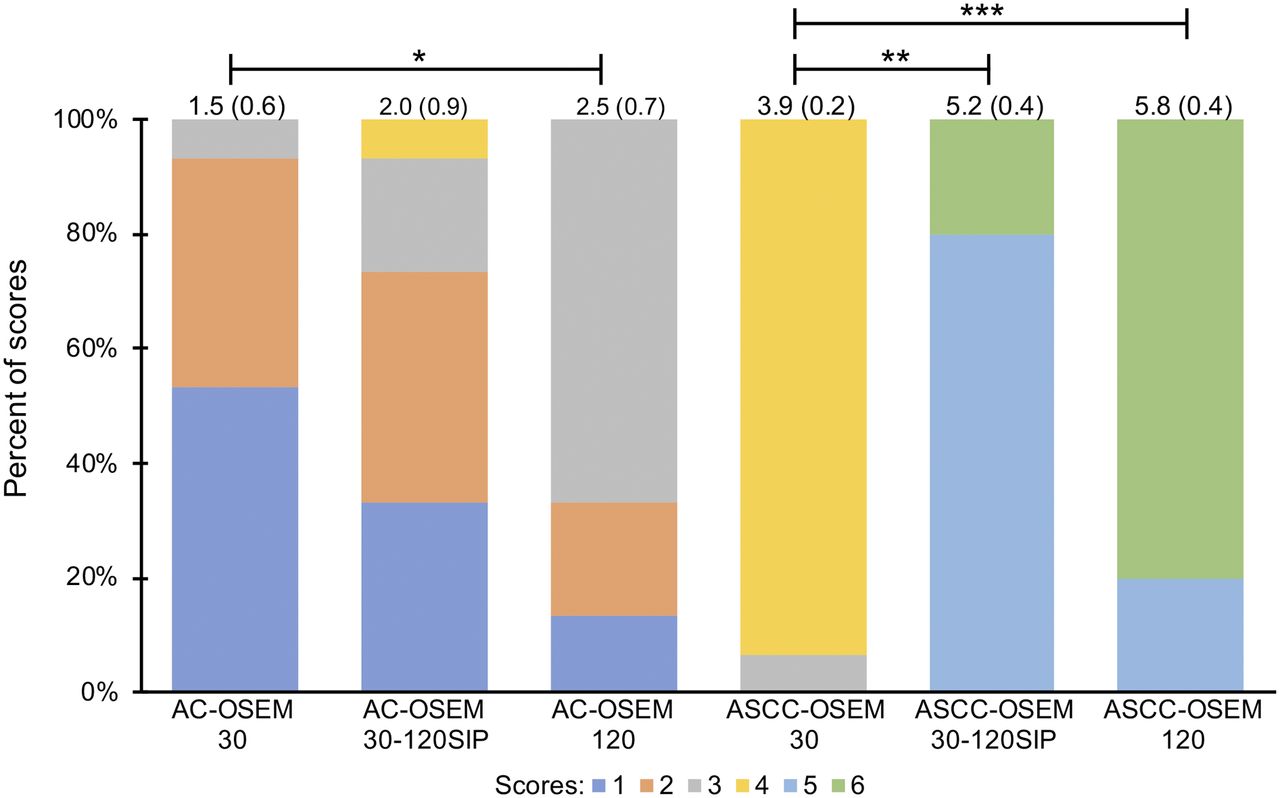
Evaluation scores for SPECT/CT AC-OSEM and ASCC-OSEM. Mean scores and SDs are shown at top of bars. Asterisks indicate statistical significance of scores between projection sets within AC-OSEM and ASCC-OSEM. *0.01 ≤ P < 0.05. **0.001 ≤ P < 0.01. ***P < 0.001.
For ASCC-OSEM, the increased scores for 30–120SIPs and 120 projections were statistically significant. The reconstruction with 30–120SIPs (mean score, 5.2) had parity with 120 projections (mean score, 5.8), with no statistically significant difference.
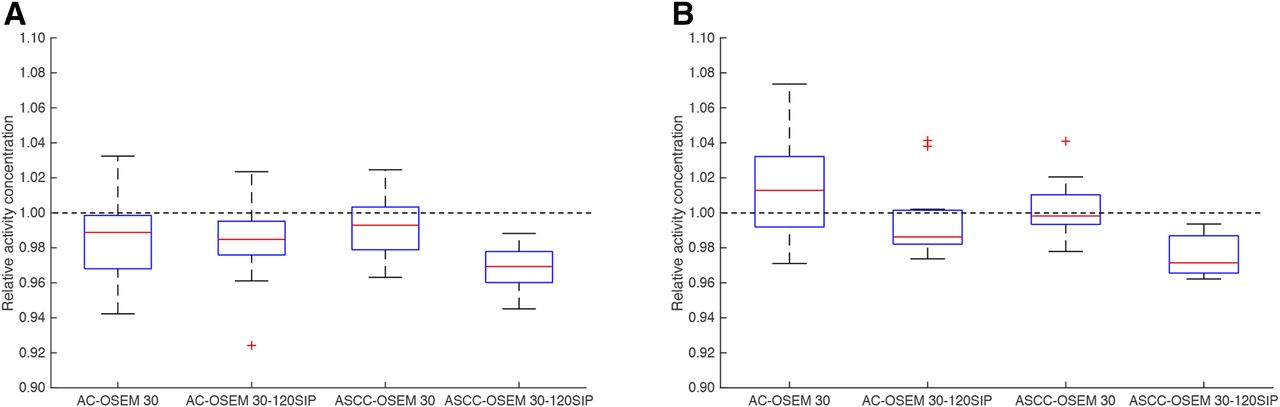
The kidney activity concentration showed small variations among the different reconstruction methods (Fig. 7). ASCC-OSEM 30–120SIPs underestimated the activity concentration slightly (3% for the left kidney and 2.5% for the right kidney) compared with ASCC-OSEM 120 projections. No other statistical differences were observed.

Relative kidney activity concentration for AC-OSEM and ASCC-OSEM with 30 and 30–120SIPs vs. 120 projections. Relative activity concentration was determined in left (A) and right (B) kidneys.
DISCUSSION
The use of artificial intelligence and, especially, the field of deep learning are expanding. For γ-camera imaging, the number of publications is still limited, whereas PET findings are more widely described. One of the most frequently reported topics is the generation of synthetic attenuation maps for attenuation correction of PET images (27). We adopted a convolutional neural network similar to that in these studies, that is, a U-net structure in which the input images of the sparse intermediate projections are down-sampled and up-sampled to obtain the SIPs. The generated SIPs had less noise than the original data and a high SSIM with the original projections, as measured by the SSIM index. Inserting these SIPs into the reconstruction revealed better image quality than reconstructions of the sparse projection datasets, and the noise level, especially, was substantially reduced. As a comparison, we also filtered the SPECT images generated with 30 projections and obtained smoother images but no gain in RMSE or PSNR, as was also the case with the addition of SIPs. The advantage of SIPs over postfiltering is that counts are added into the reconstruction. Thereby, the use of SIPs might be an alternative way of filtering SPECT images; this possibility needs to be studied further.
We added 111In-octreotide SPECT images to increase the training set by 25%. Similar cameras and collimators were used in these investigations. The slightly higher emitted photon energy from 111In (245 vs. 208 keV) causes a slightly poorer resolution and might therefore have contributed to reduced recovery for OSEM reconstruction with SIPs compared with the full set of projections. However, the addition of 111In images reduced the loss in both training and validation, indicating a benefit from increasing the training set with 111In images. This subject will be further explored in upcoming studies focused on improving 111In imaging with CUSIPs.
The γ-cameras had a crystal thickness of ⅝ in and used body contour orbits. These camera-specific parameters might also influence the CUSIP performance when applied to projections from other cameras. In this study, we did not have data for such an extended analysis. As with all artificial intelligence development, the limited amount of data is problematic. Nevertheless, with research sites having other cameras, we intend to study this issue further.
In this study, we used 2 reconstruction protocols: a low-resolution OSEM protocol with AC-OSEM and a high-resolution OSEM protocol with ASCC-OSEM. With AC-OSEM for 177Lu-DOTATATE, a dose–response relationship for pancreatic tumors has been described, as well as dosimetry for various organs, such as the kidneys (13,14,28). Our results demonstrate that it should be feasible to reduce the number of projections and add SIPs to obtain SPECT image quality similar to that with the full set of projections. There was a slight decrease in recovery in the phantom measurements, as could explain the slightly decreased estimate of kidney activity concentration. This decrease is probably the result of the inherent poor resolution in AC-OSEM rather than the result of the minor resolution loss when applying 30–120SIPs. When we applied the high-resolution method, ASCC-OSEM, we saw a similar increase in image quality but with a more pronounced loss in recovery. The kidney activity concentration decreased by about 2% compared with the full set of projections. Despite the higher resolution of ASCC-OSEM, however, the typical resolution recovery for a kidney is about 85%, indicating that a similar degree of adjustment needs to be performed in OSEM reconstruction with 120 projections or 30–120SIPs (29).
For both reconstruction methods, the variation in estimated kidney activity concentration decreased for OSEM 30–120SIPs compared with 30 projections. The observer also noted that reconstruction with 30 projections was too noisy for clinical interpretation. With a high noise level in the image, reporting on the response or regrowth of small disseminate tumors would be challenging. Nevertheless, the overall score for ASCC-OSEM 30 projections was higher than for AC-OSEM 30–120SIPs or AC-OSEM 120 projections, which were judged to have acceptable noise levels. This contradiction is probably due to the scoring system, which forced the observer to use all scores for a patient. This system might result in inaccuracy from incorporating the negative influence of a high noise level in the overall score, thereby indicating better image quality for ASCC-OSEM 30 projections than AC-OSEM 120 projections.
For ASCC-OSEM, we used Monte Carlo–based reconstruction. The benefit with this approach is that attenuation, scatter, and collimator–detector response are corrected simultaneously in the forward projection, which seems to generate images that might be slightly improved or in parity with the compensation methods applied by different vendors (9–11). Despite the possible improvements that can be obtained with Monte Carlo–based reconstruction, results similar to those presented here for 30–120SIPs will most probably hold true for all other OSEM methodologies with robust ASCC.
CONCLUSION
In the present study, we demonstrated that SPECT image quality, as measured by RMSE, PSNR, SNR, and SSIM, can be improved by adding SIPs to sparsely sampled projections. The visual inspection revealed that SPECT images generated with sparsely collected projections had unacceptable image quality, whereas the SPECT/CT reconstruction with 30–120SIPs had an image quality similar to that of the full set of projections. This similarity enables the use of SIPs to reduce acquisition time in clinical protocols, as is beneficial for patient comfort and minimizes the risk of patient movement during image acquisition. Additionally, a reduced acquisition time enhances the possibility of adding acquisition time points or increasing the number of bed positions with each time point in full clinical schedules—advantages that can be important for improving the accuracy of the pharmacokinetics in the dosimetry protocol.
DISCLOSURE
This work was supported by the Swedish Cancer Society, Swedish Radiation Safety Authority, King Gustav V Jubilee Clinic Cancer Research Foundation, Swedish Research Council, and Swedish State under an agreement between the Swedish government and the county councils (the ALF agreement). No other potential conflict of interest relevant to this article was reported.
KEY POINTS
QUESTION: Can SPECT acquisitions be shortened without image degradation by adding deep-learning–generated SIPs?
PERTINENT FINDINGS: The results of this cohort study of 15 patients treated with 177Lu-DOTATATE show that the SPECT acquisition time can be reduced by a factor of 4 while still yielding image quality similar to that for a full set of 120 projections.
IMPLICATIONS FOR PATIENT CARE: Reducing the SPECT acquisition time will improve patient comfort during investigations, reduce the risk of image artifacts from patient movement, and allow for an increase in the number of measurement time points after injection of 177Lu-radiopharmaceuticals for improved pharmacokinetic description and patient dosimetry.
Footnotes
Published online Aug. 28, 2020.
- © 2021 by the Society of Nuclear Medicine and Molecular Imaging.
REFERENCES
- Received for publication March 19, 2020.
- Accepted for publication July 20, 2020.


Jump to section
Related Articles
Cited By...
- Impact of the Reference Multiple-Time-Point Dosimetry Protocol on the Validity of Single-Time-Point Dosimetry for [177Lu]Lu-PSMA-I&T Therapy
- A Deep-Learning-Based Partial-Volume Correction Method for Quantitative 177Lu SPECT/CT Imaging
- A Pipeline for Automated Voxel Dosimetry: Application in Patients with Multi-SPECT/CT Imaging After 177Lu-Peptide Receptor Radionuclide Therapy
- Dosimetry for Radiopharmaceutical Therapy: The European Perspective