


Abstract
Quantitative SPECT/CT imaging forms the basis for internal dosimetry in molecular radiotherapies. While the conversion from counts to activity is typically based on conversion factors individually measured by each site, a recently introduced commercially available reconstruction (xSPECT Quant) offers a standardized and traceable calibration of SPECT/CT systems. The aim of this work was to assess the characteristics of xSPECT Quant in combination with 177Lu as one of the most important radionuclides used in molecular radiotherapies and to compare it to a widely used ordered-subset expectation-maximization reconstruction (Flash3D). Methods: In a series of 177Lu-filled phantom measurements, several important features were investigated for xSPECT Quant and Flash3D. Noise behavior and accuracy of the activity determination were evaluated in a large cylinder. Recovery coefficients were assessed in a hot-sphere phantom with and without background. Additionally, the resolutions were determined in a line source phantom as well as in a matched-filter resolution analysis of the hot-sphere–cold-background phantom. Results: Both reconstruction algorithms improve the spatial resolution at the cost of noise build-up. Despite its slower convergence, Flash3D features a more efficient recovery. Although resolution recovery methods are applied within both reconstructions, partial-volume errors—namely activity overestimation in the object center and spill-out of counts from the object edges—remain of relevance. In contrast to Flash3D, for which only the total number of updates (iterations × subsets) plays a role, the exact subdivision into iterations and subsets affected all characteristics of xSPECT Quant (optimum, 1 subset). The optimal trade-off between noise build-up and resolution improvement was found for 48 iterations and 1 subset, resulting in a quantitative accuracy of 1.2% in the Jaszczak cylinder (xSPECT Quant cross-calibrated to the dose calibrator). Conclusion: If the reconstruction parameters are chosen with care, both examined reconstructions can provide absolute quantitative SPECT images with high image quality (subcentimeter resolution at an acceptable noise build-up) as well as high quantitative accuracy (given a well-calibrated Flash3D conversion from counts to activity concentration). With its standardized (and traceable) activity determination, xSPECT Quant dispenses with site-specific calibration protocols, enabling a reliable activity determination comparable across sites, which is especially useful for multicentric molecular radiotherapy studies.
- image reconstruction
- radiobiology/dosimetry
- SPECT/CT
- calibration
- ordered-subset conjugate gradient minimization (OSCGM)
- quantitative Lu-177 SPECT
Molecular radiotherapies are systemic therapies in which radionuclides or radiopharmaceuticals are administered to the patient. For many years, molecular radiotherapies have been performed with little or no consideration of patient-specific dosimetry or, if so, mainly at an organ level (1,2). Patient-specific dosimetry is, however, essential for a risk estimation before any treatment as well as for an assessment of the safety and efficacy of a treatment (2). Besides the energy deposition patterns of the administered radionuclide in the patient, information about the time course of the activity distribution is needed for reliable dosimetry calculations. To obtain this information, sequential quantitative SPECT/CT, PET/CT, or planar imaging is typically performed after the administration of the radiopharmaceutical (1). On the basis of these data, time-integrated activity coefficients in any volume of interest (VOI) are derived.
Although, in principle, SPECT/CT imaging offers the possibility of organ-based activity quantification, a large number of potential error sources have to be addressed before an accuracy adequate for standardized dosimetry calculations can be achieved (3,4). Most correction methods (e.g., attenuation correction, scatter correction, compensation for detector response, dead-time correction) are site-independent and should ideally be included in the reconstruction algorithm by the manufacturers. In contrast, the calibration of each SPECT/CT system (i.e., the conversion from count rate to activity concentration) is camera-dependent. In this case, a system-specific conversion factor (cf) has to be individually determined by each site (5,6). Additionally, partial-volume errors represent a large source of error in SPECT/CT-based activity quantification (7): image enhancement techniques seek to recover the resolution directly from the emission data (8–10). In contrast, image-domain correction techniques try to restore spilled-out counts on the basis of anatomic information or predetermined experimental findings, such as by multiplication with a spheric recovery coefficient (11,12) or more organ-specific correction factors obtained in anthropomorphic, 3-dimensional (3D) printed phantoms (13–15). Although many efforts have been made to standardize quantitative SPECT/CT imaging (5,6,16,17), the lack of a widely accepted and routinely applied standardization still impedes a comparison of quantitative SPECT/CT acquisitions across different clinical centers and different manufacturers. This, in turn, obstructs the conduction of multicentric or longitudinal studies for validating and optimizing the therapeutic use of new radiopharmaceuticals (18).
The use of a National Institute of Standards and Technology (NIST) traceable calibration source (75Se) with a 3% uncertainty (99% confidence level) was recently introduced by Siemens Healthineers for medium-energy radionuclides (123I, 111In, 177Lu) to enable standardization of quantitative SPECT (19,20). In this new approach (xSPECT Quant), the reconstruction converts the number of counts in each voxel into activity concentration (Bq/mL) using the measured point-spread function for the respective collimator class standard and energy window setting (site-independent) in combination with a system-specific sensitivity correction factor measured with a site-specific 75Se point source. A cross-calibration to site-specific dose calibrators is supported by the software. As in PET imaging, the reconstructed images are provided in units of Bq/mL.
xSPECT Quant uses a preconditioned ordered-subset conjugate gradient minimization of the Mighell modified χ2 objective function (20,21), with noise and convergence properties different from the commonly applied expectation-maximization optimization methods (22–24).
In this work, a series of 177Lu-filled phantom measurements was performed to examine the influence of iterations and subsets on the accuracy in activity determination, the noise build-up, the resolution improvement, and the reduction of partial-volume effects (improvement of recovery coefficients). The results were compared with the results of an ordered-subset expectation maximization–based reconstruction (Flash3D). Conclusively, recommendations on the optimal combination of iterations and subsets are derived to facilitate the configuration of xSPECT Quant for 177Lu SPECT/CT in molecular radiotherapies.
MATERIALS AND METHODS
Quantitative SPECT/CT Imaging
All acquisitions were performed with a Symbia Intevo Bold SPECT/CT system (Siemens Healthineers) with 9.5-mm crystal thickness, medium-energy low-penetration collimator, 180° configuration, auto-contouring, continuous mode, 60 views, 30 s per view, 256 × 256 matrix, and 3 energy windows (20% around the main photopeak of 208 keV with 2 adjacent 10% windows). Subsequent to the SPECT acquisition, a low-dose CT scan was acquired for attenuation correction (130 kVp, 512 × 512 × 131 matrix, 1.0 × 1.0 × 3.0 mm resolution).
Three phantom experiments were performed. The first used a large Jaszczak cylinder without inserts (diameter, 21.6 cm; height, 18.6 cm; volume, 6.8 L; activity concentration, 73.5 kBq/mL; total counts, 8.0 million) (25). The second used a water-filled body phantom (National Electrical Manufacturers Association [NEMA]-NU2-2012; PTW-Freiburg) equipped with 6 177Lu-filled spheres (diameters, 10/13/17/22/28/37 mm; activity concentration, 1.31 MBq/mL; total counts, 4.2 million). After the cold-background measurement, 177Lu was added to the background and all acquisitions were repeated (total counts, 21.1 million). Subsequent to these acquisitions, 1-mL aliquots of the sphere and the background solutions were measured in the high-purity germanium detector, yielding a sphere-to-background activity ratio of 10.1:1.0.
The third phantom experiment used a water-filled head phantom (IEC-61675-2; PTW-Freiburg) equipped with 2 177Lu-filled line sources (diameter, 1 mm; length, 17.5 cm; total activity, ∼300 MBq; average total counts, 7.4 million) placed in the center and 9 cm off-center. The phantom was rotated between 4 subsequent acquisitions to measure the transaxial resolution at the center and at the 12 (anterior), 3 (right), 6 (posterior), and 9 o’clock positions (left).
Reconstructions were performed with the following 2 algorithms, applied without and with 16-mm 3D Gaussian postfiltering (one of the most frequent postfilters applied within the manufacturer’s reconstruction presets), with varying combinations of iterations and subsets (e.g., 48i1s = 48 iterations, 1 subset).
The first reconstruction algorithm was Flash3D; that is, ordered-subset expectation maximization with depth-dependent 3D resolution recovery (Gaussian point-spread function model), attenuation correction, and scatter correction. Reconstructions were performed with a 128 × 128 matrix as recommended by the manufacturer (voxel size, 4.8 mm). For quantitative imaging, a count-to-activity cf (cps/MBq) was calculated manually (4,26).
The second reconstruction algorithm was xSPECT Quant; that is, ordered-subset conjugate gradient minimization with depth-dependent 3D resolution recovery using a measured point-spread function, attenuation correction, additive data-driven scatter correction in forward projection, and decay correction. As recommended by the manufacturer, a 256 × 256 matrix was used for the reconstruction (voxel size, 2.0 mm). For simplicity, xSPECT Quant will be called xSPECT.
Attenuation and scatter correction were applied according to the manufacturer-suggested settings. Activities were determined using a VDC-405 dose calibrator with a VIK-202 ionization chamber (Comecer SpA), cross-calibrated to a high-purity germanium detector (Canberra Industries Inc.) whose energy-dependent efficiency was calibrated with several NIST and National Physical Laboratory–traceable standards over the energy range considered. All xSPECT-based activities were cross-calibrated to this dose calibrator by applying a premeasured cross-calibration factor of ADoseCalibrator/ANIST = 1.025 (ADoseCalibrator is dose calibrator activity and ANIST is xSPECT-based activity). Activity concentrations were based on weight. To ensure a homogeneous distribution of the radionuclides, 177Lu-chloride was dissolved in 0.1 M HCl with 100 ppm of stable lutetium for all measurements. Postprocessing was performed in MATLAB R2016b (The MathWorks) and MI Applications VA60C (Siemens Healthineers).
cf and Accuracy
The Jaszczak data were used to determine the Flash3D cf and assess the accuracy of the xSPECT-based activity determination. First, cf was determined on the basis of total number of counts in a cylindric VOIoutside containing the entire phantom (diameter, 23.6 cm; height, 20.6 cm; volume, 9.0 L): Eq. 1
Eq. 1
The same VOI was used to obtain the activity based on xSPECT (Bq/mL in VOIoutside × volume). Additionally, a cylindric VOIinside (diameter, 14.5 cm; height, 12.5 cm; volume, 2.1 L) was drawn inside the phantom to assess the accuracy of the xSPECT-based activity concentration (Bq/mL in VOIinside).
Update Dependency of Noise
The Jaszczak data were used to assess the noise build-up of both reconstruction algorithms as a function of updates (iterations × subsets). For this purpose, the noise coefficient of variation was calculated as the ratio between SD and mean of VOIinside. To account for variations inside the phantom, the VOI was shifted across 5 voxels in all dimensions, and the average of the resulting 125 values of noise coefficient of variation was taken.
Sphere-Based Recovery Coefficients
To assess the update-dependent influence of partial-volume errors on the activity determination, recovery coefficients were calculated on the basis of the sphere phantom data: first, a set of spheric VOIs was manually drawn (diameters based on the phantom specifications, CT-based positioning), and the SPECT-based activity ASPECT inside these VOIs was determined. Subsequently, recovery coefficients were calculated on the basis of the nominal activity ADoseCalibrator in each sphere (11): Eq. 2
Eq. 2
Line Source Resolution Analysis
The spatial resolution was investigated on the basis of the line source data. After interpolating the reconstructed SPECT volumes by a factor of 10 (grid sizes, 0.48/0.20 mm [Flash3D/xSPECT]), the sagittal and coronal full width at half maximum was first extracted for all available slices. By averaging over the central approximately 12 cm of slices containing the line phantom, over sagittal and coronal resolutions, and over all 4 rotated acquisitions, center and off-center resolution values were obtained.
Matched-Filter Resolution Analysis
A matched-filter resolution analysis of the sphere phantom data was performed as follows (27,28). First, a digital version of the phantom was derived by CT-based thresholding. Next, SPECT-based resolution loss was simulated by convolution with 3D Gaussian kernels of different full widths at half maximum. After resampling to SPECT matrix size, the minimum root-mean-squared errors between the reconstructed and the simulated volumes were calculated to find a resolution estimate. While the mask’s background was set to zero for the hot-sphere–cold-background experiment, the background activity was adjusted to achieve the predetermined sphere-to-background ratio of 10.1:1.0 in the hot-sphere–hot-background case.
RESULTS
Update Dependency of the Quantitative Accuracy
The update dependency and the effect of postfiltering are illustrated in Figure 1 by cross-sections through the Jaszczak phantom. Additionally, example Flash3D cf values as well as xSPECT-based activities ASPECT (VOIoutside) and activity concentrations CSPECT (VOIinside) are given in Tables 1 and 2 (the uncertainty of ASPECT was estimated on the basis of a Poisson distribution  ).
).

Cross-sections through the reconstructed Jaszczak phantom for different update numbers and postfilters. Orange arrows: spill-out occurring for Flash3D. Magenta arrows: suppression of spill-out by xSPECT.
Flash3D Conversion Factor
xSPECT Activity ASPECT (VOIoutside) and Concentration CSPECT (VOIinside)
On the one hand, the contours of the initially blurred edges are sharpened by more updates, reducing spill-out for VOIoutside. This is underlined by the cf values (Table 1), where the spill-out initially leads to an approximately 7% lower cf (6i1s), which is improved by more updates (>48i1s).
On the other hand, a growing number of updates results in an increasing noise build-up and pronounced Gibbs ringing. cf (Flash3D) and ASPECT (xSPECT), however, are nearly unaffected by the high noise (Tables 1 and 2).
While the noise inside the phantom is considerably reduced by the postprocessing filter (Figs. 1C and 1D), it reintroduces blurring to the edges, leading to spill-out of counts from VOIoutside for Flash3D. In contrast, this effect does not occur for xSPECT. While no systematic changes are introduced by the postprocessing filter for cf (Flash3D + VOIoutside) and CSPECT (xSPECT + VOIinside), the 1%–2% difference in ASPECT (xSPECT + VOIoutside) is systematically increased to 3%–4%.
Update Dependency of the Noise Build-up
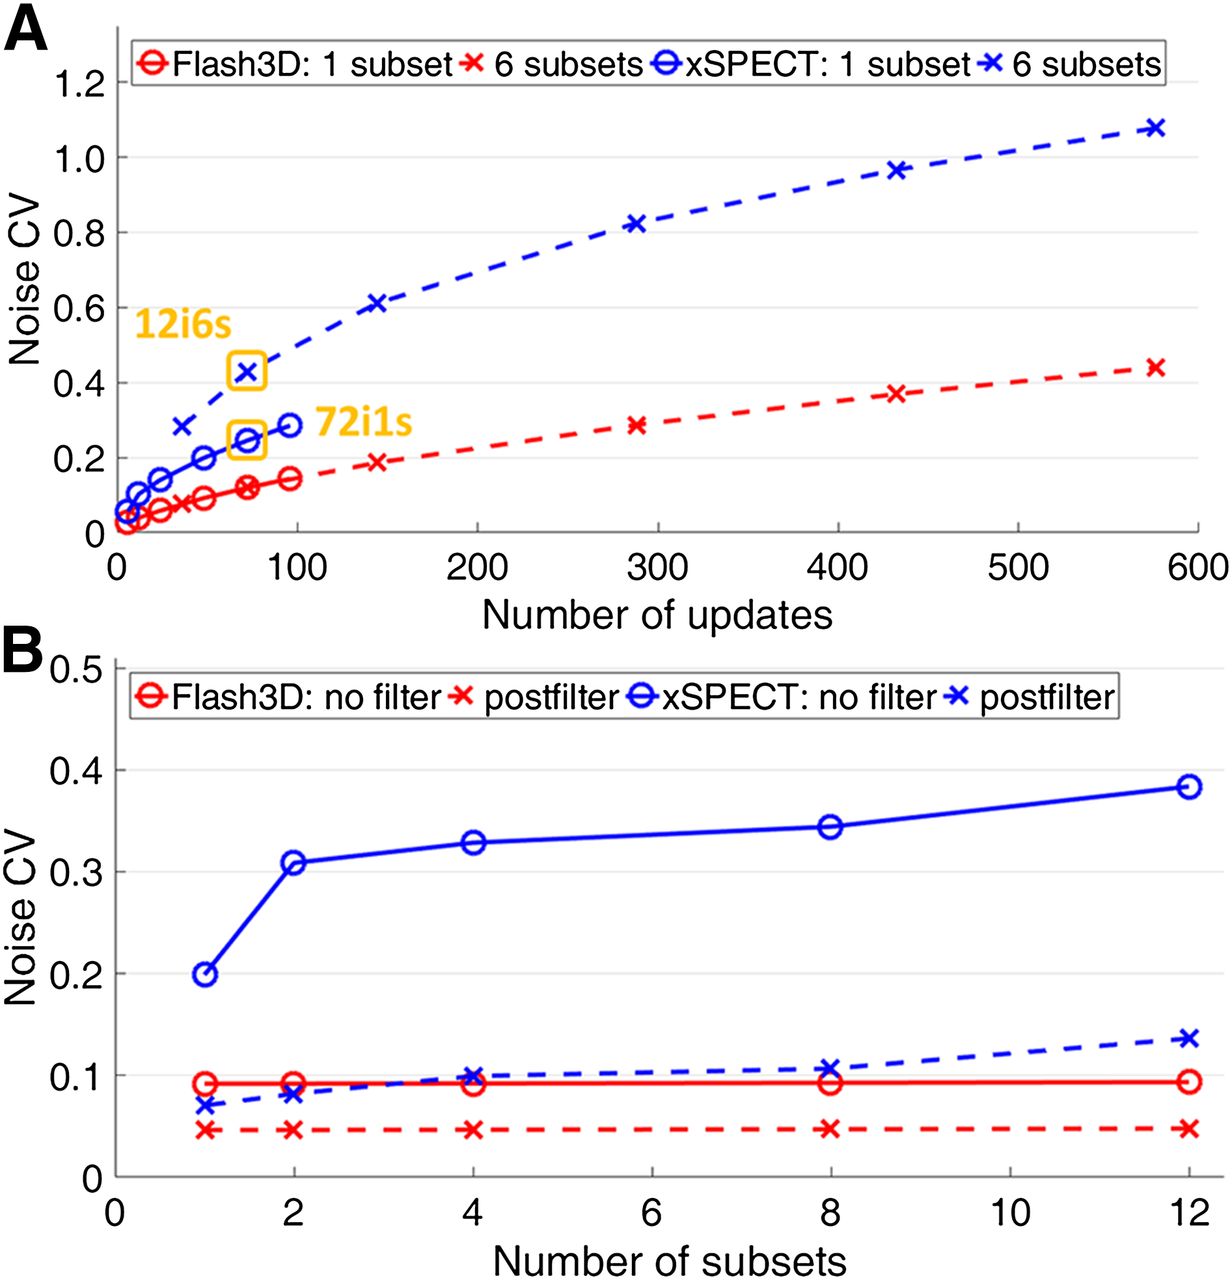
The update-dependent noise build-up inside the Jaszczak phantom is shown in Figure 2A. Two observations can be made. The first is that while the noise build-up is independent of the number of subsets for Flash3D, a clear subset dependency (e.g., a factor of 1.75 between 72i1s and 12i6s) is visible for xSPECT. The second is that xSPECT features a faster noise build-up than Flash3D. This is underlined by an average factor of 2.2 between the noise coefficient of variation of Flash3D and xSPECT for 1 subset, which increases to 3.1 for 6 subsets.

Update (A) and subset (B) dependency of the noise coefficient of variation for Flash3D and xSPECT. The proportion between the blue and red curves indicates the differences in noise build-up. The orange boxes illustrate the subset dependency of xSPECT (12i6s vs. 72i1s).
Subset Dependency of xSPECT
To further illustrate the subset dependency of xSPECT, Figure 2B plots the number of subsets against the noise coefficient of variation inside the Jaszczak phantom for a fixed number of 48 updates. While the noise is subset-independent in Flash3D (9% average), the noise build-up increases with the number of subsets in xSPECT (20%→38% increase). While the noise is considerably reduced by the postfiltering (average of 2.0/3.2-fold for Flash3D/xSPECT), the subset dependency of xSPECT is preserved (5% average for Flash3D vs. 7%→14% increase for xSPECT).
This subset dependency is further visualized by Figure 3 (constant update number): although the cross-sections remain unchanged for Flash3D (Figs. 3A and 3C), a subset-dependent noise increase can be seen for xSPECT (Fig. 3B). Although the noise is considerably reduced by the postprocessing filter, the subset dependency of xSPECT is preserved (Fig. 3D). Again, the spill-out introduced by the postfiltering for Flash3D does not occur for xSPECT.

Cross-sections through the reconstructed Jaszczak phantom for different iteration-subset combinations and postfilters.
Sphere-Based Recovery Coefficients
Although the results will not be explicitly given here, a subset dependency was again found only for xSPECT. Therefore, the number of subsets was kept at 1 throughout the following recovery coefficient analysis.
The volume-dependent recovery coefficients are shown in Figure 4A. For clarity, only the reconstructions with 48i1s are plotted. Without filter and background, the recovery of Flash3D exceeds xSPECT by an average factor of about 1.2. Although both reconstructions start with a recovery coefficient of about 0.2 for the smallest sphere (0.6 mL), Flash3D features a considerably faster recovery (e.g., a recovery coefficient of 0.7 is reached for the 2.8 mL/11.4 mL sphere for Flash3D/xSPECT). Both recoveries are considerably deteriorated in the presence of background.

(A) Volume dependency of the recovery coefficient for 48i1s. (B) Update dependency of the recovery coefficient on the example of the largest sphere (number of updates: 1 subset × different numbers of iterations).
To visualize the update dependency of the recovery coefficients, recovery coefficients of the largest sphere (diameter, 37 mm; volume, 26.5 mL) for different iterations and 1 subset are shown in Figure 4B. Again, it can be seen that Flash3D converges toward a higher recovery coefficient (without/with background, 0.89/0.83) than xSPECT (0.82/0.79). Although an average improvement of 89% is reached between iterations 6 and 48, only a negligible further improvement of 8% is reached between 48 and 96 iterations.
To visualize the impact of update number and background on the reconstructions, Figure 5 shows cross-sections through the largest sphere for different update numbers. Without background, the activity concentration outside the sphere goes down to zero for both reconstructions. While the reconstructed background concentration reaches the nominal value on both sides of the sphere for Flash3D, it becomes strongly asymmetric for xSPECT.

Example images of the NEMA sphere reconstructions (left) and cross-sections through the largest sphere (center and right) for different iteration numbers. The orange boxes indicate the nominal activity concentrations in the sphere (dashed) and the background (solid).
Additionally, the background has a large influence on the updates needed to recover the resolution: without background, a maximum is reached after 24 updates (Flash3D) and 72 updates (xSPECT); the concentration starts to deteriorate with an increasing number of updates. With background, however, the resolution of both reconstructions is still under improvement after 96 updates.
To illustrate the distribution of activity inside the sphere VOIs, the activity concentrations in the hottest milliliter (∼9/134 voxels for Flash3D/xSPECT) of the largest sphere are given in Table 3. Although the concentration without background is close to the nominal value of 1.31 MBq/mL at the start of the reconstruction (e.g., 6i1s), it is increasingly overestimated with more iterations. In contrast, the initial values considerably underestimate the nominal concentration after the addition of background activity (−24%/−61% for xSPECT/Flash3D). Similar to the nonbackground case, an overestimation occurs after several iterations.
Activity Concentration in Hottest Milliliter of Largest Sphere for Different Iterations and 1 Subset
Resolution Analysis
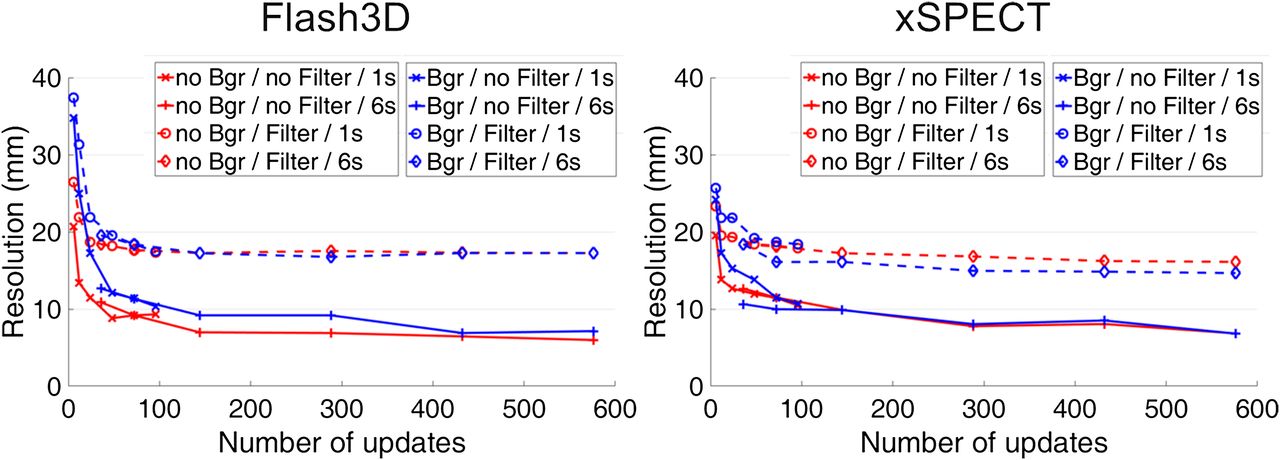
Figure 6 shows the matched-filter resolutions plotted against the number of updates. Generally, postfiltering leads to a considerable decrease in resolution (average, 1.87/1.65-fold for Flash3D/xSPECT). Differences between hot/cold background resolutions occur only in the unfiltered Flash3D and in the filtered xSPECT case.

Update dependency of the matched-filter resolution for 1 and 6 subsets. Filter = 16-mm Gaussian postprocessing filter.
All resolutions are additionally listed in Table 4. For clarity, postfiltering and background are not listed. For all reconstructions, the spatial resolution is considerably improved by an increasing number of updates (average improvement, 17.8→6.6 mm in the analyzed range). This is further illustrated by the average resolution improvement ∆r (ratio of mean resolutions after 6i1s and XiXs) given in the last column. Although the resolution is improved by a factor of 2.0 for 48 updates, it is only further improved to 2.7 for 576 updates. As expected, the off-center line source resolution exceeds the center resolution for both reconstruction methods (average factor of 1.2/1.6 for Flash3D/xSPECT).
Iteration-Dependent Resolutions (mm) and Average Resolution Improvement ∆r (Ratio to 6i1S)
Because Flash3D and xSPECT feature a different convergence behavior, Figure 7 depicts the noise dependency of the resolution. Although only small differences occur between matched-filter and center line source (average, −0.4%/−2.4% for Flash3D/xSPECT), differences are more pronounced between off-center line source and matched-filter (average, −17.1%/37.4% for Flash3D/xSPECT). Although no subset dependency is visible for Flash3D, a clear noise increase can be observed between 1 and 6 subsets for xSPECT.

Noise dependency of the resolution obtained from matched-filter and line-based methods (center: isocenter, off-center: 9-cm distance to isocenter).
DISCUSSION
Our results demonstrate a high quantitative accuracy of xSPECT Quant for 177Lu without the need for an in-house calibration protocol. However, a large number of differences from the widely used ordered-subset expectation maximization–based Flash3D reconstruction became evident, which will be discussed below to facilitate clinical implementation.
Update Dependency of the Quantitative Accuracy
After 6i1s, the resolution of Flash3D is insufficiently recovered, leading to partial-volume effects at the object edges and, therefore, an underestimation of cf (Table 1). This is successfully corrected in the course of the reconstruction (i.e., with more updates). Although Gibbs ringing artifacts and noise become more pronounced, especially at the object edges, the inclusion of all counts spilling out of the Jaszczak phantom (VOIoutside) and the related averaging ensures that cf and ASPECT hold even for large update numbers such as 96i6s. Accordingly, the lowest difference of 1.2% to the dose calibrator was reached for VOIoutside, outperforming the accuracies of previously published quantification approaches (Table 5).
Literature on 177Lu-SPECT/CT–Based Activity Determination
The signal variations across the cross-section in Figure 1 illustrate that the increasing noise build-up eventually plays a larger role for decreasing phantom or VOI sizes. For large phantoms such as the Jaszczak phantom, the concentration-based activity determination with VOIinside (or any other VOI smaller than the phantom volume) becomes increasingly position-dependent. Consequently, the VOIinside-based accuracy was worse than the VOIoutside-based accuracy for all reconstructions (Table 2).
The fact that spill-out is introduced by the postprocessing filter for Flash3D but not for xSPECT (Fig. 1D) can be explained by a CT-based intensity masking that is applied by the manufacturer as a constraint for the spatial distribution of counts within xSPECT. The fact that systematic changes in quantitative accuracy are introduced by the postprocessing filter only for xSPECT in combination with VOIoutside (Table 2) suggests that they originate in the phantom’s edge area and that they might, therefore, also be related to the CT-based masking. Because details about the reconstruction engine are not publicly available, however, this represents only one potential explanation. Further in-depth studies will be needed for a well-founded assessment of this effect.
Update Dependency of the Noise Build-up
As expected, the noise level of both reconstruction methods increases with the number of updates (Fig. 2A). The 2.2/3.1-fold higher noise build-up of xSPECT (1 s/6 s) originates from the faster convergence of the conjugate gradient-based optimization (xSPECT) compared with expectation maximization (Flash3D) (22,23). Because the subdivision of updates into iterations and subsets has no effect on the noise in Flash3D (Figs. 3A and 3C), the number of subsets can be increased to accelerate the reconstruction. In contrast, xSPECT should preferably be performed with only 1 subset to minimize noise (Figs. 2B, 3B, and 3D). Although only one noise level (i.e., the activity concentration inside the Jaszczak phantom) was investigated in this work, the informative value of the noise-versus-resolution curve (Fig. 7) will remain the same for different noise levels. For lower/higher noise levels, the curve would be horizontally compressed/uncompressed toward the lower/higher noise regime, respectively.
Sphere-Based Recovery Coefficients
In general, the recovery coefficients of both reconstruction methods increase with volume and number of updates (Fig. 4). Without background, Flash3D—despite its slower convergence—features a more effective recovery than xSPECT for all volumes and update numbers. Because the largest portion of the maximum recovery is already reached after 48 of the 96 depicted updates (Fig. 4B), the combination 48i1s appears to be a good compromise between resolution recovery and noise build-up.
The addition of background leads to smaller recovery coefficients, which can be explained by a noise-dependent convergence behavior: the background noise reduces the algorithm’s confidence in the reconstruction, in turn leading to an increased number of updates needed to achieve a resolution similar to the background-free case, of course at an increased noise level. While the background activity concentration is reliably restored for Flash3D, it asymmetrically varies around the sphere and even reaches zero at several locations for xSPECT (Fig. 5), potentially leading to errors in the matched-filter resolution analysis.
The hottest-milliliter analysis of both reconstructions (Table 3) shows that, instead of recovering a clear edge separating the constant activity concentration inside the sphere from the background (Fig. 5), the activity is overestimated in the sphere center to compensate for the counts spilled out of the sphere edges. As the recovery coefficients approach the nominal value (which is equal to 1 for ideal imaging conditions), the activity concentrations are overestimated by up to a maximum factor of about 2. Although both reconstruction engines feature resolution recovery methods, partial volume errors—especially spill-out for hot objects—thus remain relevant in any VOI-based quantitative analysis. Particularly, if a voxel-based analysis is to be performed (e.g., in voxel-based dose assessments), dedicated partial-volume correction methods should be applied.
Resolution Analysis
For both reconstruction algorithms, the resolution is considerably improved by an increasing number of updates (Fig. 6). The resolution difference for unfiltered Flash3D with and without background can be explained by the different convergence behavior in the presence of background (Fig. 5). This difference is considerably softened by the postprocessing filter, leaving only negligible differences. In contrast, a difference occurs after postfiltering for xSPECT. As explained in the previous section, this might be caused by the asymmetric background activity, especially in the edge regions, in turn leading to errors in the matched-filter resolution analysis.
Line-based resolution measurements enable the location-dependent assessment of spatial resolution, which is especially useful for SPECT imaging, for which the resolution is dependent on the object–detector distance. These methods were, however, previously reported to potentially introduce systematic errors for iterative reconstructions including distance-dependent resolution corrections (29). Without the need for an in-depth model of the image formation process, matched-filter approaches represent a powerful and reconstruction-independent alternative for SPECT resolution assessments. Because they return an average resolution defined by all transitions between different activity concentrations in the measured field of view, they do not provide sufficient information for a systematic assessment of the spatial resolution. Therefore, a combination of both methods was applied; that is, the line-based method, which assesses the location dependency of the spatial resolution (e.g., differences between centric and off-centric positioning), and the matched-filter method, which validates the magnitude of the line-based resolution values.
The good agreement between the two methods suggests that the line source measurement represents a suitable means for assessing orientation- and position-dependent changes in spatial resolution. The fact that the matched-filter (NEMA sphere phantom) resolutions lie mainly between the 9-cm off-center (better) and center (worse) line source resolutions is explained by the average off-center distance of the NEMA spheres, which was approximately between the two line source positions (<9 cm off-center). Because the matched-filter resolution is independent of the location, a more detailed numeric comparison makes no sense.
Finally, the orange circles in Figure 7 indicate update numbers with an optimal trade-off between resolution recovery and noise-build-up for the matched-filter resolution (∼48/24 updates for Flash3D/xSPECT). For higher update numbers, the noise increase outweighs the resolution improvement. This is in good agreement with the optimal iteration–subset combination of 48i1s determined in the recovery coefficient discussion in the previous section.
CONCLUSION
In this work, the recently introduced xSPECT Quant reconstruction for absolute quantitative SPECT/CT imaging (output, Bq/mL) was compared against the widely used Flash3D reconstruction (output, counts). If the reconstruction parameters are chosen with care, both reconstructions can provide absolute quantitative SPECT images with comparable image quality (noise build-up and resolution recovery) as well as comparable quantitative accuracy (given a well-calibrated Flash3D conversion from counts to activity concentration). The most important advantages of the Flash3D reconstruction are a more effective recovery of the activity (despite the slower convergence) and the fact that subsets can be increased to speed up reconstruction time (no subset dependency). For the conjugate gradient-based xSPECT Quant reconstruction, in contrast, all investigated reconstruction parameters were dependent on the number of subsets (1 subset, least noise). Additionally, xSPECT Quant features a faster convergence (at the cost of a higher noise build-up) and applies a CT-derived reconstruction mask for background noise reduction. Most importantly, however, xSPECT Quant provides a reliable, NIST-traceable quantification with minimal calibration effort, which is independent of the site-specific technical expertise. If adequate partial-volume corrections are applied, xSPECT Quant holds the potential for standardized quantitative SPECT/CT imaging, enabling quantitative imaging and, thus, the calculation of absorbed doses that are comparable across multiple sites. An optional dose calibrator cross-calibration enables each site to directly compare the activities determined by SPECT/CT with injected activities or other liquid patient samples (e.g., urine or blood samples). Therefore, xSPECT Quant represents a major step toward a standardized and traceable absolute quantification in 177Lu SPECT/CT imaging, as is already standard in PET/CT imaging.
DISCLOSURE
This work was partly supported by the European Metrology Programme for Innovation and Research (EMPIR) project 16HLT06 MRTDosimetry (http://mrtdosimetry-empir.eu/). The EMPIR is jointly funded by the EMPIR participating countries within EURAMET and the European Union. No other potential conflict of interest relevant to this article was reported.
Footnotes
Published online Jul. 5, 2018.
- © 2019 by the Society of Nuclear Medicine and Molecular Imaging.
REFERENCES
- Received for publication March 8, 2018.
- Accepted for publication June 14, 2018.


Jump to section
Related Articles
Cited By...
- MIRD Pamphlet No. 32: A MIRD Recovery Coefficient Model for Resolution Characterization and Shape-Specific Partial-Volume Correction
- Dosimetry Software for Theranostic Applications: Current Capabilities and Future Prospects
- A Deep-Learning-Based Partial-Volume Correction Method for Quantitative 177Lu SPECT/CT Imaging
- Radiolabeled Somatostatin Receptor Antagonist Versus Agonist for Peptide Receptor Radionuclide Therapy in Patients with Therapy-Resistant Meningioma: PROMENADE Phase 0 Study
- Lesion Dosimetry for [177Lu]Lu-PSMA-617 Radiopharmaceutical Therapy Combined with Stereotactic Body Radiotherapy in Patients with Oligometastatic Castration-Sensitive Prostate Cancer
- Single-Time-Point Imaging for Dosimetry After [177Lu]Lu-DOTATATE: Accuracy of Existing Methods and Novel Data-Driven Models for Reducing Sensitivity to Time-Point Selection
- PSMA-Directed Imaging and Therapy of Salivary Gland Tumors: A Single-Center Retrospective Study
- A Pipeline for Automated Voxel Dosimetry: Application in Patients with Multi-SPECT/CT Imaging After 177Lu-Peptide Receptor Radionuclide Therapy
- Toward a Patient-Specific Traceable Quantification of SPECT/CT-Based Radiopharmaceutical Distributions
- A Novel Time-Activity Information-Sharing Approach Using Nonlinear Mixed Models for Patient-Specific Dosimetry with Reduced Imaging Time Points: Application in SPECT/CT After 177Lu-DOTATATE
- Deep-Learning Generation of Synthetic Intermediate Projections Improves 177Lu SPECT Images Reconstructed with Sparsely Acquired Projections
- What You See Is Not What You Get: On the Accuracy of Voxel-Based Dosimetry in Molecular Radiotherapy