


Abstract
Improvements in quantitative SPECT/CT have aroused growing interest in voxel-based dosimetry for radionuclide therapies, because it promises visualization of absorbed doses at a voxel level. In this work, SPECT/CT-based voxel-level dosimetry of a 3-dimensional (3D) printed 2-compartment kidney phantom was performed, and the resulting absorbed dose distributions were examined. Additionally, the potential of the PETPVC partial-volume correction tool was investigated. Methods: Both kidney compartments (70% cortex, 30% medulla) were filled with different activity concentrations, and SPECT/CT imaging was performed. The images were reconstructed using varying settings (iterations, subsets, and postfiltering). On the basis of these activity concentration maps, absorbed dose distributions were calculated with precalculated 177Lu voxel S values and an empiric kidney half-life. An additional set of absorbed doses was calculated after applying PETPVC for partial-volume correction of the SPECT reconstructions. Results: SPECT/CT imaging blurs the 2 discrete suborgan absorbed dose values into a continuous distribution. Although this effect is slightly improved by applying more iterations, it is enhanced by additional postfiltering. By applying PETPVC, the absorbed dose values are separated into 2 peaks. Although this leads to a better agreement between SPECT/CT-based and nominal values, considerable discrepancies remain. In contrast to the calculated nominal absorbed doses of 7.8 and 1.6 Gy (in the cortex and medulla, respectively), SPECT/CT-based voxel-level dosimetry resulted in mean absorbed doses of 3.0–6.6 Gy (cortex) and 2.7–5.1 Gy (medulla). PETPVC led to improved ranges of 6.1–8.9 Gy (cortex) and 2.1–5.4 Gy (medulla). Conclusion: Our study showed that 177Lu quantitative SPECT/CT imaging leads to voxel-based dose distributions largely differing from the real organ distribution. SPECT/CT imaging and reconstruction deficiencies might directly translate into unrealistic absorbed dose distributions, thus questioning the reliability of SPECT-based voxel-level dosimetry. Therefore, SPECT/CT reconstructions should be adapted to ensure an accurate quantification of the underlying activity and, therefore, absorbed dose in a volume of interest of the expected object size (e.g., organs, organ substructures, lesions, or voxels). As an example, PETPVC largely improves the match between SPECT/CT-based and nominal dose distributions. In conclusion, the concept of voxel-based dosimetry should be treated with caution. Specifically, one should remember that the absorbed dose distribution is mainly a convolved version of the underlying SPECT reconstruction.
Molecular radiotherapy aims at delivering a lethal radiation dose to a pathologic region (e.g., tumors). Personalized dosimetry would be desirable to maximize therapeutic efficacy by using patient-specific administered doses while avoiding toxicity to healthy organs (e.g., the kidney). In external-beam radiotherapy, the relationship between dose and tumor response or organ toxicity is well understood, and dosimetry has therefore been established in the clinical workflow. Because of the external ionizing radiation source, treatment simulation is performed on the basis of, for example, Monte-Carlo simulations of the energy deposition by photons and electrons emitted from a well-controlled, nearly monoenergetic beam (1).
In contrast, the distribution of a radiopharmaceutical in a patient to be treated with molecular radiotherapy depends on the patient-specific metabolism. Therefore, molecular radiotherapy dosimetry based on quantitative imaging can be performed only after the administration of either a small pretherapeutic quantity of the radiopharmaceutical or after a first treatment cycle or several cycles. The patient scans typically lead to heterogeneous activity distributions quantified either with PET or with SPECT in combination with CT. Because both techniques suffer from considerable degradation caused by noise and resolution limitations (resulting in the so-called partial-volume error), absorbed organ dose distributions derived from these activity distributions suffer from the same insufficiencies, thus greatly limiting the accuracy of dosimetry in molecular radiotherapy.
In external-beam therapy, dose–volume histograms (DVHs) present a valuable tool for treatment planning as well as calculation of tumor control probability and normal-tissue complication probability (2,3). Although, over the past few years, a wide range of tools for an improved determination of voxelized 3-dimensional (3D) internal dose distributions has been proposed (4–9), nuclear medicine imaging–based DVHs suffer from partial-volume errors and can provide only a rough estimate of the underlying radionuclide distribution. Even though partial-volume errors in SPECT/CT imaging can be effectively reduced by selecting an optimized combination of iteration number and postreconstruction filtering, visible residual degradation always remains (2). Nevertheless, DVHs are a helpful tool to visualize and to quantify spatially inhomogeneous absorbed dose distributions.
A large number of different methods of compensating for partial-volume errors have been proposed in the past (10). Most of these partial-volume corrections have been successfully applied and tested in PET/CT imaging (11–13). Although the rather simplistic concept of volume-dependent, predetermined recovery coefficients, which were initially introduced for PET/CT imaging, has been successfully adopted for SPECT/CT imaging (14–16), not many attempts have been made to adopt more sophisticated partial-volume correction methods for SPECT/CT quantification.
To fill this gap, the aim of this work was 2-fold: The first aim was to analyze the influence of SPECT/CT image reconstruction on 3D dose distributions, visualized by DVHs. In contrast to a previous study (2) in which Monte Carlo simulated data were used to assess the quality of the image reconstruction, an inhomogeneous kidney activity distribution was obtained by imaging a 3D-printed 2-compartment kidney filled with different activity concentrations (17) on a clinical SPECT/CT system. Two reconstruction algorithms were investigated: the widely used ordered-subset expectation maximization (here: Flash3D, Siemens Healthineers) and a recently proposed ordered-subset conjugate gradient minimization (xSPECT Quant, Siemens Healthineers). The second aim was to reduce SPECT-inherent residual degradation remaining even for fine-tuned standard SPECT reconstructions by introducing a postreconstruction partial-volume correction. Because of its noncommercial nature and simple user interface, the PETPVC (18) partial-volume correction tool was chosen for that purpose.
MATERIALS AND METHODS
Filling of the 2-Compartment Kidney Phantom
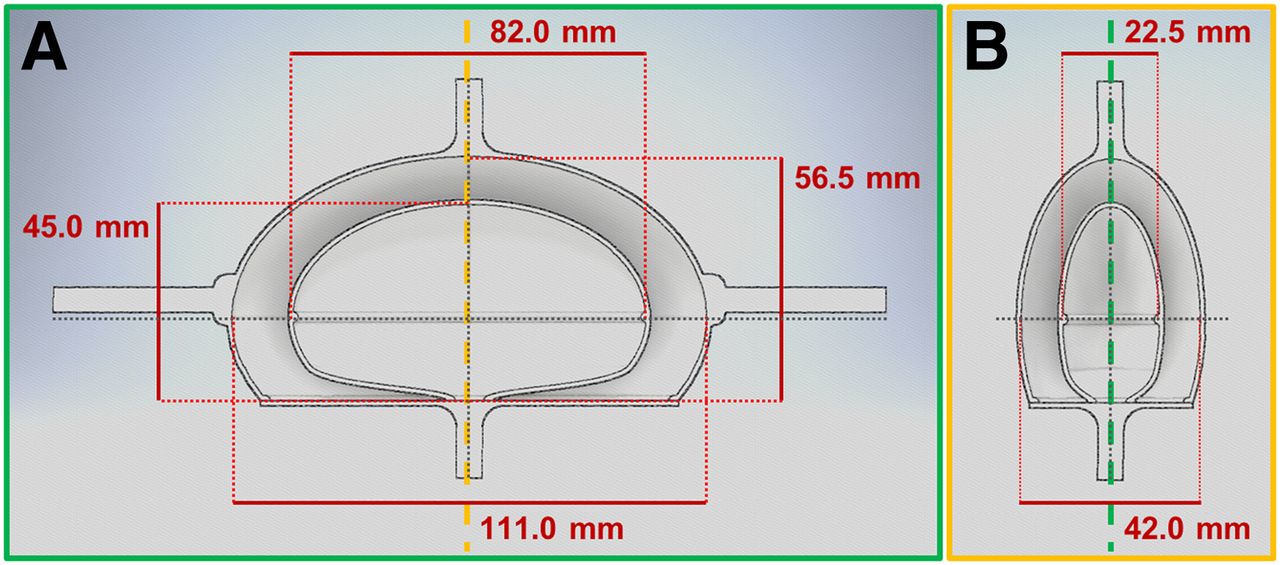
In this study, a previously presented 3D-printed 2-compartment kidney with a cortical compartment (70%) and a compartment containing medulla and collecting system (30%) was used to mimic a nonuniform kidney activity distribution. The modeling, printing, and refinement procedure, as well as the attachment system for the National Electrical Manufacturers Association (NEMA) NU2-2012 body phantom (PTW Freiburg GmbH), were previously described comprehensively (17,19). A technical drawing of the phantom, including the most relevant dimensions, is given in Figure 1 (filling volume of cortex, 99.6 mL; filling volume of medulla, 44.0 mL). Nonuniform kidney uptake was achieved by filling both compartments with radioactive solutions of different activity concentrations. A ratio of 5:1 was chosen on the basis of autoradiography data from De Jong et al. where, in the considered kidney regions, activity concentration ratios between 1:1 and 8:1 were found, depending on patient, time after injection, and subregion of cortex or medulla (20). The 5:1 ratio marks the center of these observations and helps to illustrate the difference between the 2 compartments and separate the absorbed dose peaks in the respective DVHs. To ensure a stable solution, 177Lu chloride (Isotope Technologies Garching GmbH) was dissolved in 0.1 M HCl with 100 ppm of stable lutetium for all measurements (21).

Technical drawing of kidney phantom consisting of cortex and medulla. A and B represent cross-sections that are perpendicular to each other (the dashed line indicates the position of the cross-section framed in the same color).
A VDC-405 activity meter with a VIK-202 ionization chamber (Comecer SpA) was used to estimate the activity concentration during the phantom-filling process. Subsequently, accurate activity concentrations were obtained by measuring 1-mL aliquots of both stock solutions (3 per stock solution) in a high-purity germanium detector (HPGe; Canberra Industries Inc.) whose energy-dependent efficiency was calibrated with several National Institute of Standards and Technology–traceable and National Physical Laboratory–traceable standards over the energy range considered.
The amount of stock solution in each kidney compartment was determined by weighing the phantom before and after the filling procedure with a PCB 3500-2 precision balance (Kern and Sohn GmbH) with a readability of 0.01 g. The aliquot volumes were weighed in an ED224S analytic balance (Sartorius AG) with a readability of 0.1 mg. All activities were decay-corrected to the starting time of the SPECT/CT acquisition.
Quantitative SPECT/CT Imaging
All acquisitions were performed on a Symbia Intevo Bold SPECT/CT system (Siemens Healthineers) with 9.5-mm crystal thickness, medium-energy low-penetration collimator, 180° configuration, automatic contouring, continuous mode, 60 views, 30 s per view, 256 × 256 matrix, and 3 energy windows (20% around the main photopeak of 208 keV with 2 adjacent 10% windows). Subsequent to the SPECT acquisition, a low-dose CT scan was acquired for attenuation correction (130 kVp, 512 × 512 × 131 matrix, 1.0 × 1.0 × 3.0 mm resolution). Additionally, the scan was repeated with 1-mm isotropic resolution (512 × 512 × 392 matrix) for a better volume-of-interest (VOI) definition.
Two different reconstruction algorithms were applied for each acquisition. The first, Flash3D, is ordered-subset expectation maximization with depth-dependent 3D resolution recovery (Gaussian point-spread-function model). Reconstructions were performed with a matrix of 128 as recommended by the manufacturer (voxel size, 4.8 mm). For quantitative imaging, an image calibration factor of 20.22 ± 0.53 cps/MBq (counts-per-second-per-Megabecquerel) had been previously determined in a cylindric Jaszczak phantom (22). Although an uncertainty for the image calibration factor was determined including the uncertainties of acquisition duration (1 s) and number of counts (square root of counts), it is dominated by the uncertainty of the HPGe-based activity determination, which was assumed as 2.5%. On the basis of this image calibration factor, counts were converted to activity (MBq) by applying
The second type of reconstruction, xSPECT Quant, is ordered-subset conjugate gradient maximization with depth-dependent 3D resolution recovery using a measured point-spread function. As recommended by the manufacturer, a 256 matrix was used for the reconstruction (voxel size, 2.0 mm). For count–activity conversion, a manufacturer-determined class standard sensitivity (radionuclide-, collimator-, and crystal-dependent) is system-specifically fine-tuned on the basis of a 3% National Institute of Standards and Technology–traceable 75Se source. For simplicity, xSPECT Quant will be called xSPECT in what follows.
CT-based attenuation correction (in forward and backward projections) and a triple-energy-window scatter correction (in forward projection only) were applied in both reconstructions. To investigate the influence of the reconstruction parameters on the dose distribution, different combinations of updates (Flash3D, between 12 and 384; xSPECT, between 12 and 96) and Gaussian postfilters (between 0 and 8 voxels) were applied. Because the number of iterations is limited to 100 by the manufacturer, update numbers larger than 100 were obtained for Flash3D by applying a combination of iterations and subsets (e.g., 384 updates were obtained by combining 96 iterations with 4 subsets). Although the combination of iterations and subsets has no impact on Flash3D reconstructions, this is not the case for xSPECT (22). Therefore, xSPECT was restricted to 1 subset.
All postprocessing was performed in MATLAB (MathWorks) and in syngo.via, version VB10B (Siemens Healthineers).
Partial-Volume Correction
First, VOIs were drawn in 3D Slicer (23) for both the cortical compartment and the medullary compartment on the basis of the isotropic-resolution CT (→localization) in combination with the filling volumes (→size). Next, the SPECT reconstructions (voxel sizes of 4.8 and 2.0 mm for Flash3D and xSPECT, respectively) were interpolated to match the isotropic CT resolution of 1 mm (3D Slicer: bspline interpolation). Finally, partial-volume correction was performed using PETPVC (18) with iterative Yang correction (inputs: 1-mm SPECT interpolation, cortical VOI, medullary VOI, predetermined resolutions). This method was first presented by Erlandsson et al. (10) and is an updated version of the region-based voxelwise correction for PET (24). In short, it convolves the VOIs with the system’s point-spread function and uses the ratio before and after convolution to estimate partial-volume correction factors. Therefore, it corrects for spill-in and spill-out from one segmented VOI to another but not from one voxel to another.
The necessary estimates of resolution for all sets of reconstruction parameters (Table 1) had previously been obtained in a matched-filter analysis of a hot-sphere–cold-background acquisition (6 177Lu-filled spheres in the water-filled National Electrical Manufacturers Association [NEMA] NU2-2012 body phantom) reconstructed with the same parameters as the SPECT image to be partial-volume–corrected. Both the image acquisition and the evaluation were previously described in detail (22).
Predetermined Resolutions for Different Combinations of Updates and FWHMs
Calculation of Absorbed Dose Distributions
Dose distributions were obtained by convolution of the 1-mm isotropic SPECT interpolations (MBq mL−1) with a set of Monte Carlo–based voxel S values for 177Lu (mGy/MBq/s) as described previously (25–27). Multiplication with the voxel volume (mL) and a time-integrated activity coefficient of 73.6 h (estimated from a tissue-specific kidney half-life of 51 h (28) divided by ln(2)) yields the dose (mGy) in each voxel. This was performed for both the uncorrected (no PVC) and the partial-volume–corrected (PETPVC) SPECT reconstructions.
Additionally, ground-truth dose distributions were calculated by performing the above calculations on a numeric phantom consisting of VOI-based masks (0, nonactive field-of-view; 1, active volume) multiplied by the HPGe-based activity concentration of the respective compartment.
DVHs
In the Results section, dose distributions will be depicted mainly as DVHs (3). After discarding all voxels outside both suborgan VOIs, differential DVHs assign all voxels in a certain absorbed dose interval to appropriate histogram bins (width, 25 mGy), which are normalized to the total number of voxels. As a continuation, cumulative DVHs are calculated as 1 minus the integral of the differential DVHs. Although the horizontal axis represents the absorbed dose threshold for each bin, the vertical axis represents the fraction of the VOI volume having a dose larger than or equal to the dose threshold.
Calculation of Mean Suborgan Absorbed Doses
Mean suborgan absorbed doses were calculated as the mean over the CT-based suborgan VOIs (cortical VOI, medullary VOI). This calculation was additionally performed for the ground truth absorbed dose distributions, and percentage differences were calculated.
As an alternative measure to the mean absorbed dose, the root-mean-square deviation (RMSD) between the SPECT/CT-based and the nominal absorbed dose distribution was calculated as
Here, D(i) stands for the absorbed dose in voxel i, and the sum is taken over all voxels of the VOI.
RESULTS
Because the current gold standard in SPECT/CT imaging is 3D ordered-subset expectation maximization with CT-based attenuation correction, triple-energy-window scatter correction, and resolution recovery, only the Flash3D results will be given here. The data for the very recently introduced and not yet widespread xSPECT Quant reconstruction will be shown as supplemental material (supplemental materials are available at http://jnm.snmjournals.org).
Activity Concentration Versus Absorbed Dose Distribution
The kidney compartments were filled with activity concentrations of 1.89 ± 0.05 MBq/mL (cortex) and 0.36 ± 0.01 MBq/mL (medulla), representing a cortex-to-medulla ratio of 5.21 ± 0.18 (based on HPGe measurements; an uncertainty of 1 mg was assumed for the aliquot volume [filled minus empty measurement vial] in addition to the 2.5% uncertainty of the HPGe-based activity determination). The CT-based VOI analysis resulted in suborgan absorbed doses of 7.75 Gy (cortex) and 1.56 Gy (medulla).
Figure 2 shows example distributions of activity concentration (MBq/mL) and the resulting absorbed dose distributions (Gy) before and after partial-volume correction. To visualize the differences, cross-sections are additionally depicted. Despite slight smoothing, especially at the sharp edges (e.g., around the transition between cortex and medulla at ±40 mm), the absorbed dose distribution closely resembled the activity distribution, visually. Consequently, the absorbed dose distribution is influenced mainly by the SPECT image reconstruction method and the related artifacts and errors. PETPVC effectively reduces partial-volume errors by shifting the counts back into the 2 VOIs.

Difference between activity concentration (MBq/mL) (A) and dose distribution (Gy) (B). Shown are example images as well as cross-sections (indicated by dashed lines) before and after partial-volume correction (PVC) (Flash3D with 48 iterations, 1 subset, and 8-mm Gaussian postfilter).
Visual Assessment of Absorbed Dose Distributions
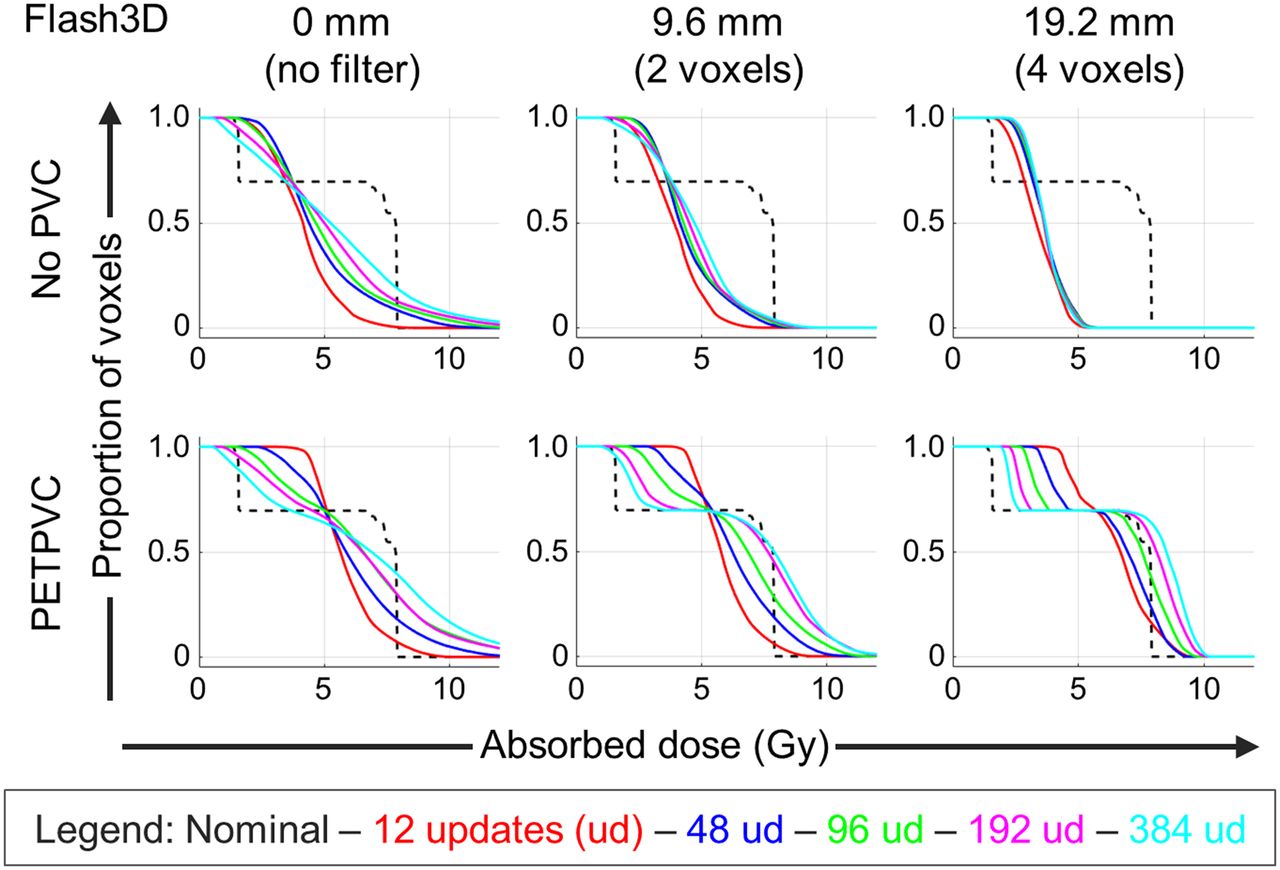
Figure 3 shows differential DVHs. For the sake of clarity, only a few example iteration numbers are depicted. The gamma camera–based SPECT imaging process blurs the 2 discrete absorbed dose values of both compartments (blue and red solid lines) into one continuous distribution. As a result, voxel absorbed doses lie mainly between the low medullary and the high cortical nominal suborgan absorbed doses. This is especially pronounced before convergence is reached (e.g., after 12 updates). As more updates are applied, the distribution increasingly broadens until it eventually extends into both nominal absorbed doses (e.g., after 96 updates). Postfiltering reintroduces the blurring into the images and spreads the signal across the field-of-view, resulting in a shift of the higher absorbed voxel doses toward smaller values. The consequent DVHs look similar to the ones before convergence. This is also illustrated in Figure 4, which shows the effect of the different reconstruction parameters on the 3D dose distributions (voxel size, 1 mm). As expected, SPECT reconstructions are blurred versions of the underlying 2-compartment object (Fig. 4, right). Although this effect is improved by applying more updates, it is even further enhanced by postfiltering (e.g., 12 updates without filtering closely resemble 96 updates with a 4-voxel filter applied).

Differential DVHs for different Flash3D reconstructions without (top) and with (bottom) partial-volume correction (PVC). From left to right, different numbers of updates (between 12 and 960) are shown. Additionally, different postfilters were applied (no filtering, 2-voxel FWHM, 4-voxel FWHM). Blue and red solid lines indicate nominal absorbed doses of both compartments.
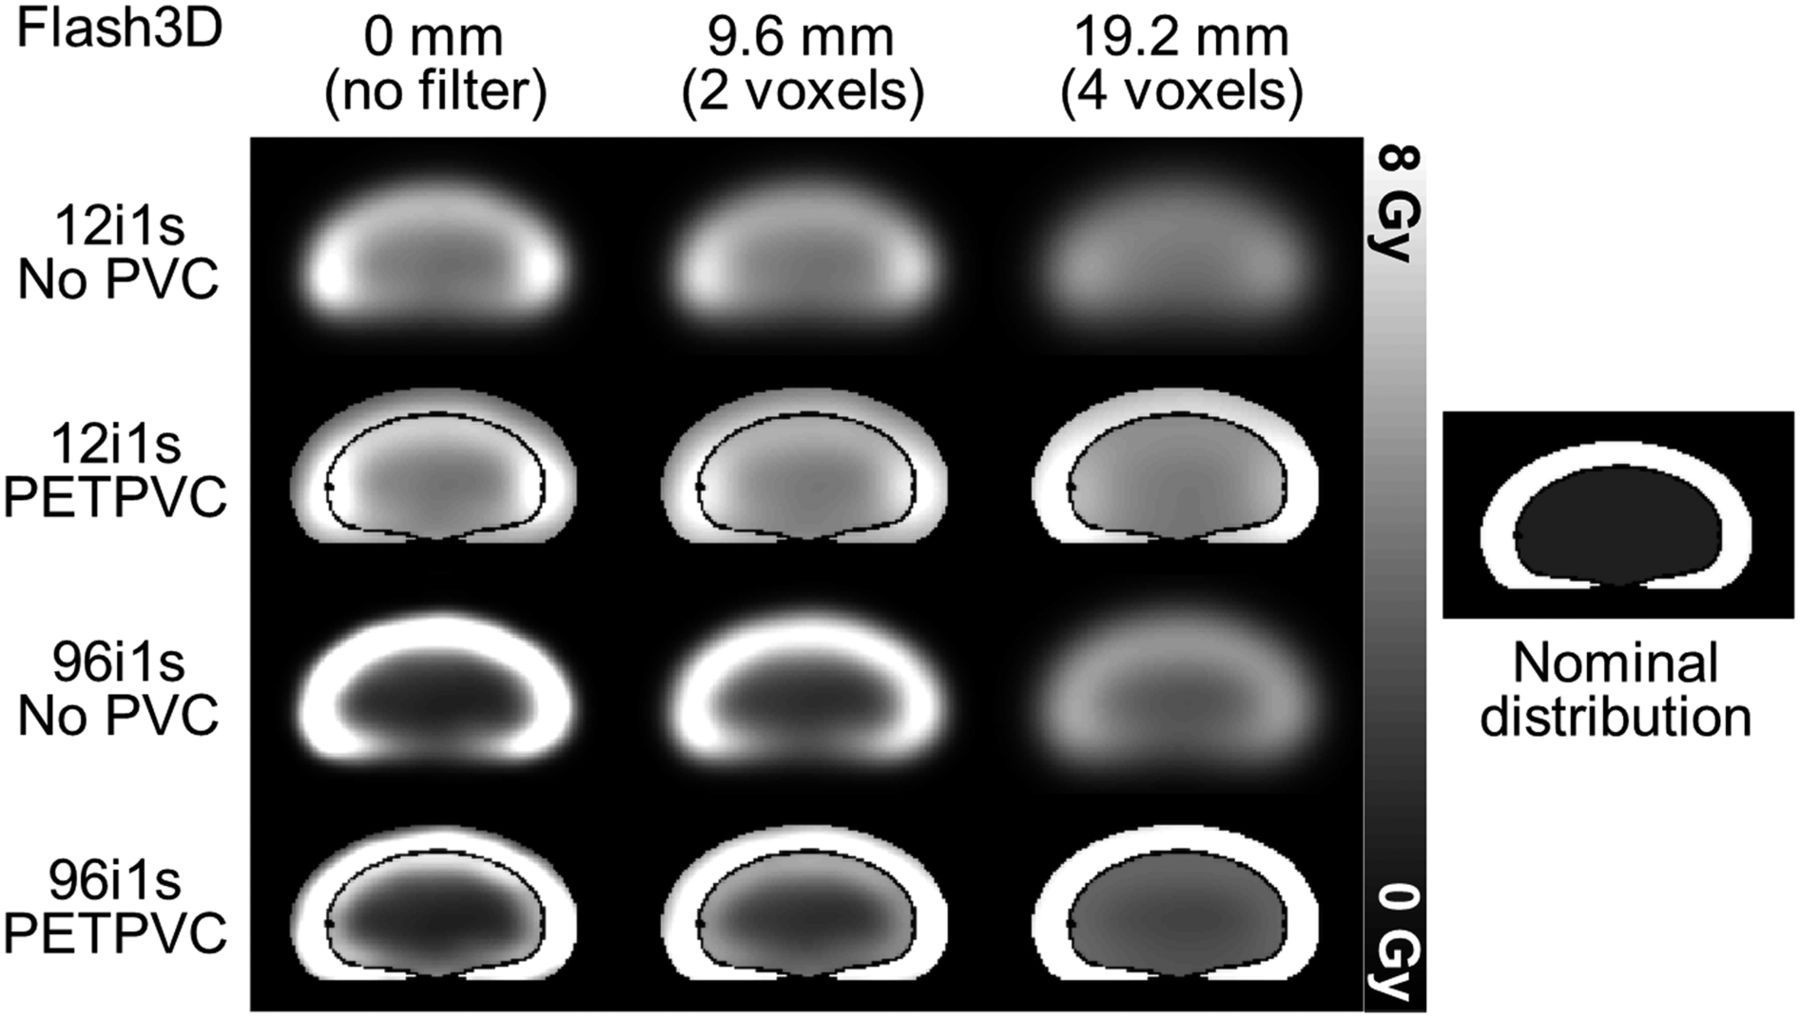
Cross-sections through 3D absorbed dose distributions obtained from Flash3D reconstructions (12 and 96 updates) with and without partial-volume correction (PVC). From left to right, different postfilters were applied (no filtering, 2-voxel FWHM, 4-voxel FWHM). Additionally, the nominal absorbed dose distribution is given (right).
The situation changes after the application of PETPVC: although a large difference remains visible between the nominal and the SPECT/CT-based differential DVHs (especially for small iteration numbers), 2 separate peaks start to become visible after a sufficient number of updates (e.g., 96 updates). Although the peaks of the cortical absorbed dose distributions increase with increasing iteration numbers, the ones of the medulla simultaneously decrease. The optimum for the cortex is reached after about 96 updates, whereas the medullary compartment optimum is not reached before approximately 400 updates (depending on the postfilter applied). In contrast to the non-partial-volume–corrected reconstructions, postfiltering improves the resolution of the 2 peaks (decrease in width). Consequently, the best visual correlation is achieved by a sufficient iteration number combined with a postfilter of an adequately large full width at half maximum (FWHM) (e.g., 384 updates and a 2-voxel FWHM postfilter). This impression is reinforced by the associated images (Fig. 4), where both VOIs consist of absorbed doses in very similar ranges if 96 updates and a 4-voxel FWHM postfilter are applied in combination with PETPVC.
Lastly, cumulative DVHs are depicted in Figure 5. According to this illustration, the high absorbed doses (i.e., the cortex) are largely underestimated without partial-volume correction (even more after postfiltering). Although more updates slightly improve these errors, no reliable statement about the absorbed doses can be made on the basis of the cumulative DVHs. After PETPVC, high absorbed doses are largely overestimated if too many updates are applied without filtering. In agreement with the differential DVH observations, this effect is effectively improved by the postfiltering.

Cumulative DVHs for different Flash3D reconstructions without (top) and with (bottom) partial-volume correction (PVC). From left to right, different postfilters are shown (no filtering, 2-voxel FWHM, 4-voxel FWHM). Additionally, different numbers of updates (ud) were applied (different colors). The nominal absorbed dose is given by the dashed line.
Mean Suborgan Absorbed Doses
Table 2 lists the nominal and the SPECT/CT-based suborgan absorbed doses of cortex and medulla for different reconstructions (different update numbers, different postfilters, with or without PETPVC). Although the nominal absorbed doses were 7.8 and 1.6 Gy (in the cortex and medulla, respectively), SPECT/CT imaging resulted in mean absorbed doses of 3.0–6.6 Gy (cortex) and 2.7–5.1 Gy (medulla). PETPVC led to improved ranges of 6.1–8.9 Gy (cortex) and 2.1–5.4 Gy (medulla). For better visualization, Figure 6 depicts the percentage differences. For the cortex, the best correlation between measured and nominal distribution was reached for a sufficient number of updates combined with an adequate postfilter (96 updates and a 2-voxel postfilter) with PETPVC applied. For the medulla, the difference continued to decline even after application of the maximum number of updates (difference of 33.6% after 384 updates without postfiltering with PETPVC applied).
Mean Absorbed Doses for Different Combinations of Updates and FWHMs
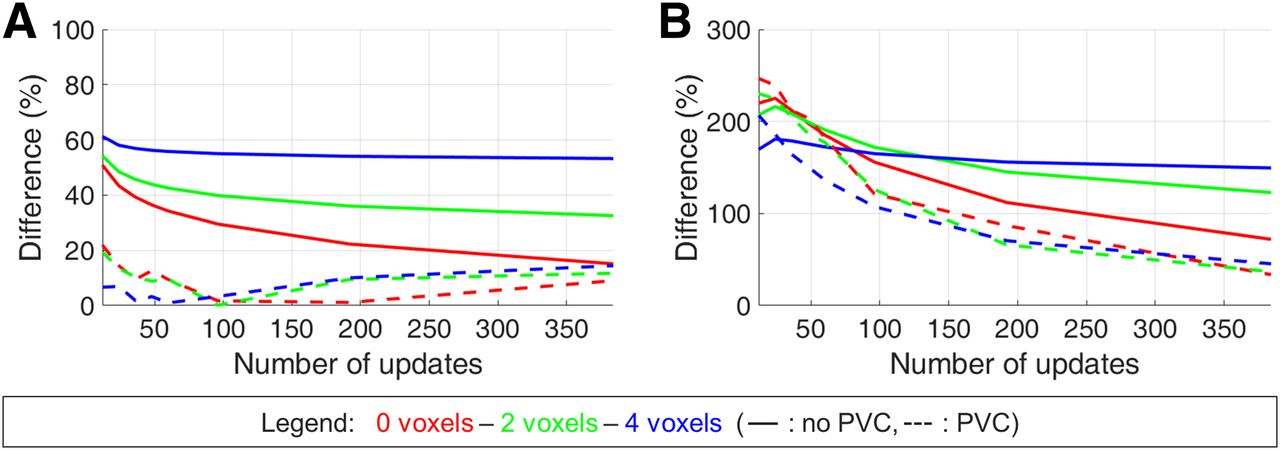
Percentage difference between SPECT/CT-based and HPGe-based mean suborgan absorbed doses for different postfilters for Flash3D reconstructions with (dashed line) and without (solid line) partial-volume correction in cortex (A) and medulla (B).
Although the ideal combination of number of updates and postfiltering slightly differed for the root-mean-square deviation (96 updates and a 2-voxel postfilter, Table 3), a similar behavior can be seen.
Root-Mean-Square Deviation Between SPECT/CT-Based and Nominal Absorbed Dose Distribution for Different Combinations of Updates and FWHMs
xSPECT
Most observations made for the ordered-subset expectation maximization–based Flash3D reconstruction also apply to the ordered-subset conjugate gradient minimization algorithm–based xSPECT reconstruction. To illustrate this, Supplemental Figures 1–4 are provided in analogy to the Flash3D figures given in the main article.
DISCUSSION
All investigations were based on a SPECT/CT dataset of a kidney with an inhomogeneous activity concentration, which was achieved by filling 2 separate compartments of a 3D-printed kidney phantom with different activity concentrations. Although these 2 distinct dose values are a gross simplification compared with the activity distribution in a real patient kidney, the simplicity of this model facilitates a comprehensive investigation of the influence of different reconstruction parameters and a subsequent partial-volume correction on the derived (differential as well as cumulative) DVHs. It should be mentioned that, in contrast to external-beam radiotherapy, for which DVHs are typically based on morphologic imaging (e.g., CT) and eventually used for treatment planning, the concept is used in this work only to visualize and better understand the effect of imaging errors on absorbed dose distributions. Although voxel-based dosimetry holds great potential for more sophisticated treatment planning, such as the calculation of biologically effective doses or equivalent uniform doses (29), more basic research on the underlying imaging effects is needed for a solid understanding of opportunities and pitfalls.
According to a previous publication (30), any SPECT/CT-based activity distribution or VOI features a spread of absorbed dose values that can be caused by 4 factors: the first is real activity heterogeneities, the second is energy deposition from particles emitted outside the organ, the third is partial-volume errors caused by the limited spatial resolution of the imaging system (spill-in/spill-out), and the fourth is noise in the data collection. Because the aim of this study was to understand and optimize the effect of partial-volume errors on the dose distribution, the influence of the first, second, and fourth factor had to be minimized. The first factor, activity heterogeneity, was precisely defined by filling the 2-compartment phantom with 2 different, HPGe-measured activity concentrations. In addition, the second factor can be neglected for 177Lu, with its short electron range (several millimeters), and the fourth factor was kept to a minimum by collecting sufficient counts (2 × 10⁶ in the main energy window). That way, all other major confounding factors of the absorbed dose spread are minimized in the study setup, and the study is ideally suited for investigating the influence of errors caused by the partial-volume effect. Lastly, resolution modeling, which is used in both of the applied reconstructions, can impair image quality in addition to the above reasons. For the reconstructions performed in this work, no edge-ringing artifacts were visible. Because the dimensions of the investigated object (e.g., the cortex diameter) lie in the range of the spatial resolution, overshoots are a more likely consequence of the applied resolution modeling, which explains the occurrence of high absorbed voxel doses for the unfiltered reconstruction (e.g., after 960 Flash3D updates). However, no profound analysis of resolution model–related errors was performed in this study.
Despite the unnaturally abrupt transition between low and high activity concentration in the investigated phantom, an optimized combination of reconstruction parameters (updates and postfiltering) with PETPVC led to considerably improved differential and cumulative DVHs. Consequently, the residual degradations observed previously (2) can be even further reduced by introducing a partial-volume correction performed subsequent to a standard manufacturer reconstruction.
Because the iterative Yang partial-volume correction method convolves the segmented VOIs with the system’s point-spread function, one major source of error lies in the resolution: although PETPVC was developed for PET imaging with a nearly isotropic and spatially invariant resolution, SPECT imaging features an anisotropic and spatially variant resolution (22). Although resolution recovery—which is provided by most manufacturers—partly corrects these spatial resolution variations, the resolution remains largely dependent on the distance between the detector and the imaged object, or, in other words, on the position of the object in the SPECT field-of-view. To minimize the related error, the same phantom and, therefore, detector auto-contour was applied for both the resolution determination measurement and the kidney measurement. Moreover, both the sphere inserts and the kidney were measured in the center of rotation. Because of the small kidney dimensions of 4 × 12 × 6 cm and presuming a slow spatial variation of the resolution, the assumption of an isotropic and spatially invariant resolution seems acceptable. Nevertheless, a spatially variant partial-volume correction method would be preferable and should be developed and applied in future studies. In addition to the spatial variance of the resolution, the determination of the resolution represents a potential source of error, which was previously discussed in detail (22,31).
Additionally, it should be kept in mind that iterative Yang partial-volume correction corrects for spill-in and spill-out between segmented VOIs instead of applying a voxel-by-voxel correction, which introduces a correlation between the voxels within each VOI. Despite this disadvantage, the method was chosen as it produces a voxel-by-voxel correction of the whole image, does not require any prior information about the activity distribution, and can be used with any number of VOIs.
Another source of error is the calculation of absorbed doses based on presimulated 177Lu voxel S values. The very low emission probability (∼11%) of the 208-keV γ-transition results in a negligible photon proportion of the absorbed dose. Likewise, the β-radiation of 177Lu has a range of only several millimeters in soft tissue, leading to deposition of almost the entire dose directly at the origin of the disintegration. This assumption is confirmed by the observation that the absorbed dose distribution corresponds, in good approximation, to a multiplication of the activity distribution with a constant dose conversion factor. Lastly, the kidney phantom as well as the body phantom were filled with aqueous solutions, justifying that the voxel S values had been simulated for soft tissue. Still, it has to be stated that full Monte Carlo simulations should be used when different tissue densities (other than soft tissue) or intervoxel heterogeneities are deemed relevant (32).
The conjugate gradient–based xSPECT reconstruction (data provided as Supplemental Figs. 1–5) shows a 3–4 times faster convergence than the expectation maximization–based Flash3D reconstruction. Therefore, 12 xSPECT iterations are approximately comparable to 36–48 Flash3D iterations (22). Additionally, xSPECT has a tendency to favor areas of high signal while suppressing areas of low signal. If too many iterations are applied, the signal in low-intensity voxels starts to drop to zero as counts are shifted toward the higher-intensity cortical region. This leads to the occurrence of zeros in the entire medullary region after 96 unfiltered xSPECT iterations (Supplemental Fig. 5). Although the xSPECT-based determination of mean absorbed doses for the medullary compartment seems to be nearly perfect after 36–60 xSPECT updates, followed by postfiltering and PETPVC (dashed lines in Supplemental Fig. 4B), the entire medullary activity stems from the cortex, from which activity is spilled back into the medulla by PETPVC, rather than by intensity originally located in the medulla. Therefore, care should be taken to examine the fundamentals of each reconstruction rather than simply transferring reconstruction parameters between the 2 different reconstruction methods. Instead, for the investigated count and noise conditions, the number of xSPECT iterations should be limited to 48.
One important finding of this work is that without partial-volume correction, none of the presently available reconstruction methods was able to achieve a cumulative DVH that would be acceptable for treatment planning, as the lower absorbed doses of the medullary compartment are considerably overestimated and the higher absorbed doses of the cortical compartment are considerably underestimated.
In addition, this study setup neglects any errors in the time–activity curve integration as it is offered (either organ-based or voxel-based) by some software solutions. These errors include, for example, inaccurate image registration, inter- and intraobserver variability in the VOI drawing, and differences in the choice of an appropriate fit function. Because the voxel-level information, despite excluding these sources of error, strongly differs from the true distribution, it seems more adequate to assess the absorbed dose on an organ level or, in the case of large organs such as the liver, to divide the VOI into sub-VOIs consisting of multiple voxels each to minimize the systematic partial-volume–based error.
Although a voxel-based dosimetry approach results in an absorbed dose value for each voxel, the distribution of these doses can strongly differ from the truth. Instead, the distribution is strongly dependent on the SPECT reconstruction settings, including but not limited to the applied number of updates and the postfilter.
CONCLUSION
Although voxel-based dosimetry promises information about the dose absorbed in any organ at risk on a suborgan or even voxel level, the resulting dose distributions were, in our simple setup of a 2-compartment kidney phantom containing activity in a 5:1 ratio (cortex:medulla), found to be strongly affected by the SPECT reconstruction algorithm and the chosen reconstruction parameters such as iterations, subsets, and Gaussian postfiltering. For most short-range theranostic β-emitters such as 177Lu, most of the dose is deposited directly at the origin of the disintegration. Consequently, SPECT/CT imaging and reconstruction deficiencies might directly translate into unrealistic absorbed dose distributions, thus bringing into question the reliability of SPECT/CT-based voxel-level dosimetry. Instead, the SPECT/CT reconstructions should be adequately corrected (e.g., by partial-volume corrections) to ensure an accurate quantification of the underlying activity and, therefore, absorbed dose, in a VOI of the expected object size (e.g., organs, organ substructures, lesions, or voxels).
DISCLOSURE
This work was partly supported by the European Metrology Programme for Innovation and Research (EMPIR) project 15HLT06 MRTDosimetry (http://mrtdosimetry-empir.eu/). The EMPIR is jointly funded by the EMPIR participating countries within EURAMET and the European Union. No other potential conflict of interest relevant to this article was reported.
KEY POINTS
QUESTION: Does the SPECT/CT-based distribution of absorbed doses coincide with the underlying dose distribution, and can the quality of voxel-based absorbed dose distributions be improved by performing a partial-volume correction?
PERTINENT FINDINGS: In a 177Lu phantom study with an inhomogeneously filled 3D-printed 2-compartment kidney (cortex and medulla), imaging-based DVHs considerably differed from the underlying absorbed doses. Although the agreement was improved by partial-volume correction, differences remain and therapy planning based on the resulting DVHs should be treated with caution.
IMPLICATIONS FOR PATIENT CARE: The quantification of SPECT/CT images should be adapted to adequately match the VOI size of organs, organ substructures, lesions, or voxels and the sampling of time–activity curves for calculating absorbed doses.
Footnotes
Published online Dec. 20, 2019.
- © 2020 by the Society of Nuclear Medicine and Molecular Imaging.
REFERENCES
- Received for publication August 19, 2019.
- Accepted for publication December 11, 2019.


Jump to section
Related Articles
Cited By...
- Rethinking Dosimetry: A European Perspective
- Multicycle Dosimetric Behavior and Dose-Effect Relationships in [177Lu]Lu-DOTATATE Peptide Receptor Radionuclide Therapy
- Dosimetry Software for Theranostic Applications: Current Capabilities and Future Prospects
- A Pipeline for Automated Voxel Dosimetry: Application in Patients with Multi-SPECT/CT Imaging After 177Lu-Peptide Receptor Radionuclide Therapy
- Toward a Patient-Specific Traceable Quantification of SPECT/CT-Based Radiopharmaceutical Distributions
- Dosimetry for Radiopharmaceutical Therapy: The European Perspective