


Abstract
Whole-body attenuation correction (AC) is still challenging in combined PET/MR scanners. We describe Dixon-VIBE Deep Learning (DIVIDE), a deep-learning network that allows synthesizing pelvis pseudo-CT maps based only on the standard Dixon volumetric interpolated breath-hold examination (Dixon-VIBE) images currently acquired for AC in some commercial scanners. Methods: We propose a network that maps between the four 2-dimensional (2D) Dixon MR images (water, fat, in-phase, and out-of-phase) and their corresponding 2D CT image. In contrast to previous methods, we used transposed convolutions to learn the up-sampling parameters, we used whole 2D slices to provide context information, and we pretrained the network with brain images. Twenty-eight datasets obtained from 19 patients who underwent PET/CT and PET/MR examinations were used to evaluate the proposed method. We assessed the accuracy of the μ-maps and reconstructed PET images by performing voxel- and region-based analysis comparing the SUVs (in g/mL) obtained after AC using the Dixon-VIBE (PETDixon), DIVIDE (PETDIVIDE), and CT-based (PETCT) methods. Additionally, the bias in quantification was estimated in synthetic lesions defined in the prostate, rectum, pelvis, and spine. Results: Absolute mean relative change values relative to CT AC were lower than 2% on average for the DIVIDE method in every region of interest except for bone tissue, where it was lower than 4% and 6.75 times smaller than the relative change of the Dixon method. There was an excellent voxel-by-voxel correlation between PETCT and PETDIVIDE (R2 = 0.9998, P < 0.01). The Bland–Altman plot between PETCT and PETDIVIDE showed that the average of the differences and the variability were lower (mean PETCT–PETDIVIDE SUV, 0.0003; PETCT–PETDIVIDE SD, 0.0094; 95% confidence interval, [−0.0180,0.0188]) than the average of differences between PETCT and PETDixon (mean PETCT–PETDixon SUV, 0.0006; PETCT–PETDixon SD, 0.0264; 95% confidence interval, [−0.0510,0.0524]). Statistically significant changes in PET data quantification were observed between the 2 methods in the synthetic lesions, with the largest improvement in femur and spine lesions. Conclusion: The DIVIDE method can accurately synthesize a pelvis pseudo-CT scan from standard Dixon-VIBE images, allowing for accurate AC in combined PET/MR scanners. Additionally, our implementation allows rapid pseudo-CT synthesis, making it suitable for routine applications and even allowing retrospective processing of Dixon-VIBE data.
The evolution of PET and MRI into complementary in vivo molecular imaging techniques has generated increased interest in the development of combined PET/MRI systems (1). However, many challenges have slowed the adoption of the recently developed simultaneous PET/MR scanners (2). The most important methodologic challenge for whole-body applications is attenuation correction (AC), which is critical for quantitative studies and even qualitative data interpretation.
In the case of the commercially available PET/MR scanners, attenuation maps (μ-maps) are typically generated from the MR data acquired using a Dixon volumetric interpolated breath-hold examination (Dixon-VIBE) sequence or a liver acquisition with volume acceleration-flexible (LAVA-Flex) sequence. Four tissue classes (background, fat, lung, and soft tissue) are segmented from these data, and discrete linear attenuation coefficients are assigned to each class (3). The major limitation of this method is that it misclassifies bone as fat tissue, leading to substantial bias in the PET measurements (4), particularly in the pelvis.
Most of the early efforts in MR-based AC have focused on the head (5), differing mainly in the type of semantic representation used to describe the image data (i.e., templates or atlases (6,7), segmentation (8,9), or reconstruction (10)). It has recently been shown that several of the template- or atlas-based methods are accurate (11). However, their translation to whole-body applications is still challenging. For example, the large intersubject variability (in terms of anatomy, size, body mass index, pathology) makes the generation of atlases and templates that adequately describe the population difficult. Furthermore, using these methods in other body regions (e.g., pelvis) requires a combination of rigid and nonrigid registration. Consequently, these methods showed limited accuracy when applied to whole-body AC (12). In this context, Leynes et al. presented a hybrid zero–echo-time Dixon MR-based AC method that included bone density estimates obtained by converting the zero–echo-time signal intensity to Hounsfield units using a continuous 2-segment piecewise linear model (13). However, this method relies on a manual correction step during bone segmentation.
As an alternative, deep-learning approaches can be used to generate μ-maps from the MR data. Deep-learning approaches based on convolutional neural networks have already shown tremendous potential for image classification (14), image segmentation (15–17), and image synthesis (18,19), becoming popular in medical imaging (20–24).
Several deep-learning–based approaches have already been proposed for MR-based AC. Ribeiro et al. proposed a feed-forward neural network to directly output a continuous-valued head μ-map by nonlinear regression of several ultrashort-echo-time images and the template-based AC map (25). Very recently, Leynes et al. also proposed a multiparametric MRI model to generate pelvis pseudo-CT maps based on Dixon MRI and proton-density–weighted zero-echo-time MR images (26). Although the preliminary results obtained with these methods are encouraging, they have the disadvantage of relying on specialized MR sequences that require additional acquisition times.
In this paper, we describe a Dixon-VIBE Deep Learning (DIVIDE) method to synthesize pelvis pseudo-CT maps based only on the standard Dixon-VIBE images routinely acquired for AC purposes on commercial scanners. Our network maps between the 2-dimensional (2D) Dixon MRI slices and their corresponding CT slices. The network architecture is similar to one previously proposed (15,16,21), but instead of using unpooling to up-sample the features, we use transposed convolutions to learn the up-sampling parameters. In contrast to previously proposed patch-based methods, we used the whole 2D slice to provide context information. We showed the PET quantification bias to be reduced when using DIVIDE compared with the standard Dixon-VIBE approach.
MATERIALS AND METHODS
Data Acquisition
CT and PET/MR images of 13 colorectal and 6 prostate cancer patients (mean age, 61.42 ± 10.63 y; range, 44–80 y; 12 men and 7 women; mean body mass index, 22.30 ± 2.88; range, 17.43–29.73) were retrospectively analyzed. Additionally, follow-up images for 9 of the colorectal cancer patients were also included (substantial anatomy and body mass index changes were noted after treatment/surgery). All patients underwent same-day PET/CT and PET/MR studies following the routine protocols. No obvious artifacts were observed in the CT or MR images. All patients gave written informed consent, and the local Institutional Review Board approved the study.
CT Data
Low-dose CT images were acquired on a Discovery PET/CT 710 scanner (GE Healthcare) with a matrix of 512 × 512, resolution of 1.37 × 1.37 mm, slice thickness of 3.75 mm, pitch of 0.94 mm, acquisition angle of 0, voltage of 120 kV, and tube current of 150 mA.
PET/MR Data
The PET/MR examinations were performed 66.60 ± 22.83 min after the PET/CT scans using the Biograph mMR scanner (Siemens Healthineers). PET emission data were acquired for 16.1 ± 10.0 min (range, 7–35 min) and a variable number of bed positions (1–5) 120.0 ± 36.8 min after administration of 378.1 ± 64.1 MBq of 18F-FDG (16 subjects, 25 scans) or 291.0 ± 50.5 MBq of 18F-choline (3 subjects, 3 scans; Supplemental Table 1, available at http://jnm.snmjournals.org).
The standard Dixon-VIBE sequence (repetition time, 3.6 ms; first echo time, 1.23 ms; second echo time, 2.46 ms; acquisition matrix, 192 × 128; 128 slices per bed position; voxel size, 2.6 × 2.6 × 3.1 mm [in-plane resolution × slice thickness]; flip angle, 10°; acquisition time, 18 s) was run for AC purposes. Other MR sequences were additionally run as part of the clinical protocols for prostate and colorectal cancer, respectively.
Data Preprocessing
Images were preprocessed as follows. First, MRI bias was corrected using the N4ITK MRI bias correction module in 3D Slicer 4 (27). Given the large field of view, we set the advanced parameters to 3 levels of resolution with 500, 400, and 300 iterations, respectively, and a convergence threshold of 0.00001 to ensure proper modeling of the inhomogeneity bias. Then, intrasubject rigid and nonrigid registration of the MR and CT data was performed using SPM8 software (28) and the Elastix package (29). Finally, reslicing and cropping of the data to a fixed 50 × 50 × 50 cm field of view with 2 × 2 mm pixels and a 1-mm slice thickness was performed to ensure spatial homogeneity among subjects.
DIVIDE Pseudo-CT Synthesis
Figure 1 provides a schematic representation of the convolutional-deconvolutional neural network implemented in TensorFlow (30) that takes four 2D images as input—water, fat, in-phase, and out-of-phase Dixon-VIBE images—and computes the corresponding pseudo-CT slice.

Schematic representation of our network architecture. Our implementation in TensorFlow processes in-phase and out-of-phase fat and water 2D Dixon slices to generate pseudo-CT slice. RELU = rectified linear unit.
The encoder network consists of 13 convolutional layers, corresponding to the first 13 convolutions of the Visual Geometry Group network (31), that convert the input MR images into a multidimensional feature representation. This is followed by a decoder network, which performs several up-samplings of the features to generate the final pseudo-CT slice. Shortcuts between the layers of the encoder and the decoder were created to use features from different scales in the decoding step.
Each layer of the encoder performed several convolutions with a 3 × 3 filter bank to produce a set of feature maps. After every convolution, a batch normalization was performed (32) and an elementwise rectified linear unit was applied. At the end of each encoding layer, a max-pooling with a 2 × 2 window and stride 2 was performed, resulting in a subsampling by a factor of 2 (33). After every max-pooling, the number of filters was doubled. This step introduced larger context-information in the resulting feature map. Increasing this context information resulted in a loss of spatial information, which is the reason for adding the shortcuts between the layers of the encoder and the decoder.
The decoder network comprised 10 convolutions and 4 transposed convolutions. Transposed convolutions (33) with a kernel of 3 × 3 and stride 2 were used to up-sample the feature map by a factor of 2. After every convolution, a batch normalization was performed and a rectified linear unit was applied. A final 1 × 1 convolution was performed to obtain the Hounsfield units.
The mean absolute error between CT and pseudo-CT slices was used as loss function. The mean absolute error was calculated only for the voxels within the body using a mask generated from the Dixon images.
To avoid overfitting, we performed data augmentation by applying random displacements of 5 voxels and a random flip in the slices, similarly to Han (21). Additionally, we used a dropout layer (32) with probability 0.5 before the first transposed convolution of the decoder, because the most informative feature maps are calculated in that part of the network.
The training optimization was performed using root-mean-square propagation. Instead of initializing the convolutional neural network weights with a noise distribution, the network was pretrained using MR T1-weighted brain images and their corresponding CT slices (6). Subsequently, we performed the training with the pelvis database, which contained between 9,000 and 11,000 samples, depending on the cross-validation iteration, for 80,000 iterations using a batch of 10 samples, resulting in 70 epochs to converge.
μ-Map Generation and PET Image Reconstruction
The pseudo-CT images were converted to linear attenuation coefficients using the bilinear transformation (34). The corresponding μ-maps were denoted μDIVIDE and μCT. Gaussian smoothing with a kernel of 4 mm in full width at half maximum was applied to match the PET spatial resolution. Additionally, the Dixon-VIBE–based μ-maps (μDixon) (9) were available. Air pockets in all the resulting μ-maps (μCT, μDixon, and μDIVIDE) were filled as soft tissue to avoid any bias that might result from differences caused by their displacement between the acquisitions.
The PET volumes were reconstructed using the standard 3-dimensional ordinary Poisson ordered-subset expectation-maximization algorithm with 21 subsets and 3 iterations, correcting for normalization, random prompts, background, dead time, photon attenuation, and scatter using the e7tools software provided by the manufacturer. Spatial smoothing was performed after image reconstruction using a gaussian filter of 4 mm in full width at half maximum. The final volumes were reconstructed into a matrix of 344 × 344 voxels of 2.0863 × 2.0863 mm in plane and a 2.0313-mm slice thickness and were denoted PETDIVIDE, PETCT, and PETDixon.
A k-fold cross-validation (k = 4) was performed to evaluate the proposed method using 28 Dixon and CT volume pairs from 19 subjects (using the subjects instead of the pairs, meaning the training set contained 15 subjects and the remaining 4 were part of the test set in each iteration). All pairs from the same subject were always in the same collection.
Data Analysis
Voxel- and region-based analyses were performed to assess the accuracy of the μ-maps and reconstructed PET images. Only voxels included in the pelvic area where the different μ-maps overlapped were used for comparison. Bland–Altman plots, bias, and variability Pearson correlation coefficients were calculated for all comparisons. Absolute relative changes (RCs) were defined as follows: Eq. 1where X is the AC method (DIVIDE or Dixon); IX corresponds to either the μ-maps (μDIVIDE or μDixon) or the PET images (PETDIVIDE or PETDixon); and IGS corresponds to the gold standard image (μCT or PETCT for μ-map and PET comparisons, respectively). Nonabsolute RCs were also calculated.
Regions of interest (ROIs) were defined as segmented tissues (fat, soft tissue, and bone) obtained by thresholding the Hounsfield units from the patient-specific CT image. Mean and maximum SUV normalized by weight was calculated for all the patients; all SUVs reported in this article are in g/mL.
Additionally, we simulated synthetic lesions using the PETSTEP approach (35). Briefly, 1-cm-diameter spheric lesions were defined in the prostate, rectum, pelvis, and spine. Using the original reconstructed PET images, new lesion images were generated by increasing the activity within the lesion 5-fold and setting the background to zero. Lesion sinograms were generated from these images as described by Berthon et al. (35), except that random and scatter events due to the lesion were neglected. The lesion and preexisting patient sinograms were combined and reconstructed as previously described.
Statistical Tests
Mean ± SD for μ-maps and reconstructed PET images were computed for all subjects. Paired-sample Wilcoxon signed rank-tests were performed to assess whether there were differences when correcting for attenuation using the CT-based (PETCT) and the MR-based (PETDIVIDE and PETDixon) methods. The same tests were performed for the analysis of the synthetic lesions. Statistical significance was considered when the P value was lower than 0.05.
RESULTS
The Hounsfield unit error was lower when using the pretrained weights from the brain database as opposed to initializing them from noise, showing a faster learning in the initial epochs and a slightly smaller final error (Supplemental Fig. 1). The number of training iterations also had an effect on the progressive pseudo-CT improvement (e.g., better bone delineation) at different stages (Fig. 2). Once the network is trained, the synthesis of a complete volume takes about 2 min using a NVIDIA Tesla K40 GPU.

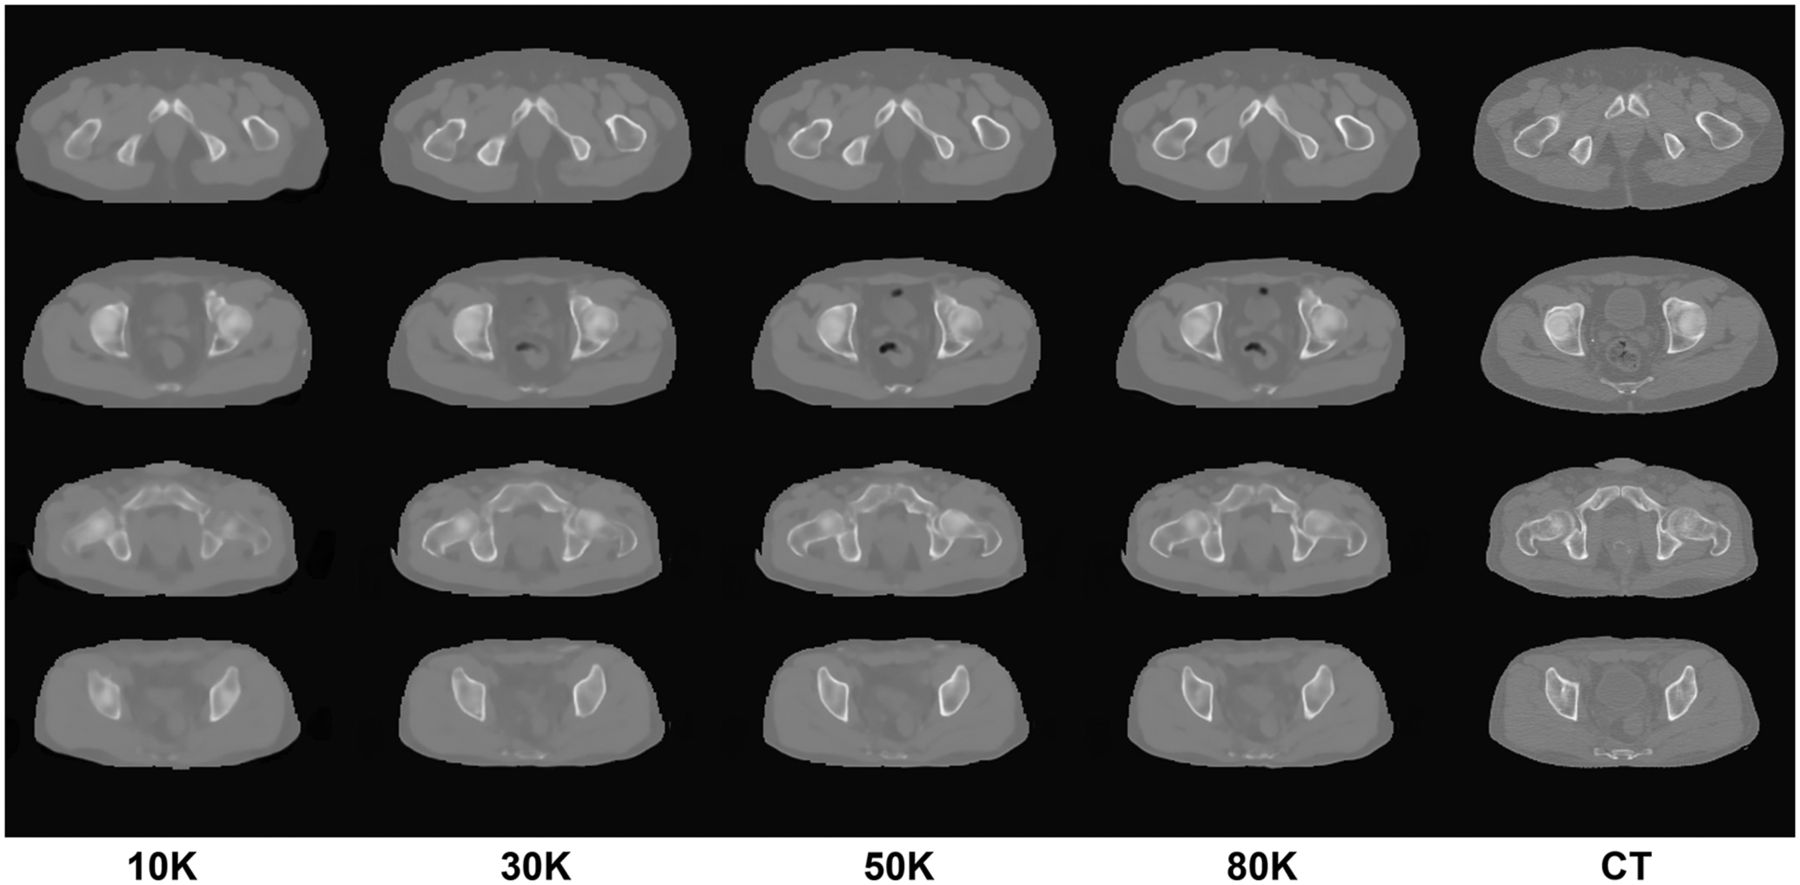
Examples of progression of pseudo-CT generation during training. Columns represent output of network after a certain number of training iterations. Corresponding real CT used as ground truth in shown in rightmost column.
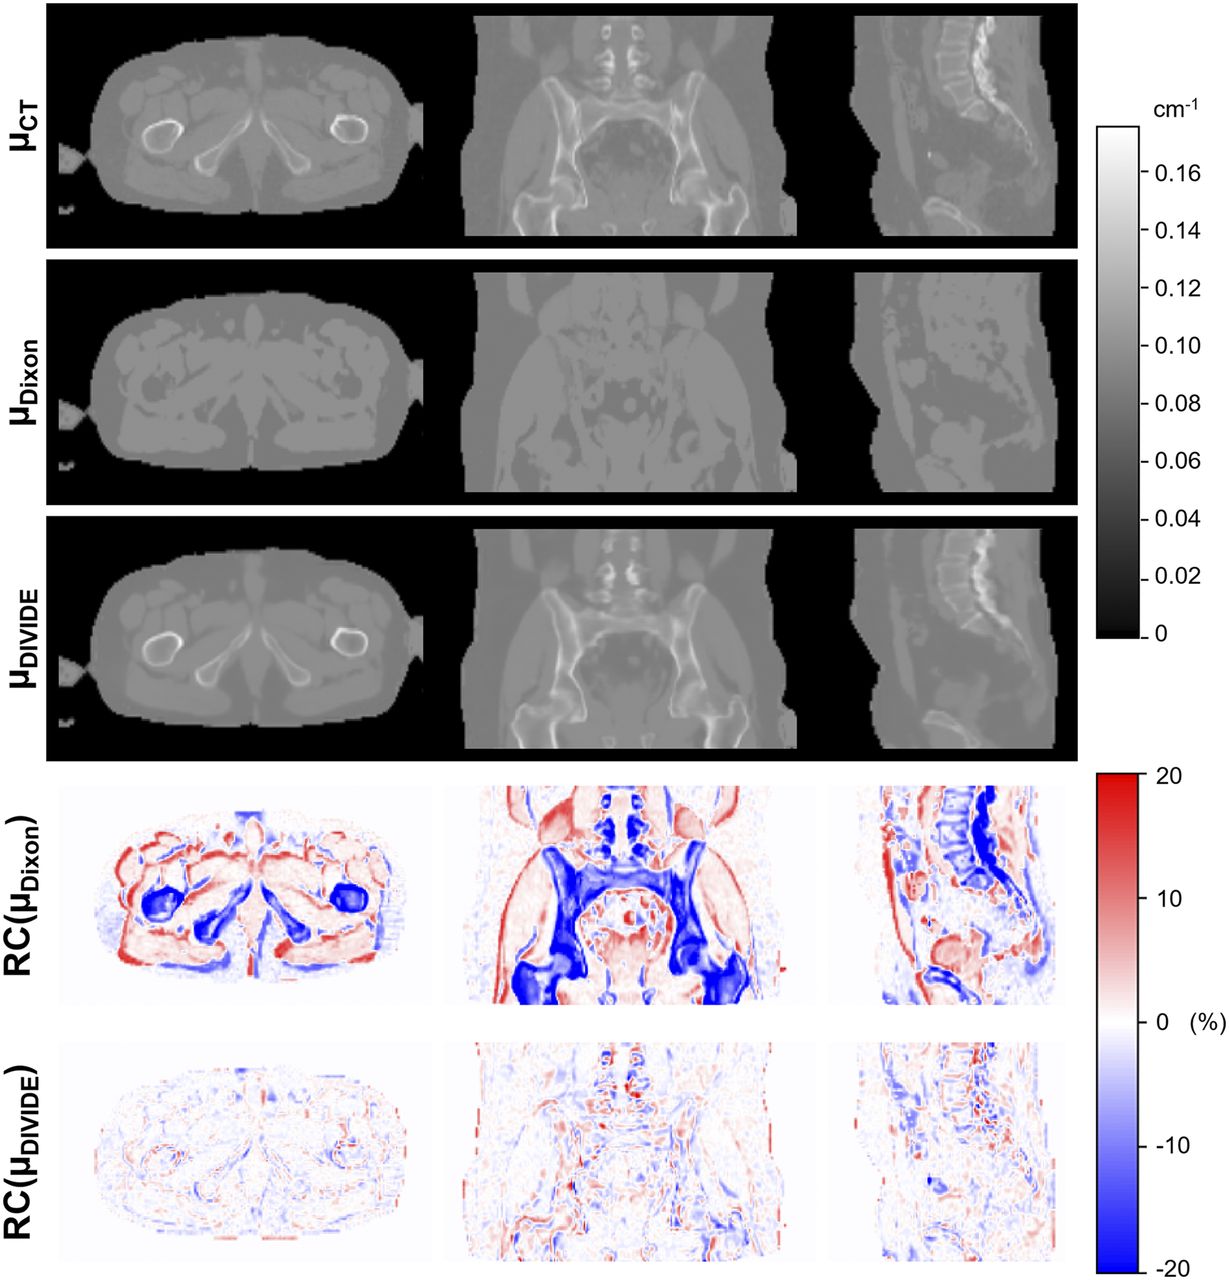
Figure 3 shows the μ-maps obtained using the 3 methods and the corresponding RC maps for a representative subject, demonstrating excellent correlation between μDIVIDE and μCT and noticeable misclassification of bone tissues in μDixon. The bone contours were accurately visualized in μDIVIDE, and the shape of the pelvis was estimated well despite the anatomic complexity and large interpatient variability.

Sagittal, coronal, and axial μ-maps of subject 02_01 (Supplemental Table 1) obtained using 3 different methods—μCT, μDixon, and μDIVIDE—as well as distribution of RC of μDixon and μDIVIDE compared with μCT.
The results of the quantitative voxel- and ROI-based analyses for all subjects are summarized in Table 1. Absolute mean RCs were lower for DIVIDE than for the Dixon-VIBE–based method in every ROI. Particularly, bone tissue demonstrated a statistically significant 3.4 times reduction of bias for DIVIDE. Nonabsolute values showed a similar trend. The SDs were almost 2 times smaller for DIVIDE than for the Dixon-VIBE–based method.
Voxel- and ROI-Based RCs for μ-Maps in Whole-Pelvis Area
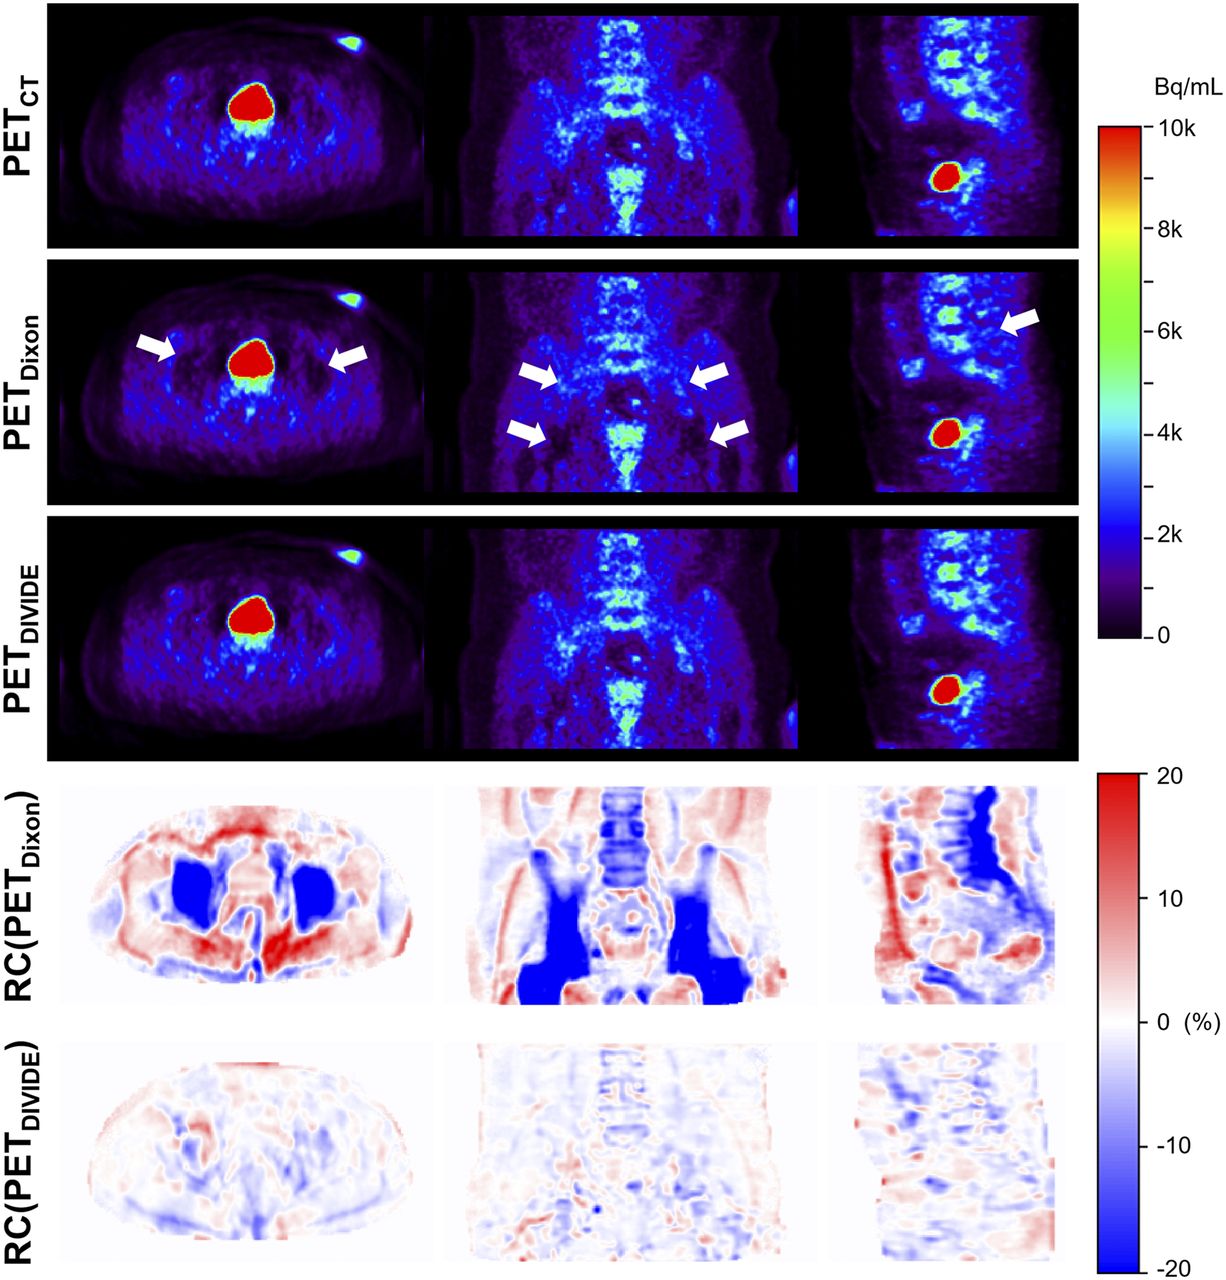
The PETDIVIDE images more closely resembled the PETCT images than the PETDixon images (Fig. 4). Some deviations could still be appreciated in the PETDIVIDE images, with the highest errors in the pelvis being near bone boundaries. However, the errors were lower than 2% on average.

Sagittal, coronal, and axial PET images of subject 02_01 (Supplemental Table 1) obtained using 3 different AC methods—PETCT, PETDixon and PETDIVIDE—as well as distribution of RC of PETDixon and PETDIVIDE compared with PETCT. Arrows point to areas where PETDixon exhibits noticeable PET signal underestimation.
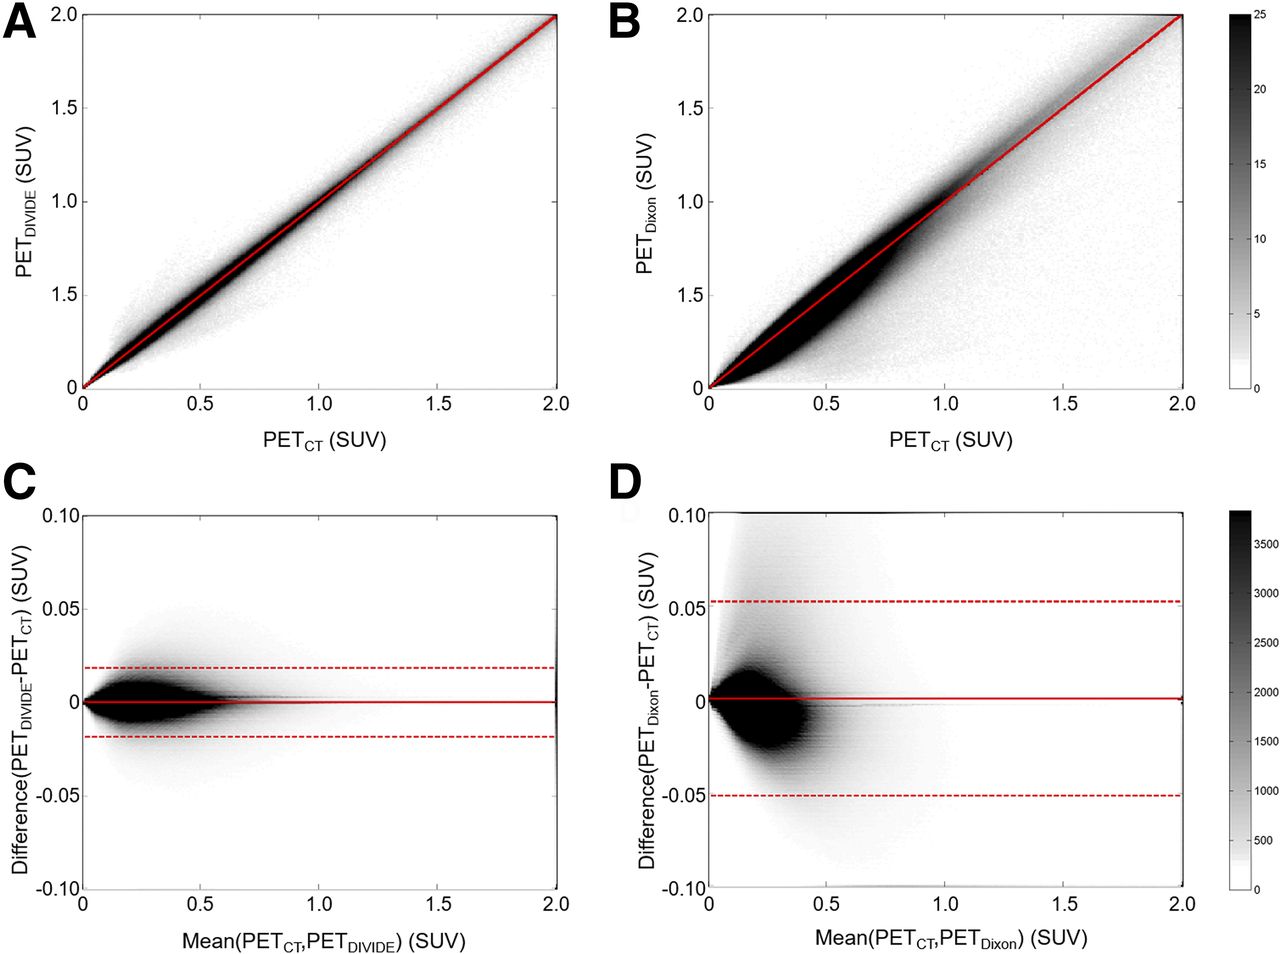
There was an excellent correlation between PETCT and PETDIVIDE (R2 = 0.9998, P < 0.01; Fig. 5). The Bland–Altman plot between PETCT and PETDIVIDE showed that the mean differences and variability were lower (mean PETCT–PETDIVIDE SUV, 0.0003; PETCT–PETDIVIDE SD, 0.0094; 95% confidence interval, [−0.0180,0.0188]) than the mean differences and variability between PETCT and PETDixon (mean PETCT–PETDixon SUV, 0.0006; PETCT–PETDixon SD, 0.0264; 95% confidence interval, [−0.0510,0.0524]); the difference between the proposed method and the ground truth tended to decrease as the average increased. The comparison of the Bland–Altman plots for the Dixon-VIBE–based and DIVIDE approaches showed that the proposed method is less biased.

Voxel-by-voxel correlation plots between PETCT and PETDIVIDE (A) and between PETCT and PETDixon (B), as well as Bland–Altman plots between PETCT and PETDIVIDE (C) and between PETCT and PETDixon (D), for all subjects. Gray scale bars show number of voxels within each element of 2D histogram. SUV units are g/mL.
ROI analysis showed that absolute mean RCs were lower than 2% for the DIVIDE method in every nonbone ROI (Table 2). A 6.75-times bias reduction in bone tissue was observed for DIVIDE compared with the Dixon-VIBE–based method, a difference that was statistically significant. Again, the nonabsolute values showed a similar trend, and a factor of 3.5 reduction in variability was observed in all cases considered, suggesting that the method is more precise.
Voxel- and ROI-Based RCs for PET Data in Whole-Pelvis Area
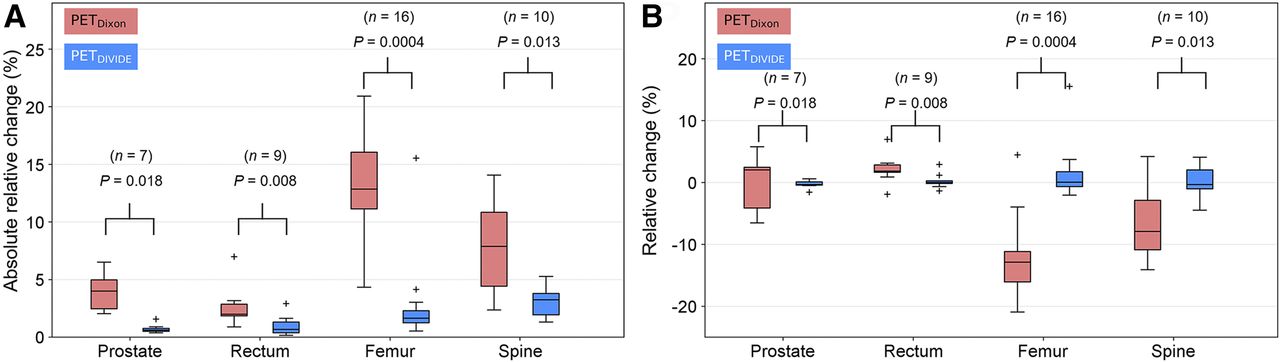
Figure 6 shows the results of the quantitative ROI-based analyses for the synthetic lesions. Statistically significant differences between the Dixon-VIBE–based and DIVIDE methods were observed when comparing the absolute mean RCs (Fig. 6A). Prostate lesions demonstrated a 6.9-times bias reduction for DIVIDE compared with the Dixon-VIBE–based method, whereas rectum lesions showed a 2.9-times bias reduction. As expected, the largest reduction in bias was observed for DIVIDE in the case of bone lesions. Femur and spine lesions revealed a 7.8- and a 2.4-times bias reduction, respectively. The improved accuracy compared with the Dixon-VIBE–based method was also evident when comparing the nonabsolute mean RCs (Fig. 6B).

Box-and-whisker plots of impact of Dixon-VIBE–based and DIVIDE-based AC on PET data quantification in synthetic lesions: absolute (A) and nonabsolute (B) mean RC. For each box, central mark is median, edges of box are 25th and 75th percentiles, whiskers extend to most extreme data points (1.5 × interquartile range), and outliers are plotted individually.
DISCUSSION
We have developed DIVIDE, a pelvis deep-learning pseudo-CT synthesis method, as a first step in a “DIVIDE and conquer” approach that could eventually prove successful in addressing the whole-body PET/MR AC challenge. DIVIDE avoids the oversimplification of most MR segmentation–based approaches and the limitations of atlas-based techniques. The qualitative (Figs. 4 and 5) and quantitative (Tables 1 and 2) analyses provided results similar to those obtained using the current standard (CT). The low RCs indicated that DIVIDE allows estimation of the patient-specific CT substantially better than the Dixon-VIBE–based one.
Some of the remaining differences observed at the bone boundaries could be due to inaccuracies in the MR–CT intrasubject registration, which is complicated by several factors: differences in patient positioning between the CT and MR scans, the complex anatomy of the pelvis, nonrigid displacement of the organs between acquisitions, and high freedom of movement of the bone structures. Additionally, there were mismatches between the MR and CT air-pocket locations; however, air pockets generated in our approach showed an acceptable correlation with the anatomy in the MR image, which is sometimes impaired by the information present in the CT image (Supplemental Fig. 2). Bland–Altman plots for the PET images also suggest that DIVIDE is closer to the CT image than the Dixon-VIBE–based method. The narrow 95% confidence interval for DIVIDE suggests it is more accurate than the Dixon-VIBE–based approach.
Several other deep-learning methods have previously been described for head (21,36) and, very recently, pelvis AC (26). Our findings agree with those reported by Leynes et al. (26). Their method (PETZeDD [zero-echo-time and Dixon deep pseudo-CT]) largely corrected underestimation of uptake within and around bony regions compared with the Dixon-based method (PETDixon), in line with the improvement we showed in this paper. Also, they reported a reduction of root-mean-square error from 6.10% for PETDixon to 2.85% for PETZeDD within soft-tissue regions, whereas we report a change in RC from 6.71% for PETDixon to 1.83% for PETDIVIDE in the same region. The underestimation bias was reduced by a factor of 3 and the SD was reduced by a factor of 2 in the PETZeDD; we reduced that bias by a factor of 11.3 and the SD by a factor of 3.4 in the PETDIVIDE.
Compared with the ZeDD-CT approach, the DIVIDE method presents several advantages: relying on only the standard Dixon-VIBE images currently used for AC, decreasing the scanning time, and allowing for retrospective generation of μ-maps from already acquired Dixon-VIBE data. Moreover, DIVIDE is completely automated and uses the whole image (as opposed to patches) to reduce potential boundary artifacts. On the other hand, the ZeDD-CT approach (26) might be more accurate because it can extract more information about air pockets from the zero-echo-time image.
Our study had several limitations. First, our training set was relatively small and comprised only subjects above 44 y old. Further improvement of the current model could be achieved by increasing the number of training sets and fine-tuning the bone and weight parameters or training the network with the new higher-resolution CAIPIRINHA-3-dimensional-Dixon-VIBE sequence. Second, as our subjects were above 44 y old, the direct application of the proposed method to pediatric patients is difficult because of differences in anatomy and bone densities. Third, we have assessed the impact of our method on the quantification of only a limited number of synthetic pelvic lesions. Finally, although we obtained encouraging results for the subjects who underwent repeated examinations, the reproducibility of our method needs to be properly assessed.
CONCLUSION
We described the development and initial validation of DIVIDE, a deep-learning approach to estimate pelvis pseudo-CT from standard Dixon-VIBE images to be used for AC in integrated PET/MRI scanners. We showed that the proposed method introduces only minimal bias compared with the CT-based approach, the current standard for AC.
DISCLOSURE
This project was partially supported by Real Colegio Complutense at Harvard University Research Fellowships, project DPI2015-68664-C4-2-R of the Spanish Ministry of Economy and Innovation, and NIH-NCI grant 1R01CA218187-01A1. No other potential conflict of interest relevant to this article was reported.
Acknowledgments
We thank NVIDIA Corporation for donating the Tesla K40 and the Titan X Pascal GPUs used for this research.
Footnotes
Published online Aug. 30, 2018.
- © 2019 by the Society of Nuclear Medicine and Molecular Imaging.
REFERENCES
- Received for publication February 6, 2018.
- Accepted for publication August 23, 2018.


Jump to section
Related Articles
Cited By...
- Generative Adversarial Network-Enhanced Ultra-Low-Dose [18F]-PI-2620 {tau} PET/MRI in Aging and Neurodegenerative Populations
- Evaluation of Deep Learning-Based Approaches to Segment Bowel Air Pockets and Generate Pelvic Attenuation Maps from CAIPIRINHA-Accelerated Dixon MR Images
- PET/MRI, Part 2: Technologic Principles
- Machine Learning in Nuclear Medicine: Part 2--Neural Networks and Clinical Aspects
- Summary of the First ISMRM-SNMMI Workshop on PET/MRI: Applications and Limitations
- Intelligent Imaging: Artificial Intelligence Augmented Nuclear Medicine