


Abstract
Accurate quantification of uptake on PET images depends on accurate attenuation correction in reconstruction. Current MR-based attenuation correction methods for body PET use a fat and water map derived from a 2-echo Dixon MRI sequence in which bone is neglected. Ultrashort-echo-time or zero-echo-time (ZTE) pulse sequences can capture bone information. We propose the use of patient-specific multiparametric MRI consisting of Dixon MRI and proton-density–weighted ZTE MRI to directly synthesize pseudo-CT images with a deep learning model: we call this method ZTE and Dixon deep pseudo-CT (ZeDD CT). Methods: Twenty-six patients were scanned using an integrated 3-T time-of-flight PET/MRI system. Helical CT images of the patients were acquired separately. A deep convolutional neural network was trained to transform ZTE and Dixon MR images into pseudo-CT images. Ten patients were used for model training, and 16 patients were used for evaluation. Bone and soft-tissue lesions were identified, and the SUVmax was measured. The root-mean-squared error (RMSE) was used to compare the MR-based attenuation correction with the ground-truth CT attenuation correction. Results: In total, 30 bone lesions and 60 soft-tissue lesions were evaluated. The RMSE in PET quantification was reduced by a factor of 4 for bone lesions (10.24% for Dixon PET and 2.68% for ZeDD PET) and by a factor of 1.5 for soft-tissue lesions (6.24% for Dixon PET and 4.07% for ZeDD PET). Conclusion: ZeDD CT produces natural-looking and quantitatively accurate pseudo-CT images and reduces error in pelvic PET/MRI attenuation correction compared with standard methods.
Reproducible quantification of radiotracer update is central to treatment response and is typically reported as SUV (1,2). Accurate quantification of uptake depends on accurate attenuation correction, which is a major challenge in PET/MRI systems. Uptake quantification is especially important in comparisons among different PET/CT and PET/MRI systems, among different vendor systems, and even among different sets of reconstruction parameters on the same system. In PET/CT, 511-keV photon attenuation coefficients can readily be estimated from CT Hounsfield units (HU) using a bilinear model (3); however, in PET/MRI, MRI measures nuclear spin properties and lacks photon attenuation information. Thus, it is difficult to infer attenuation information from the MR image intensities, often resulting in inaccurate attenuation correction and associated errors in the PET uptake estimates.
Current commercially available MR-based attenuation correction (MRAC) methods for body PET imaging use a fat and water map derived from a 2-echo Dixon MRI sequence in which bone is misclassified as soft tissue (4). Conventional MRI approaches do not detect any signal from bone because of its short T2* relaxation time (∼0.4 ms (5–7)). However, estimation of bone attenuation is important, particularly in pelvic PET/MRI because of the significant amount of bone, which has the largest photon attenuation among all tissue types. Misclassifying bone in the attenuation coefficient map leads to a large underestimation of PET uptake in and around bone (8–11).
Atlas-based methods, which are commonly used for MRAC in the brain, include bone by registering to an atlas generated from transmission scans (12,13) or CT scans (14–16). These methods have been enhanced by the addition of a local pattern-recognition algorithm (15) or a dedicated pulse sequence (17,18). The challenge of atlas-based methods is that, by relying on an atlas, they do not completely account for patient-specific variations in bone structure and density.
To capture patient-specific bone information for MRAC, methods based on ultrashort-echo-time (19–23) and zero-echo-time (ZTE) (11,24–26) pulse sequences have been proposed. Transverse relaxation rate maps have been measured using an ultrashort echo time to estimate continuous-valued attenuation coefficients for bone; however, these methods can fail in regions with large magnetic susceptibility differences, such as the sinuses, which may be misclassified as bone. ZTE MRI has also demonstrated excellent bone depiction; an inversely proportional relationship between soft-tissue–normalized proton-density–weighted ZTE and CT HU values has been found for the head (24–26) and the pelvis (11). However, soft tissue and bone have different corresponding conversion maps, and segmentation was therefore necessary to determine the appropriate values to assign to each region.
Deep learning is a machine learning technique that has been demonstrated to be well suited for processing low-level noisy data such as natural images (27) and can classify and segment medical images (28). Deep learning has also been used for image transformation tasks (29), and the MRAC problem can be posed as transforming MR images into pseudo-CT images, as has been demonstrated using T1- or T2-weighted images (30,31).
Machine learning using artificial neural networks has been applied to generate attenuation coefficient maps (32). The work used a 3-layer artificial neural network with 154 total parameters and a 6-voxel-neighborhood input. In contrast, deep learning using deep convolutional neural networks has several layers (typically more than 10) and millions of parameters. With many more layers in deep learning, the input can effectively cover the whole image.
In this paper, we introduce a patient-specific multiparametric MRI method consisting of Dixon MRI and proton-density–weighted ZTE MRI to directly synthesize pseudo-CT images with a deep learning model. Dixon MRI provides patient-specific continuous-valued attenuation coefficients in soft tissues (4), ZTE MRI provides the same in bone (11,24–26), and deep learning allows a direct and fully automated conversion of MR images to pseudo-CT images (30,31). In this work, we applied this ZTE and Dixon deep pseudo-CT (ZeDD CT) to PET image reconstruction and evaluated the impact on radiotracer uptake estimation.
MATERIALS AND METHODS
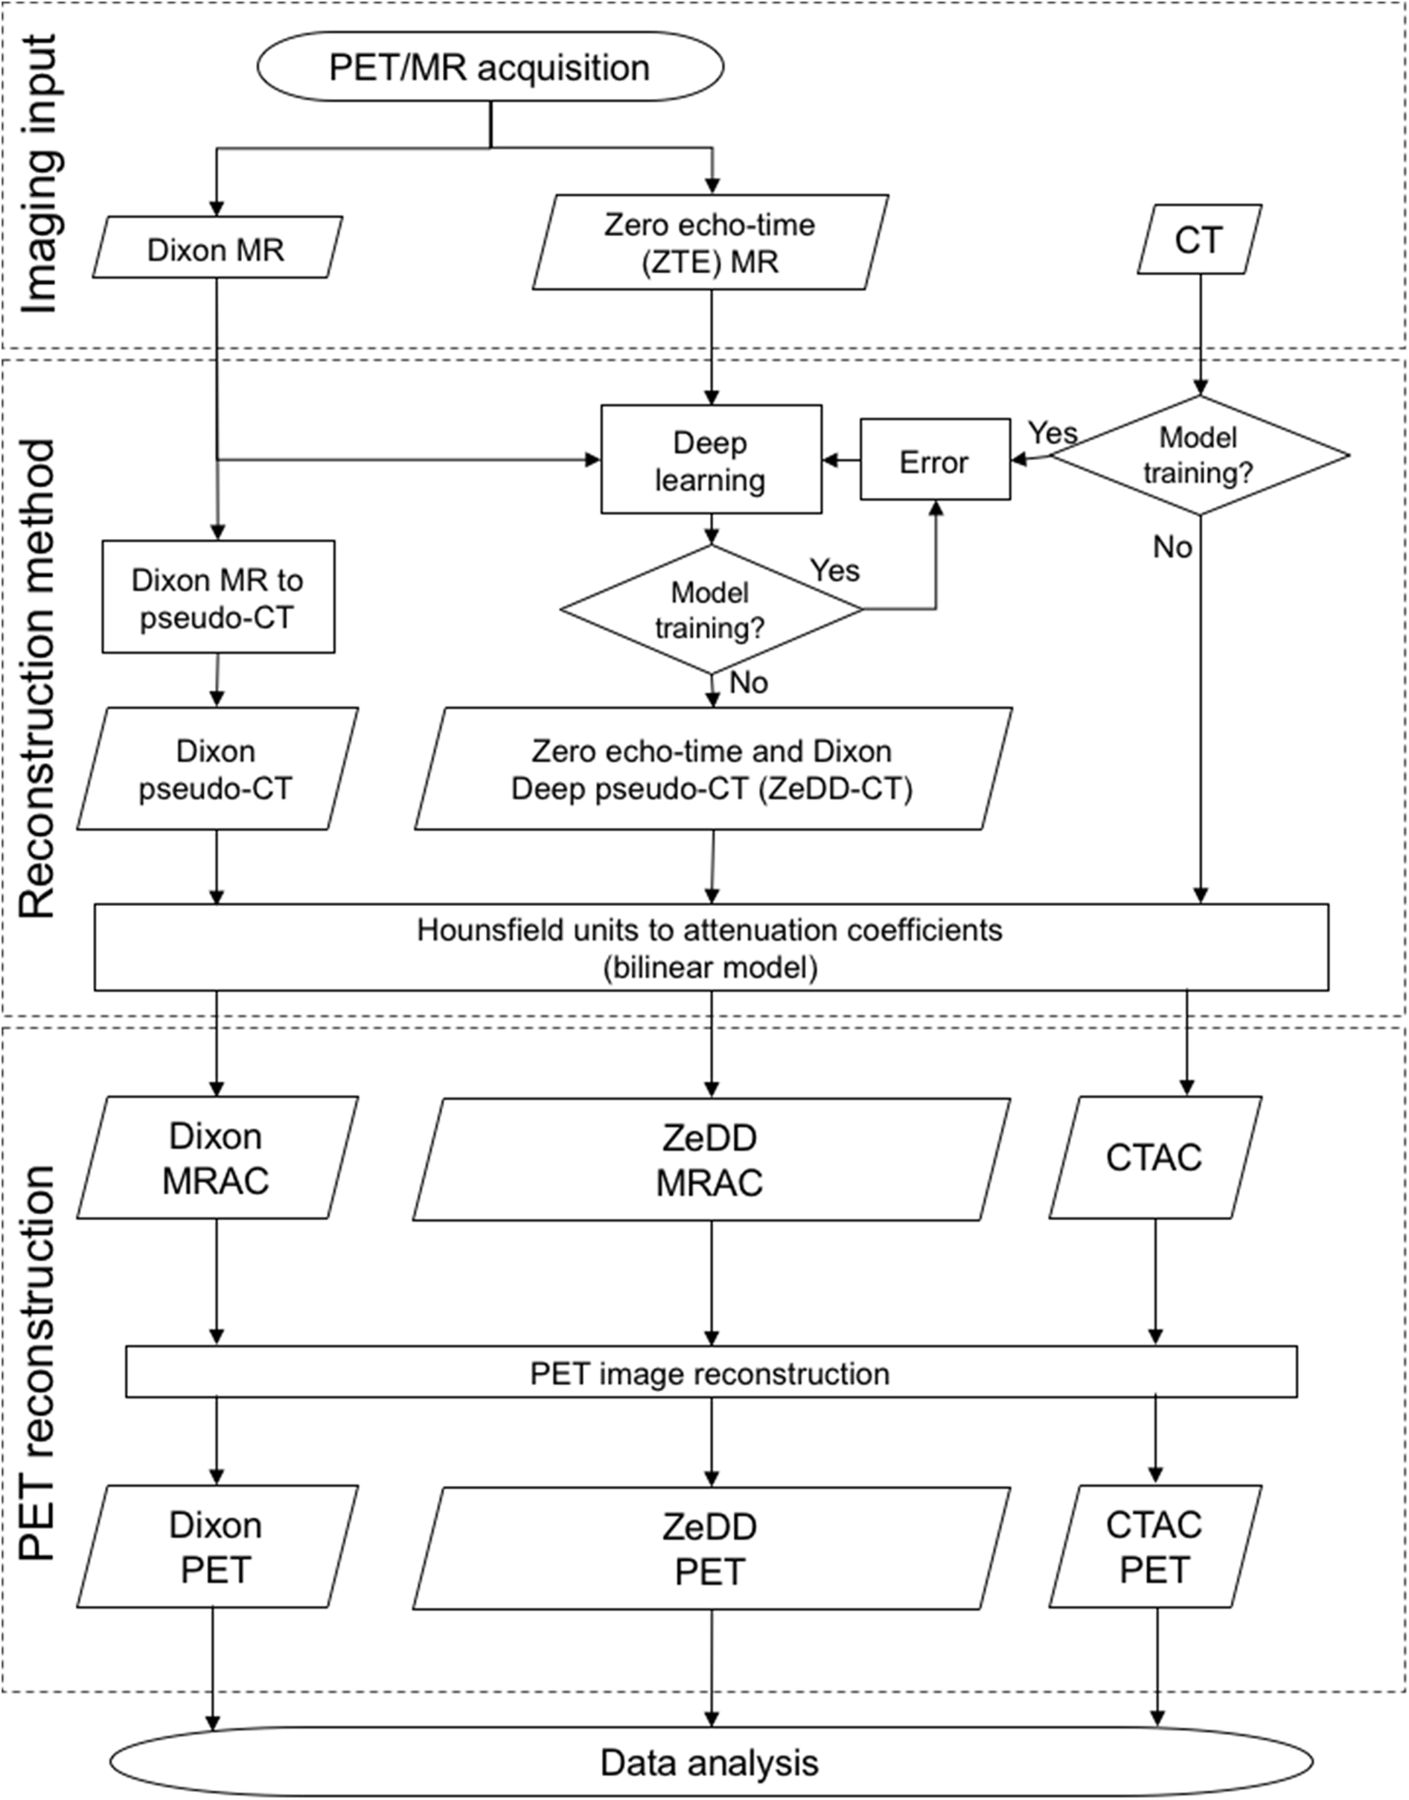
An overview of the methodology is shown in Figure 1. A deep convolutional neural network was trained with Dixon and ZTE MRI to generate the ZeDD CT and a Dixon pseudo-CT (4). The different pseudo-CT images were compared with the ground-truth CT image, and the pseudo-CT and CT images were converted to attenuation coefficient maps with a bilinear model (3). The different maps were then used for PET image reconstruction, and data analysis was performed.

Overview of methodology. CTAC = CT attenuation correction.
Deep Learning
Deep Convolutional Neural Network
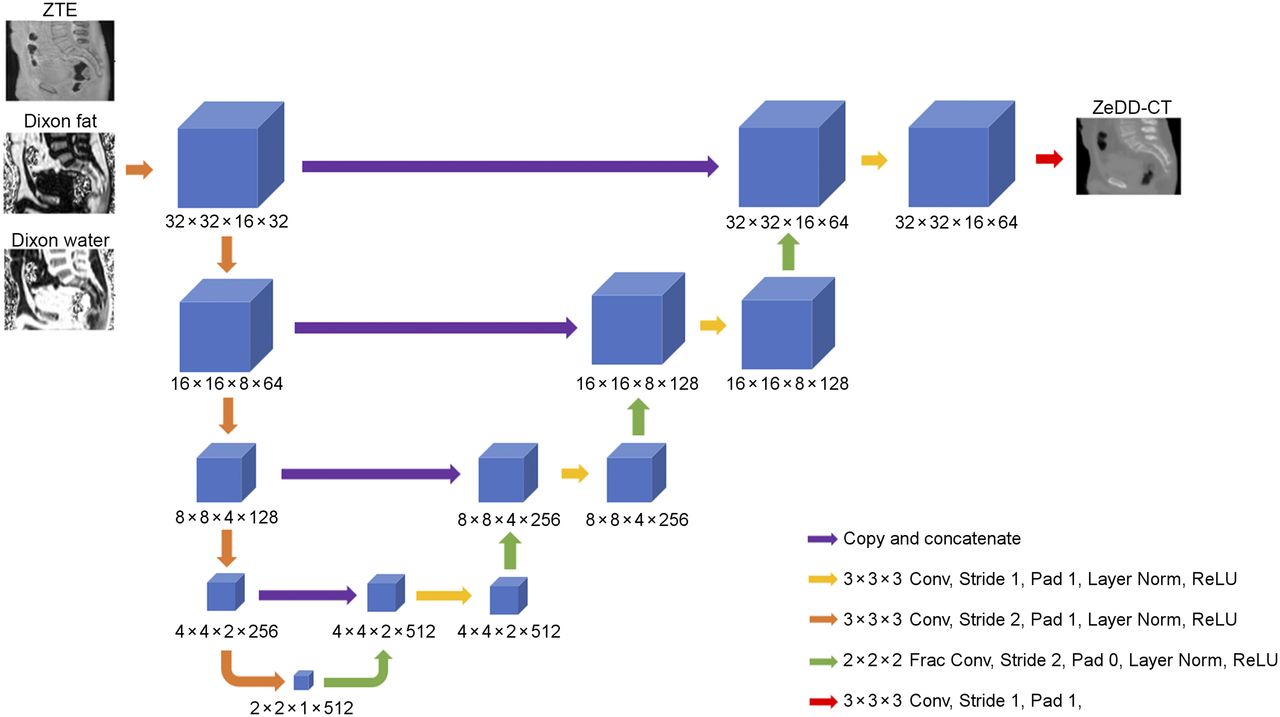
The deep convolutional neural network was based on the U-net architecture (33), composed of 13 layers. A graphical schematic of the model is shown in Figure 2. The model used convolutions, fractionally strided convolutions (34), layer normalization (35), and rectified linear unit activation functions. The TensorFlow (http://www.tensorflow.org) software package was used to implement and train the neural network.

Deep learning architecture based on U-net (33). Conv = convolutions; Frac Conv = fractionally strided convolutions; Norm = normalization; ReLU = rectified linear unit; ZTE = zero echo time.
Inputs to the model were volume patches of the following dimensions: 32 pixels × 32 pixels × 16 pixels × 3 channels at the Dixon MR image resolution. The first, second, and third channels were a volume patch of the bias-corrected and soft-tissue–normalized proton-density ZTE image, Dixon fractional fat image, and Dixon fractional water image, respectively, at the same spatial location. The ZTE images were resampled with linear interpolation to have the same spatial resolution as the Dixon images. The output was the corresponding ZeDD CT image with dimensions of 32 pixels × 32 pixels × 16 pixels × 1 channel. The network structure leads to an effective input receptive field of at least 19 pixels × 19 pixels × 19 pixels (6,859-pixel neighborhood).
Model Training
Model training was performed with an L1 loss, gradient difference loss (GDL), and Laplacian difference loss (LDL) as follows:


where  is the ground-truth CT image patch and
  is the output ZeDD CT image patch. The gradient difference loss and Laplacian difference loss enforce image sharpness. The Adam optimizer (36) (learning rate = 0.001 halved every 2,000 iterations,
  ) was used to train the neural network. An L2 regularization (
 on the weights of the network was used. The method of He et al. (37) was used to initialize the weights. A mini-batch of 64 volumetric patches was used for training on a single GTX Titan X Pascal (NVIDIA Corp.) graphics processing unit. There are 6 million parameters that are determined with the training process.
Random crops were extracted from the MR and CT images: to select whether a patch would be used for training, the mean HU value of the corresponding ground-truth CT patch was measured. The probability that the patch would be used for training was based on a sigmoidal probability distribution:
This was done to reduce the number of patches containing all air. Model training takes approximately 6 hours to reach stability, which occurred at approximately 46,000 iterations. At that point, the training was stopped.
ZeDD CT Generation
Sequential overlapping 32 pixel × 32 pixel × 16 pixel patches at intervals of 8 pixels × 8 pixels × 4 pixels were extracted from the MR images and were input to the model. The overlapping patches of the model output were merged by taking their mean at each voxel location. The ZeDD CT generation took approximately 3 min with the single GTX Titan X Pascal graphics processing unit.
Patient Studies
The study was approved by the local Institutional Review Board, and all patients signed a written informed consent form.
Patients with pelvic lesions were scanned using an integrated 3-T time-of-flight PET/MRI system (SIGNA PET/MR; GE Healthcare) (38). The population consisted of 26 patients (mean age ± SD, 58.1 ± 14.2 y; 15 men, 11 women): 10 patients were used for model training, and 16 patients were used for evaluation. The patient demographics, diagnoses, and PET radiotracers used for the evaluation dataset are summarized in Supplemental Table 1 (supplemental materials are available at http://jnm.snmjournals.org).
By extracting overlapping patches from the images of the 10 training datasets, roughly 600,000 examples were used train the neural network.
PET/MRI
The PET images were acquired with 2 radiotracers: 18F-FDG and 68Ga-PSMA-11. PET had a 600-mm transaxial field of view (FOV) and a 25-cm axial FOV, with a time-of-flight timing resolution of approximately 400 ps. The imaging protocol included a 6-bed-position whole-body PET/MRI acquisition, as well as a dedicated pelvic PET/MRI acquisition. The PET data were acquired for 15 min during the dedicated pelvic acquisition, during which time clinical MRI sequences were acquired, as well as the following MRAC sequences: Dixon MR (FOV, 500 × 500 × 312 mm; resolution, 1.95 × 1.95 mm; slice thickness, 5.2 mm; slice spacing, 2.6 mm; scan time, 18 s) and ZTE MR (cubical FOV, 340 × 340 × 340 mm; isotropic resolution, 2 × 2 × 2 mm; readout duration, 1.36 ms; flip angle, 0.6°; hard radiofrequency pulse, 4 μs; scan time, 123 s). The applied Dixon MRI, ZTE MRI, and PET image reconstruction parameters (FOV, 600 mm; iterations, 2; subsets, 28; matrix size, 192 × 192; slices, 89; slice thickness, 2.78 mm) were the same as in our previous work (11). Only data from the dedicated pelvic PET/MRI acquisition were used for this study.
CT
Helical CT images of the patients were acquired separately on different machines (Discovery STE [GE Healthcare], Discovery ST [GE Healthcare], Biograph 16 [Siemens], Biograph 6 [Siemens], Gemini TF 16 [Philips], Gemini TF 64 [Philips], and Somatom Definition AS [Siemens]) and were coregistered to the MR images using the method outlined below. Multiple CT protocols were used with variable parameter settings (110–130 kVp; 30–494 mA; rotation time, 0.5 s; pitch, 0.6–1.375; 11.5–55 mm/rotation; axial FOV, 500–700 mm; slice thickness, 3–5 mm; matrix size, 512 × 512). Preprocessing consisted of filling in bowel air with soft-tissue HU values (because of the differences in bowel air distribution) and copying arms from the Dixon-derived pseudo-CT (because the CT scan was acquired with arms up); more details can be found in section 2.B.2 of our previous work (11).
Image Preprocessing and Registration
The same methodology as in our previous work (11) was used for MRI and CT image preprocessing and coregistration and for data preparation for PET image reconstruction. MRI and CT image pairs were coregistered using the SyN diffeomorphic deformation model of the ANTs (39) registration package, with combined mutual information and cross-correlation metrics.
Data Analysis
Standard image error analysis and lesion-based analysis were performed as in our previous work (11): the average (μ) and SD (σ) of the error and root-mean-squared error (RMSE) were computed over voxels that met a minimum signal amplitude or signal-to-noise criterion. Global HU and PET SUV comparisons were performed only for voxels with amplitudes greater than −200 HU in the ground-truth CT image to exclude air, and a similar threshold of greater than 0.08 cm−1 in the CT attenuation correction was used for comparison of attenuation correction maps. In addition to standard analysis, summary analysis was performed by coregistering each patient CT image to a reference CT image (“atlas space”) using the SyN diffeomorphic nonrigid registration model of ANTs, with cross-correlation metrics. The reference CT data were manually selected from the dataset of a patient who had a medium-sized body. This atlas space transformation was applied to the pseudo-CT and CT images, the attenuation correction maps, the PET reconstructions, and the respective difference images with ground-truth. Bone and soft-tissue lesions were identified by a board-certified radiologist. Bone lesions were defined as lesions inside bone or with boundaries within 10 mm of bone (9). A Wilcoxon signed-rank test was used to compare the SUVmax biases with the CT attenuation correction of individual lesions.
To directly compare with our previous work, the data analysis methodology described above was performed on a subset population that was additionally processed using the hybrid ZTE/Dixon method (11). A Friedman test with a Tukey post hoc test was used for multiple-comparison testing between the Dixon, hybrid ZTE/Dixon, and ZeDD attenuation correction methods.
RESULTS
ZeDD CT Images
Sample ZeDD CT images are shown in Figure 3. The bone depiction in the femur was comparable to that in the ground-truth CT images, whereas there were difficulties in depicting the finer bone structure in the spine. The error across all patients was −36 ± 130 HU and −12 ± 78 HU for Dixon pseudo-CT and ZeDD CT, respectively. The error for each patient is shown in Supplemental Figure 1.
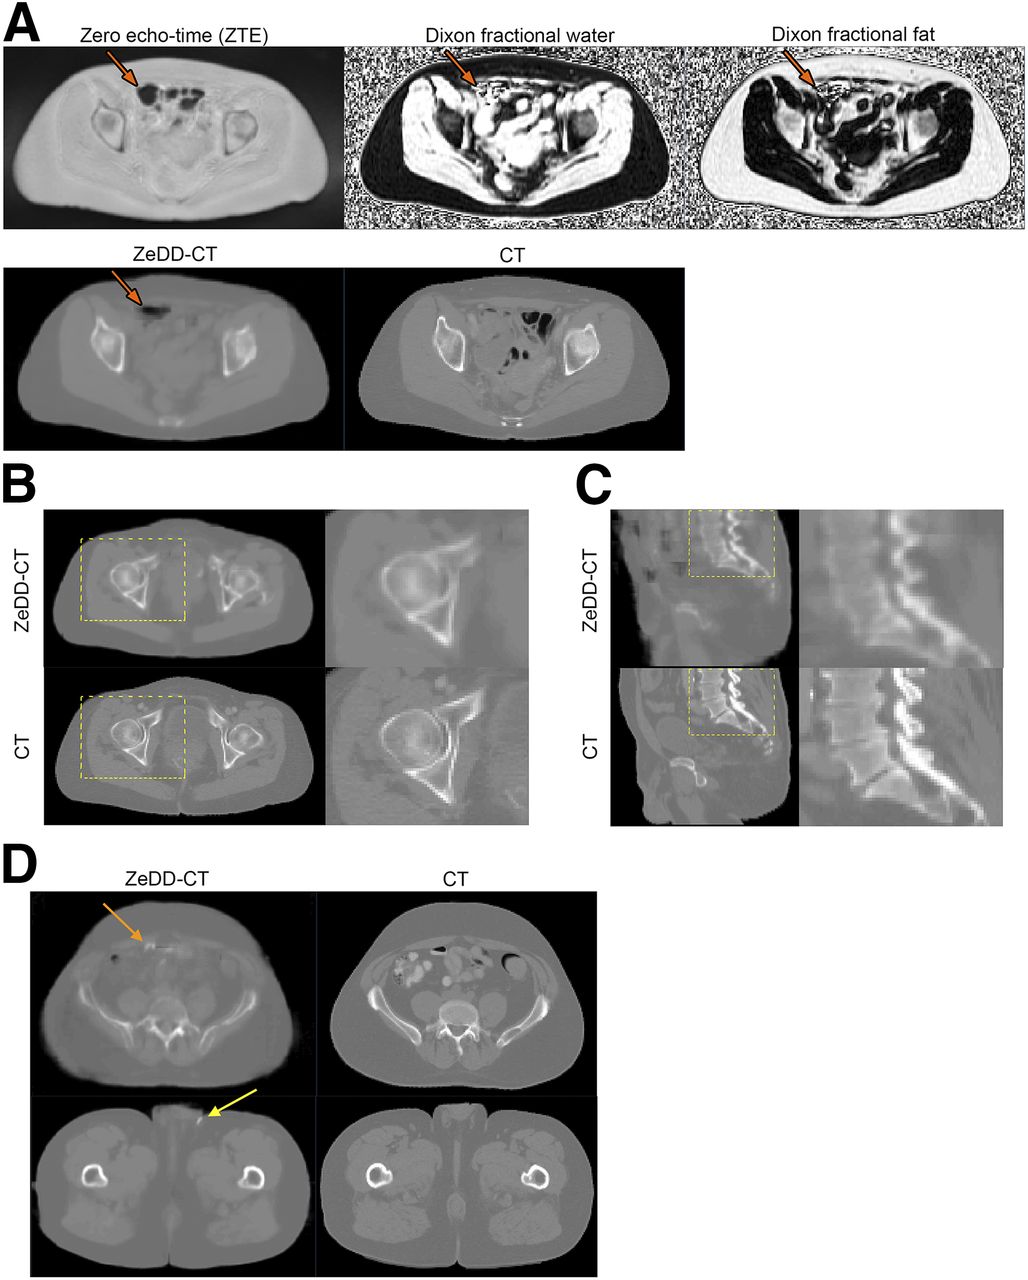
Qualitative comparison of ZeDD CT with ground-truth CT for several patients. (A) Corresponding MR images, with arrows pointing to region of bowel air that is captured in ZeDD CT. Differences in bowel air distribution between ZeDD CT and ground-truth CT are due to scans being taken at different times. (B and C) Closer inspection of bone depiction quality, with boxes indicating zoomed-in regions. (D) Small artifacts that were assigned bone HU values: bowel air (orange arrow) and skin folds (yellow arrow).
Attenuation Coefficient Map Analysis
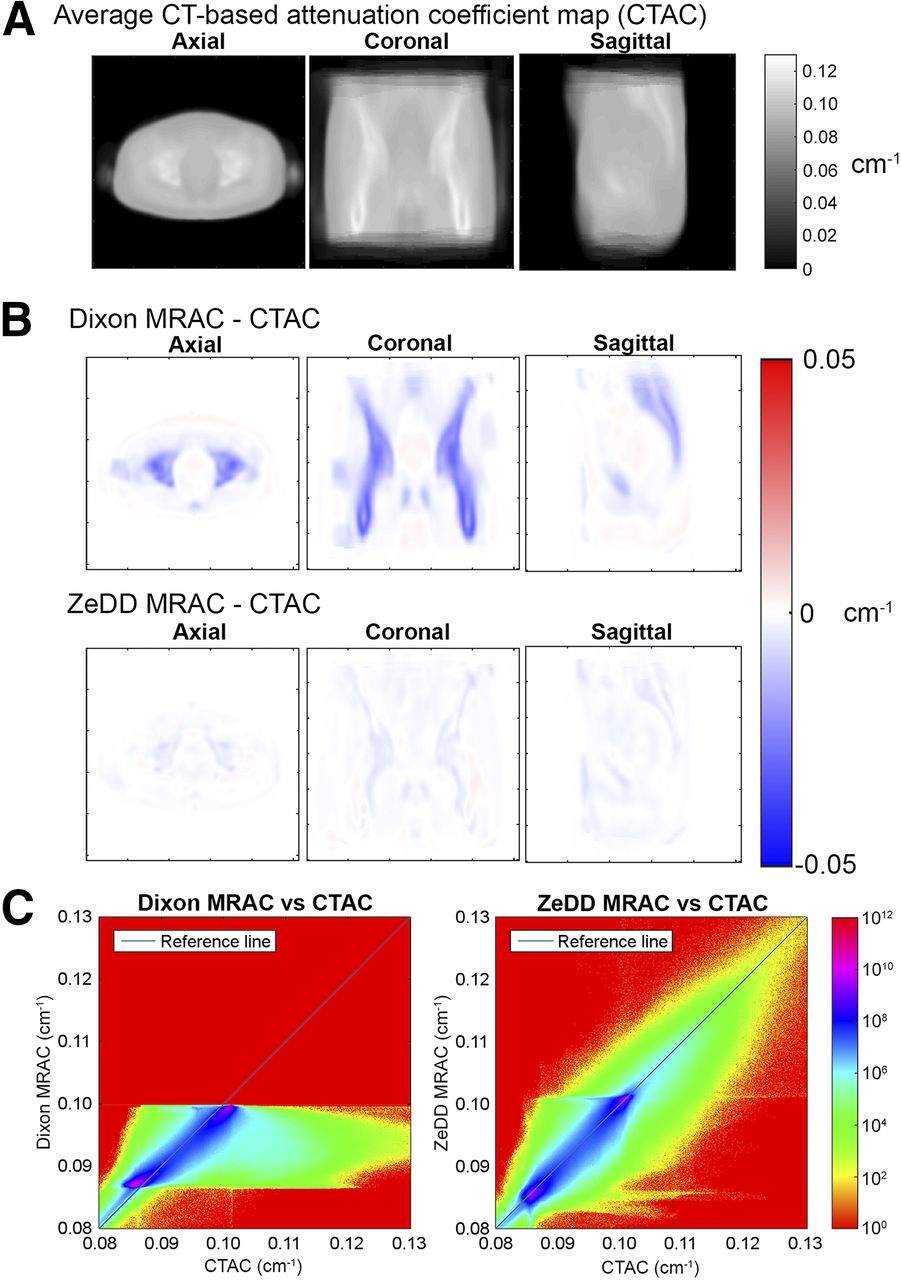
Difference images of the attenuation coefficient maps in atlas space are shown in Figure 4. There was significant bone underestimation in Dixon MRAC, whereas the error was largely corrected in ZeDD MRAC. The RMSE across all patients was 5.71% (μ = −2.21%, σ = 5.27%) and 2.59% (μ = −0.69%, σ = 2.50%) for Dixon MRAC and ZeDD MRAC, respectively. The mean underestimation was reduced by a factor of 3 when ZeDD MRAC was used. Additionally, the SD was reduced by a factor of 2. The error for each patient is shown in Supplemental Figure 2.

Quantitative comparison of Dixon MRAC and ZeDD MRAC with CT attenuation correction in atlas space. (A) Average (reference) CT attenuation correction in atlas space. (B) Average difference maps of Dixon MRAC and ZeDD MRAC with CT attenuation correction. (C) Joint histograms in log scale showing correlation of attenuation coefficients across whole volume from all patients. Dixon MRAC is limited to values of 0.08–0.1 cm−1 because only soft tissue is considered in this approach.
PET Image Analysis
Difference images of the reconstructed PET images in atlas space are shown in Supplemental Figure 3. The trend was similar to the attenuation correction maps: Dixon PET underestimated the uptake within and around bony regions, and this error was largely corrected in ZeDD PET. Additionally, uptake within soft-tissue regions was slightly underestimated. Across all patients, the RMSE was 6.10% (μ = −3.40%, σ = 5.07%) and 2.85% (μ = −1.11%, σ = 2.62%) for Dixon PET and ZeDD PET, respectively. The underestimation bias was reduced by a factor of 3, and the SD by a factor of 2, when ZeDD MRAC was used. The error for each patient is shown in Supplemental Figure 4.
Lesion Analysis
Lesion analysis data are summarized in Figure 5. There were 30 bone lesions and 60 soft-tissue lesions across the 16 patient datasets. The RMSE in PET quantification decreased by a factor of 4 for bone lesions (10.24% [ ] for Dixon PET and 2.68% [
 ] for ZeDD PET;
  ) and by a factor of 1.5 for soft-tissue lesions (6.24% [
 ] for Dixon PET and 4.07% [
 ] for ZeDD PET;
  ). We show the spatial distribution of lesion errors in Supplemental Figure 5.
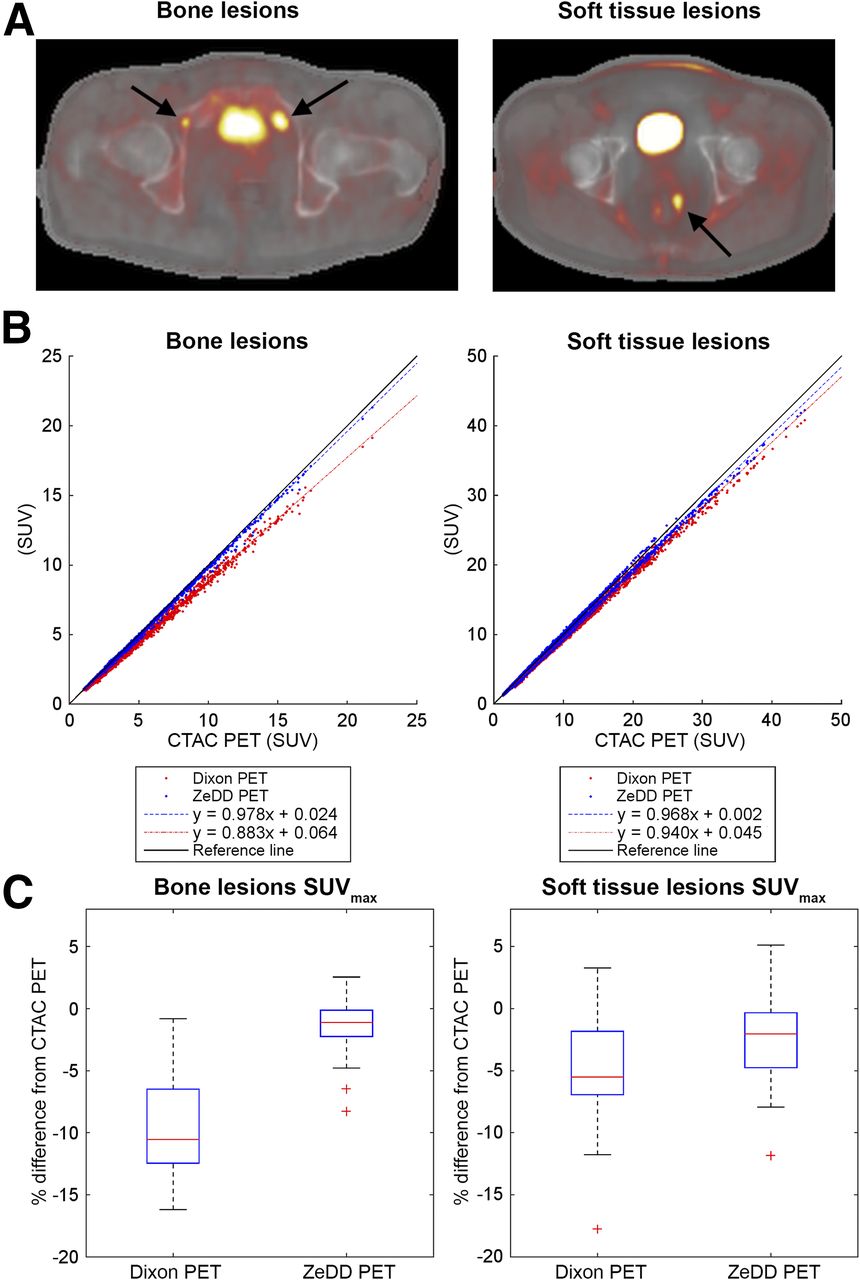
Lesion-based analysis. (A) SUVmax was measured in bone lesions and soft-tissue lesions (arrows), with example PET overlays on ZeDD CT. (B and C) Scatterplots (B) and box plots (C) show that deep learning–based MRAC method with ground-truth CT attenuation correction was more accurate than Dixon-based MRAC.
Hybrid ZTE/Dixon Comparison
Comparisons across a subset of 6 patients between Dixon, hybrid ZTE/Dixon, and ZeDD is summarized in Supplemental Figure 6. The whole-volume RMSE in attenuation coefficient maps was 6.05% ( , 6.43% (
 , and 2.18% (
 for Dixon, hybrid ZTE/Dixon, and ZeDD, respectively. The whole-volume RMSE in PET images was 6.73% (
 , 5.78% (
 , and 2.34% (
 for Dixon, hybrid ZTE/Dixon, and ZeDD, respectively. The bone lesion (n = 17) RMSE was 11.27% (
 , 2.85% (
 , and 1.59% (
 for Dixon, hybrid ZTE/Dixon, and ZeDD, respectively; and the soft-tissue lesion (n = 20) RMSE was 6.67% (
 , 2.82% (
 , and 3.41% (
 for Dixon, hybrid ZTE/Dixon, and ZeDD, respectively. For bone lesions, hybrid ZTE/Dixon and ZeDD were significantly different from Dixon (p < 0.001 and p < 0.001, respectively), and no significant difference was found between hybrid ZTE/Dixon and ZeDD (p = 0.27); for soft-tissue lesions, hybrid ZTE/Dixon and ZeDD were significantly different from Dixon (p < 0.001 and p < 0.001, respectively), and no significant difference was found between hybrid ZTE/Dixon and ZeDD (p = 0.9863).
DISCUSSION
This paper has presented the use of ZeDD CT—a deep convolutional neural network to generate pseudo-CT images using combined ZTE and Dixon MRI—for attenuation correction in PET/MRI and has analyzed its performance in pelvic lesions. To our knowledge, this is the first work to evaluate the performance of pseudo-CT images generated from deep learning in the context of pelvic PET/MRI attenuation correction, as well as being the first to use patient-specific multiparametric MRI with deep learning to generate pseudo-CT images. The ZeDD method demonstrated improved quantitative uptake for pelvic lesions over the Dixon-based method.
Accurate quantification of PET uptake will likely be important for precision medicine, as it provides more reliable comparisons across scanners, correlation of imaging parameters, and accurate monitoring of treatment response. Although in some cases the attenuation correction error may be systematic and reproducible for the same patient, a patient may be scanned on different machines within their clinical lifetime. Accurate and precise uptake estimation is also important when developing models that correlate PET parameters with quantitative MR parameters such as from diffusion-weighted imaging. ZeDD CT improves not only the accuracy of PET uptake estimation but also the accuracy of the precision: the SD of PET error in the pelvis was reduced by a factor of 2.
In previous work investigating pelvic osseous lesions, SUV underestimation ranged from 9% to 15% when bone was misclassified (8–11)—a result that is in line with the current results for Dixon MRAC (underestimation of 9.45% ± 3.95%). Using a model-based approach to incorporate bone attenuation in the body decreased the SUV error in bone lesions to −2.9% ± 5.8% (17), and our prior work using ZTE-based MRAC with segmentation and regression models had small bone lesion errors of −3.2% ± 0.85% (11). In the current study, we showed bone lesion errors of −1.41% ± 2.28% using ZeDD CT.
The major improvement in using deep learning is clinical feasibility. We found no significant difference between quantifications based on our previous method (hybrid ZTE/Dixon attenuation correction) and ZeDD. However, hybrid ZTE/Dixon relied on a time-consuming segmentation process that takes 4–6 hours for an experienced user. Other existing methods were automated but required some human-prescribed parameters (20–22,25,26). The deep learning approach is fully automated and fully data-driven: MR images are directly converted to pseudo-CT images in a single model. Although model training takes several hours, it is performed only once. Once the model is trained, pseudo-CT images can be generated in a few minutes immediately after MRI acquisition is completed, making the current method clinically feasible.
Because the PET/MRI and CT acquisitions were on separate days, there may be errors due to imperfect deformable image registration and mismatch of bowel air distributions. The mismatch makes comparison of soft-tissue lesions difficult because bowel air is filled in with soft-tissue HU values derived from the Dixon pseudo-CT; this may be the reason ZeDD CT does not perform as well with soft-tissue lesions as with bone lesions.
In a few cases, there were small artifacts where bowel air or skin folds were assigned bone HU values (e.g., Fig. 3D), a limitation of the patch-based method: the patch’s location inside the body can only be inferred from the structures within the patch. However, these artifacts occurred in only 5 of 16 test patients and corresponded to a small fraction of the voxels in the PET imaging volume.
Another limitation is that our model was trained on limited patient demographics: mostly elderly patients being scanned at our institution. Thus, the model we have generated may not be applicable to a pediatric population, which has bone densities different from an older population.
There are arbitrarily many combinations of the elements to produce a deep learning model, and new techniques and elements for designing deep learning models are being produced constantly: the deep learning field is the fastest-paced in recent history; the paper by Krizhevsky et al. (40) published in 2012 is considered a “classic” paper in the field and has over 12,000 citations at the time of this writing. We proposed one of many possible models and demonstrated that using deep learning may lead to fast, fully automated, and clinically feasible methods for MRAC.
CONCLUSION
We have developed and evaluated the use of a deep convolutional neural network with multiparametric MRI that produces natural-looking and quantitatively accurate pseudo-CT images. The ZeDD CT method has been tested in the context of pelvic PET/MRI attenuation correction and has shown a reduced error compared with standard methods.
DISCLOSURE
This study was supported in part by the National Cancer Institute of the National Institutes of Health under award R01CA212148, by research support from GE Healthcare, and by the UCSF Resource Allocation Program. No other potential conflict of interest relevant to this article was reported.
Footnotes
Published online Oct. 30, 2017.
- © 2018 by the Society of Nuclear Medicine and Molecular Imaging.
REFERENCES
- Received for publication June 23, 2017.
- Accepted for publication October 16, 2017.


Jump to section
Related Articles
Cited By...
- Deep Learning for Synthetic CT from Bone MRI in the Head and Neck
- Enhanced Direct Joint Attenuation and Scatter Correction of Whole-Body PET Images via Context-Aware Deep Networks
- Evaluation of Deep Learning-Based Approaches to Segment Bowel Air Pockets and Generate Pelvic Attenuation Maps from CAIPIRINHA-Accelerated Dixon MR Images
- Direct Attenuation Correction Using Deep Learning for Cardiac SPECT: A Feasibility Study
- Virtual Mouse Brain Histology from Multi-contrast MRI via Deep Learning
- PET/MRI, Part 2: Technologic Principles
- Machine Learning in Nuclear Medicine: Part 2--Neural Networks and Clinical Aspects
- Summary of the First ISMRM-SNMMI Workshop on PET/MRI: Applications and Limitations
- Intelligent Imaging: Artificial Intelligence Augmented Nuclear Medicine
- Generation of PET Attenuation Map for Whole-Body Time-of-Flight 18F-FDG PET/MRI Using a Deep Neural Network Trained with Simultaneously Reconstructed Activity and Attenuation Maps
- Synthesis of Patient-Specific Transmission Data for PET Attenuation Correction for PET/MRI Neuroimaging Using a Convolutional Neural Network
- Improving the Accuracy of Simultaneously Reconstructed Activity and Attenuation Maps Using Deep Learning