


Abstract
Intra- or intersubject registration of anatomically poorly defined SPECT data, such as in neuroreceptor imaging, is important for longitudinal or group analysis. However, accurate registration is difficult with only emission CT (ECT) data. We investigated fully automated registration using transmission CT (TCT) data as an intermediary image set. Methods: The accuracy of TCT registration was compared to that of ECT registration for four types of data: gray-matter distribution (with [99mTc]ethylcysteinate dimer (ECD)), neocortical distribution (with [123I]R91150, a highly specific 5-HT2a receptor ligand), and striatal distribution of the D2-receptor ligand (with [123I]iodobenzamide (IBZM)) and the dopamine transporter ligand (with [123I]2β-carbomethoxy-3β-(4-fluorophenyl)tropane (CIT)). In total, 10 datasets of the various study types were used, all collected on a Toshiba GCA9300 gamma camera with super-high-resolution fanbeam collimators and 3 × 370 MBq of 153Gd transmission sources (4-min sequential TCT scanning for receptor studies and 20-min simultaneous scanning for [99mTc]ECD studies). Per dataset, 15 random misalignments of 9 rigid-body parameters (translation, rotation, and anisotropic scaling) were conducted. All coregistrations were done twice, both to the subject’s original scan and to a study-specific template. This was done manually by two independent experienced observers and with three automated voxel similarity algorithms: mutual information (M.I.), count difference (C.D.), and uniformity index (U.I.). As an outcome measure, the impact of misregistration on semiquantification for the various study types was established. Results: TCT matching allowed registration within 3.3 mm, 2.4°, and 1.2% scaling (mean squared values for all directions) with an overall accuracy decrease in the following order: C.D. > M.I. > manual > U.I. For [99mTc]ECD and [123I]IBZM, TCT registration was as accurate as ECT registration, while it was far superior for the other receptor data types, especially for abnormal studies. The automated TCT registration accuracy corresponded to average quantification errors of 2.9% ([99mTc]ECD), 4.2% ([123I]IBZM), 5.7% ([123I]R91150), and 6.1% ([123I]β-CIT). Conclusion: Fully automated registration through intermediary TCT images is clinically feasible, fast, and accurate. In addition to nonuniform attenuation correction, TCT scanning therefore allows coregistration for group comparisons of SPECT receptor data on a standardized or pixel-by-pixel basis.
Dopamine and serotonin receptors and transporters are of interest in the pathophysiology of many psychiatric and neurological disorders. During recent years, several promising SPECT ligands have been developed with high specificity and affinity (1,2). Most published studies so far have used an interactive region-of-interest (ROI)-based semiquantitative analysis to determine significant binding changes. Such an interactive approach is operator dependent, bias prone, and time consuming.
The transformation of brain image sets of individual subjects into a three-dimensional image set of standard brain shape and size (anatomic standardization) has been shown to enhance detection of focal brain responses and to permit group comparisons between normal control subjects and patients on a pixel-by-pixel basis (3). Anatomical standardization also allows the computation of parametric maps of the ligand receptor binding from functional imaging data that may be statistically analyzed at the voxel level, given suitable techniques for both spatial coregistration and the application of appropriate statistical tests (4). A principal advantage of parametric maps is that no a priori hypothesis is required concerning the choice of ROIs. Moreover, in contrast to ROI techniques, all available image information is analyzed.
Techniques for anatomical standardization of SPECT and PET blood flow or metabolic images to a standard brain template are well established, and several approaches and applications have been described (5–8).
Recently, assessment of neuroreceptor distribution using PET and the anatomic standardization technique has also been proposed (9). PET standardization of D2 images of 11C-raclopride can be done with integrated time–activity data that are transformed into the standard brain size and shape, and subsequently these transformation parameters can be applied to individual PET images (3). This approach works well since the integrated image forms a mixture of (early) blood flow and (late) receptor binding data.
In clinical situations, however, dynamic scanning is rarely performed with SPECT, and currently no gold standard is available for the image registration for receptor SPECT on an intra- or intermodality basis. While some automated approaches are specific to a particular type of SPECT study, few methods work well on all datasets (5,10,11).
Commercially available transmission measurements for SPECT are increasingly used (12). Because of its 242-d physical half-life, its relative affordability, and its suitable energy spectrum (main emission at 97 and 103 keV), 153Gd is the most frequently used isotope. Single-photon transmission CT (TCT) imaging not only allows improved quantification through nonuniform attenuation correction but also permits movement detection and correction. Moreover, TCT provides a possibility for anatomical registration, as has been shown on thorax phantom data (11). In the head, sufficient contrast exists within TCT images to accurately classify pixels into bone, soft tissue, and sinuses. If brain TCT coregistration could be accomplished, obvious advantages would be the possibility to coregister emission scans with scarce anatomic information or different radionuclides, to create anatomically standardized templates and patient studies, to coregister a patient scanned on separate days (13), or to correct for patient motion in or between scans (e.g., for dynamic SPECT scan studies lasting several hours or even less than an hour for neurologic or psychiatric patients with low compliance).
There are several approaches to image coregistration, and the existing algorithms can be classified by several properties (14). Although stereotactic frame-based registration is accurate at the submillimeter level, it is impractical and cannot be applied retrospectively. Second, the use of external or internal landmarks is generally operator dependent and hence prone to observer bias, time consuming, and heavily dependent on the accuracy of landmark localization in all modalities (15–17). Automatic techniques are therefore preferred, and these can be based either on surface matching or voxel similarity measures. Surface matching uses only contour information, and because these surfaces are not easily defined for functional data, incorrect registration may occur. Voxel-based algorithms optimize the similarity of geometrically corresponding voxel pairs (16) and are generally the method of choice in coregistration of uni- and multimodality brain images (14,18). Many methods exist that optimize a global measure of the difference between image intensities of corresponding voxels (cost function) and rely on the assumption that the intensities of the two images are linearly correlated. Among these, count difference (19,20) and uniformity index (21) algorithms have been shown to be fast and robust methods for SPECT-MRI and perfusion SPECT–SPECT coregistration (22). Mutual information maximization is a relatively new approach to the problem of multimodality registration, using a concept from information theory (23). This method measures the statistical dependence or information redundancy between image intensities of corresponding voxels in both images, which is assumed to be maximal if voxels are geometrically aligned. It is a general algorithm that has been validated for intermodality MRI, CT, PET, and SPECT rigid-body registration (23).
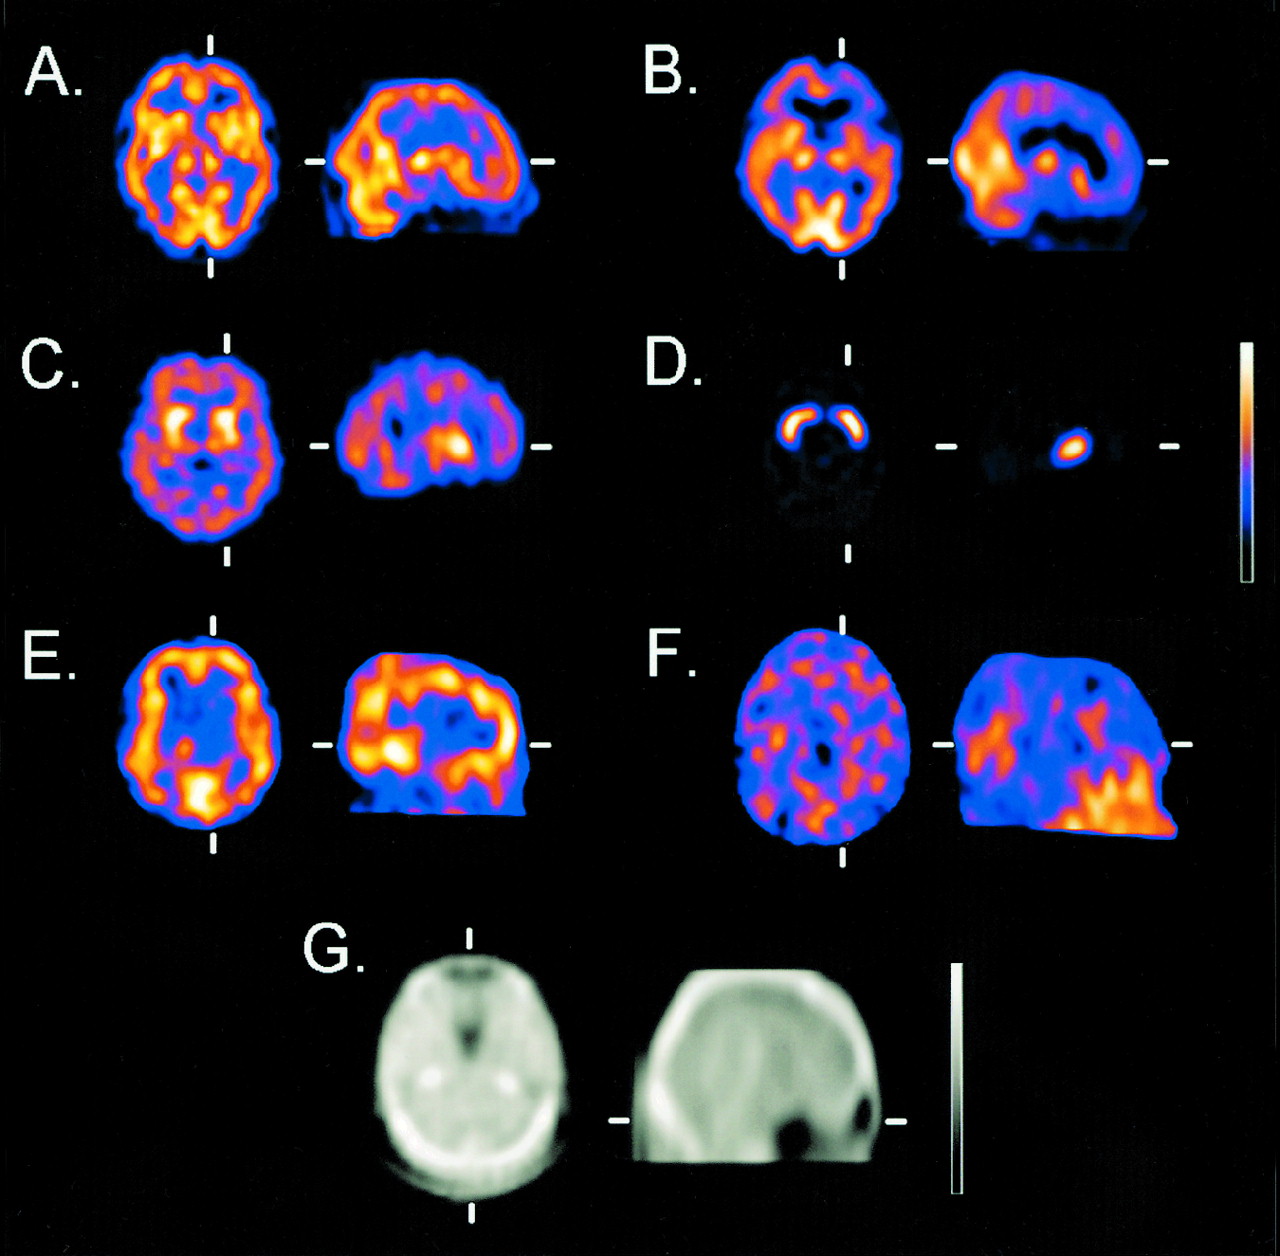
This study evaluated the feasibility and accuracy of automated registration of brain SPECT data using TCT measurements. Predefined realistic misregistrations were performed for four types of SPECT ligand studies, each with a different characteristic distribution: neocortical distribution with the 5-HT2a ligand [123I]-4-amino-N-[1-[3-(4-fluorophenoxy)propyl]-4-methyl-4-piperidinyl]-5-iodo-2-methoxybenzamide ([123I]-5-I-R91150; normal signal-to-noise ratio (SNR), 1.8:1); localized basal ganglia distribution with the dopamine D2-receptor ligand [123I]-iodobenzamide ([123I]IBZM; SNR, 1.5:1) and with the dopamine transporter ligand [123I]2β-carbomethoxy-3β-(4-iodophenyl)tropane ([123I]β-CIT; SNR, 5–7:1); and global main gray-matter distribution with [99mTc]-ethylcysteine dimer ([99mTc]ECD) (Fig. 1). The latter was chosen as a reference study type whose anatomic standardization has been well described in recent literature (8,24,25). We evaluated registration data obtained manually by two independent experienced observers and with three fully automated algorithms frequently used for brain SPECT (mutual information, count difference, and uniformity index). For these evaluations, optimal parameters were determined, and the ability to recover registration was measured. Recovery was first measured for registration to an initial anatomically standardized image (the “gold standard” obtained by consensus visual inspection) for each subject to simulate intrasubject registration. Second, registration to a study-specific template was performed, and the error with respect to the gold standard image was measured. Moreover, normal and patient data were compared with respect to this registration accuracy. The speed of the automated algorithms was evaluated, and finally, for the various types of data, the fitting accuracy was evaluated, with semiquantification as the clinically important outcome measure.

Representative radioligand studies used for emission registration and transmission images used for transmission registration. Images show transaxial (trx) and sagittal (sag) normal [99mTc]ECD (A), patient with corticobasal degeneration [99mTc]ECD (trx) (B), [123I]IBZM (trx) (C), [123I]β-CIT (striatal phantom, 7:1 ratio of striatum/background; trx) (D), normal [123I]R91150 5-HT2a study (trx + sag; note absence of specific binding in the cerebellum) (E), patient post-suicide attempt (deliberate self-injury) [123I]R91150 5-HT2a (sag) (F), and 153Gd transmission map (trx + sag) (G).
Materials and Methods
Instrumentation
All data were acquired on a triple-head Toshiba GCA-9300 camera with super-high-resolution lead fanbeam (SHR-FB) collimators, resulting in an on-site measured tomographic resolution of 7.4 mm at a 132-mm radius of rotation. The fanbeam collimator has a focal length of 397 mm (26) and must be used with this minimum radius of rotation. The field of view under these conditions encompasses 220 mm, which enables complete inclusion of the human head at least up to the foramen magnum. Three unshielded and uncollimated rod sources each filled with 370 MBq 153Gd (rod length, 335 mm; diameter, 4 mm) were used for transmission scanning. These sources are placed in the focal lines of the SHR-FB collimators. For transmission reconstruction, static blank scans were acquired with 200 kcounts per camera head.
Subjects and Study Types
[99mTc]ECD (Dupont Pharmaceuticals Ltd., Belgium) perfusion scans were acquired from two healthy volunteers and one patient with corticobasal degeneration and a severe frontal perfusion deficit. [123I]IBZM (Nycomed Amersham, The Netherlands) scans of two early-stage Parkinson patients with normal uptake were included. Three [123I]R91150 5-HT2a receptor scans were used, including scans from one healthy volunteer, one patient with anorexia nervosa and a decrease in left frontal receptor binding, and one attempted-suicide patient with deliberate self-inflicted injury and severely decreased neocortical receptor binding potential. All demographic and scan data for these subjects are summarized in Table 1. All subjects were included after written informed consent was obtained for studies and approved by the local university hospital ethics committee.
Overview of Radioligand Types, Subject Demographics, and Scan Description for Perfusion and Receptor Images
Since patient data with the same camera constellation for dopamine transporter studies were unavailable, such data were simulated by means of a realistic striatal phantom. The three-dimensional Alderson striatal brain phantom (Radiological Support Devices, Long Beach, CA) with dried skull (mass density, 1.86 g/cm3) was used. For normal studies, all parts representing the putamen and head of the caudate nucleus were filled with 203 kBq of 99mTc, while the bulk of the phantom was filled with 6.07 MBq (1,250 mL), representing a realistic 7:1 SNR as is observed with [123I]β-CIT in healthy volunteers scanned at 24 h after injection (27). Apart from a normal study, one simulated patient was included, in which the activity in the right caudate head was injected with the background concentration to represent aspecific activity. These striatal phantom measurements are further designated as the “β-CIT data” below.
Data Acquisition and Reconstruction
All acquisitions were performed similarly for all emission scans. A continuous-acquisition mode was used with 90 projections in a 128 by 128 matrix (pixel size, 1.72 mm). For [99mTc]-ECD, [123I]IBZM, and striatal phantom data, 20-min scans were acquired, whereas for [123I]R91150, the acquisitions lasted 40 min. Symmetric scatter windows were set 7% apart from the 20% window over the 140- or 159-keV peak.
Transmission scans were acquired simultaneously for 99mTc data with a 15% central 99-keV window and two adjacent 5% scatter windows to correct for 99mTc downscatter. TCT scans were acquired sequentially for the other studies, over a period of 4.5 min and with the same acquisition parameters.
Scatter correction for emission and simultaneous transmission scans was done by means of the Triple Energy Window correction method (28). The main window was filtered with a Butterworth filter of order 8 with a cutoff of 0.16 cycles/pixel, and another Butterworth filter of order 8 with a cutoff of 0.09 cycles/pixel was used for the scatter windows. Nonuniform attenuation correction was calculated by means of iterative Chang with one iteration. Before reconstruction, fanbeam data were rebinned to parallel data by means of the software from the camera manufacturer (pixel size, 3.2 mm). Emission data were calculated by means of filtered backprojection with Shepp-Logan prefiltering and a Butterworth postfilter (order 8 and cutoffs of 0.13 cycles/pixel for 99mTc data, 0.09 for [123I]IBZM, and 0.07 for [123I]R91150). The complete reconstruction procedure was performed using the camera manufacturer’s software (version 5.00).
Data Analysis
Reconstructed data were transferred on line after Interfile 3.3 conversion to a Hermes imaging platform (Pentium Pro, Intel 300 MHz; Nuclear Diagnostics, Hägersted, Sweden) and converted to a 64-by-64 matrix format.
For the patient data study types, study-specific, anatomically standardized templates of size 643 voxels were obtained from larger sets of healthy volunteers. For [99mTc]ECD, the first 30 volunteers that took part in the Gent-Optimized Adult High-Resolution ECD Absolute Database (GO AHEAD) project, with 90 thoroughly screened healthy volunteers (analysis in progress) were included to form the stereotactic fitting template for this study. For [123I]IBZM, a set of four normal studies was used to construct the coregistration template, and for [123I]R91150 the template consisted of 10 young healthy volunteers. For the [123I]β-CIT simulations, an average template consisting of four phantom measurements with activity ratios between 4:1 and 7:1 was obtained. The procedure to construct all of these templates is described in detail by Radau et al. (29), who used the same software (Brass and MultiModality; Nuclear Diagnostics). The TCT template was created from the simultaneous transmission measurements of the 30 [99mTc]ECD studies by applying the same emission 9-parameter rigid transformation using the MultiModality software.
The coordinate system used in this work was defined similarly to the stereotactic atlas of Talairach and Tournoux (30), with the x-axis transaxially in the bicommisural plane in the right-left direction, the y-axis transaxially in the postero-anterior direction, and the z-axis axially in the caudo-cranial direction. Rotations are defined in the Cartesian planes, e.g., φxy for a transaxial rotation from the x- to the y-axis.
All automated image registrations were made on three-dimensional volume data with the above-mentioned MultiModality registration toolkit (Nuclear Diagnostics). Images were coregistered with a limit of 1,000 iterations, normalization on total counts, and a stopping criterion defined at the level where the similarity measure did not alter by >0.1%. The threshold settings were optimized (see Results). As a search strategy, the iterative downhill-simplex method was used. Three different cost functions were used: count difference (C.D.), uniformity index (U.I.), and mutual information (M.I.).
The C.D. algorithm minimizes the absolute difference in counts between two images (19,20). The images can be normalized by a factor, which can be the maximum number of counts in the image or the total counts. Total-count normalization was used in this work. The U.I. is a similarity measure based on the principle that when two images are perfectly aligned, the ratio of the intensities of two corresponding voxels belonging to a certain group or tissue type is assumed to be constant (21). In the applied software algorithm in this work, the voxels of the reference image are divided into 256 groups according to their intensity levels. Then, for each group of voxels in the reference image, the ratio of the intensities between two corresponding voxels is calculated, and the variance of this ratio within each group is minimized. The M.I. index is calculated from the marginal probability distributions and their joint probability distribution, and this algorithm measures the degree of dependence of two images by measuring the distance between the joint distribution and the distribution associated with the case of complete independence (23).
Although the U.I. has been shown to produce less adequate accuracy for perfusion SPECT-SPECT registration (22), it was included because good results were obtained in the TCT registration phantom study by Dey et al. (11). Similarity measures with artificial changes before the calculation of the measure were not used because they have shown inferior performance (22).
Manual registration was performed by two independent observers with experience in image coregistration and brain SPECT. Both observers were blinded with respect to all misalignment parameters, but they were informed of the maximal range at which the data were independently and uniformly distributed, as was stated above. The manual registration procedure was interactive by means of a dual-window display and sliding-window (overlay) technique, as part of the MultiModality software. This allows the observer to adjust the image of interest to a reference image on the first window (in this case the subject’s gold standard image or the study-specific template image), while directly registering the second image by direct numeric adjustment of the nine parameters. Both images can be viewed simultaneously in three orientations (coronal, sagittal, and transaxial) to aid spatial perception.
Misalignments
To evaluate the TCT registration technique relative to direct emission registration, the following sets of experiments were performed. Each of the 10 studies underwent 15 random misalignments. The amount of deliberate misalignment was based on typical magnitudes that can occur in realistic clinical situations. The misalignments were uniformly distributed within −6 to +6 pixels (reconstructed pixel size, 3.59 mm) along the Cartesian axes of the translation vector, −10° to +10° of rotation in the three main Cartesian planes and −10% to +10% scaling along the same axes. Random numbers were generated in Excel97 for Windows (Microsoft Corp.) and were verified a posteriori to exclude fortuitously small misalignments and to ascertain whether the entire misalignment range was scanned. Trilinear interpolation was used when misaligning the data. For each type of study, but not for each individual study, the same random misalignments were used.
Before the misalignment tests, all studies were registered to the study-specific templates. This was done based on emission registration and count differences for the perfusion data and by (intermediary) transmission registration for the other data types. Implicitly it was assumed that this registration, verified by visual inspection by the three first authors in consensus, could be taken as the gold standard to which subsequent registrations were compared.
Studies were subsequently registered to the individual’s study itself to simulate intrasubject reorientation, which is of importance for longitudinal studies. Second, to simulate realistic template-based coregistration, they were also coregistered to the study-specific template. For optimal comparison, all nine registration parameters were allowed to vary in both procedures, although for intrasubject coregistration no scaling would be needed. Both registration types were performed for all three automated algorithms and both manual methods. In total, 940 trial registrations were conducted. The agreement of the registration with the subject’s a priori anatomically standardized image was considered as the measure of accuracy used in this study.
To reduce the evaluation of registration to a limited and pragmatic number of parameters, the residual errors along the translation, rotation, and scaling dimensions were expressed as follows. For translation, the square of the quadratic sum Δtot of the residual difference components along the three axes of the Cartesian coordinate system as defined above was calculated with equal weights.
 1
1
The residual difference Δi (i = x,y,z) is defined as the value of the registration parameters along these axes, expressed in pixels (where a perfect registration would give Δi = 0). For the rotation parameters, a measure Φtot was defined as the square of the quadratic sum of individual rotation registration values in the xy, xz, and yz planes, expressed in degrees (perfect registration, Φ = 0).
 2
2
Similarly, the measure Σtot was defined as the square of the quadratic sum of individual scaling values along the Cartesian axes, expressed in percent (perfect registration, Σ = 100%).
 3
3
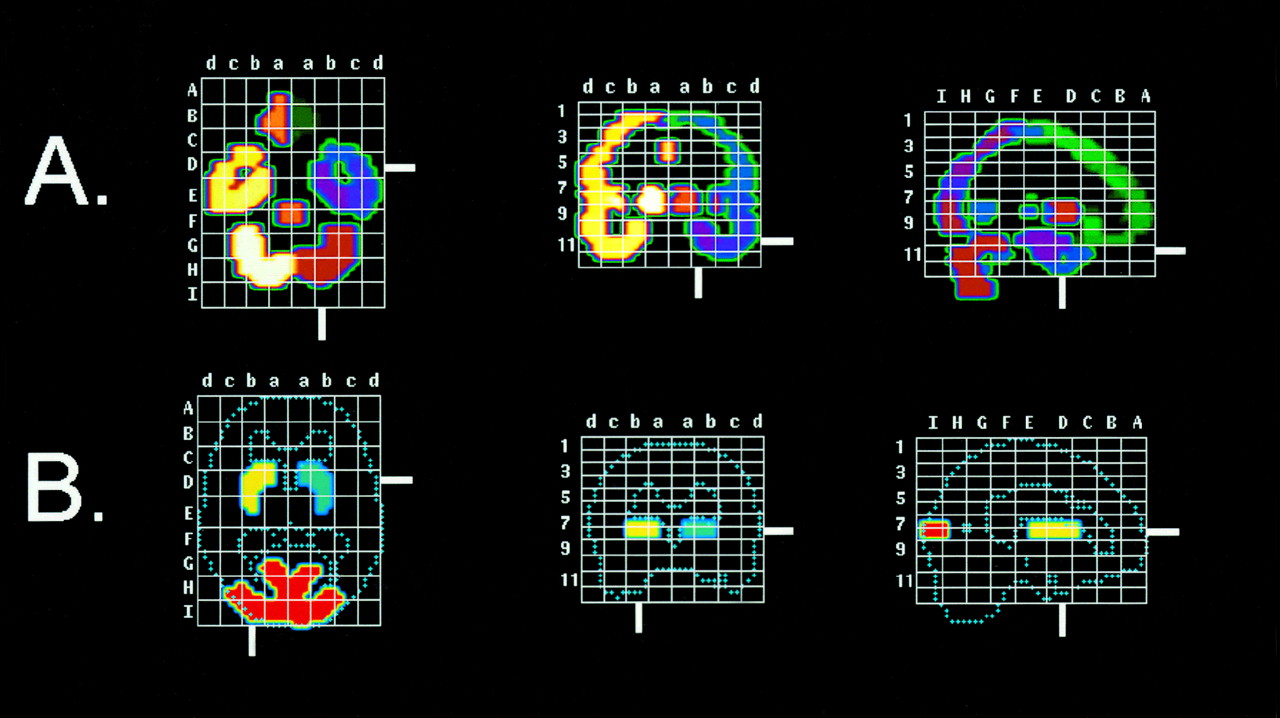
The effect of coregistration was related to semiquantification as a clinical-outcome parameter. For each study type, a volume-of-interest (VOI)-based semiquantification was performed for the nine-dimensional range of registration errors as described above for 1, 3, and 6 pixels; 1, 3, and 6°, and 101, 105, and 110% scaling. For simplicity, these errors were evaluated separately along the major axis and rotation planes. Figure 2 shows representative slices of anatomically standardized VOI maps that were used for automated quantification. The quantification procedure is based on the work of Slomka et al. (7) and a similar method for striatal receptors as described by Radau et al. (29) and Habraken et al. (31).

Stereotactic VOI maps for automated quantification. Maps include representative slices in stereotactic reference frame for [99mTc]ECD perfusion and neocortical receptor ligand [123I]R91150 quantification (A) and stereotactic VOI map for striatal [123I]IBZM and [123I]β-CIT (1.08-cm thickness, centered at site of standard anatomic striatum) (B).
To test the robustness of the automated TCT registration algorithm to truncation in the axial direction, i.e., to study the effect of missing slices on TCT template registration, four supplementary TCT datasets were created by removing 2, 4, 6, and 8 slices of 3.4-mm thickness from the bottom of the skull, which has the most information density (e.g., sinuses and irregular skull). The truncated images were misaligned with the same parameters and registered using minimization of the absolute count difference.
Statistical Analysis
All statistics were calculated with SPSS (version 9.0 for Windows; SPSS Inc., Heverlee, Belgium). The assumption of data normality was verified with the Kolmogorov-Smirnov test. Differences in coregistration accuracy between registration methods were assessed by one-way ANOVA with Bonferroni correction (α = 0.05). An independent-samples t test was used to calculate differences between template and intrasubject registration accuracy. Differences in mean quantification errors between emission and transmission registration were calculated by a paired-samples t test. Bivariate correlations were tested by the Pearson correlation test.
Results
Threshold Optimization
For all study types and minimization algorithms, the optimal cutoff or threshold was determined, below which all voxel information was masked for the registration. The threshold determination was done for normal studies and for intrasubject coregistration. The optimal threshold value was based on minimal values for the quadratic sum of the combined residual differences for translation, scaling, and rotation (Eq. 1–3). For [99mTc]ECD, [123I]IBZM, and [123I]R91150, as well as TCT studies, a 10% threshold was optimal for the screened range 0%–70%, irrespective of minimization type. The difference up to the 30% threshold was small in all cases but increased strongly and significantly above this value. Within the range 0%–50%, a 0% threshold provided the lowest residual differences in C.D. and U.I. minimization for [123I]β-CIT studies, while 5% provided the minimal residual registration error for M.I.
Fit Accuracy
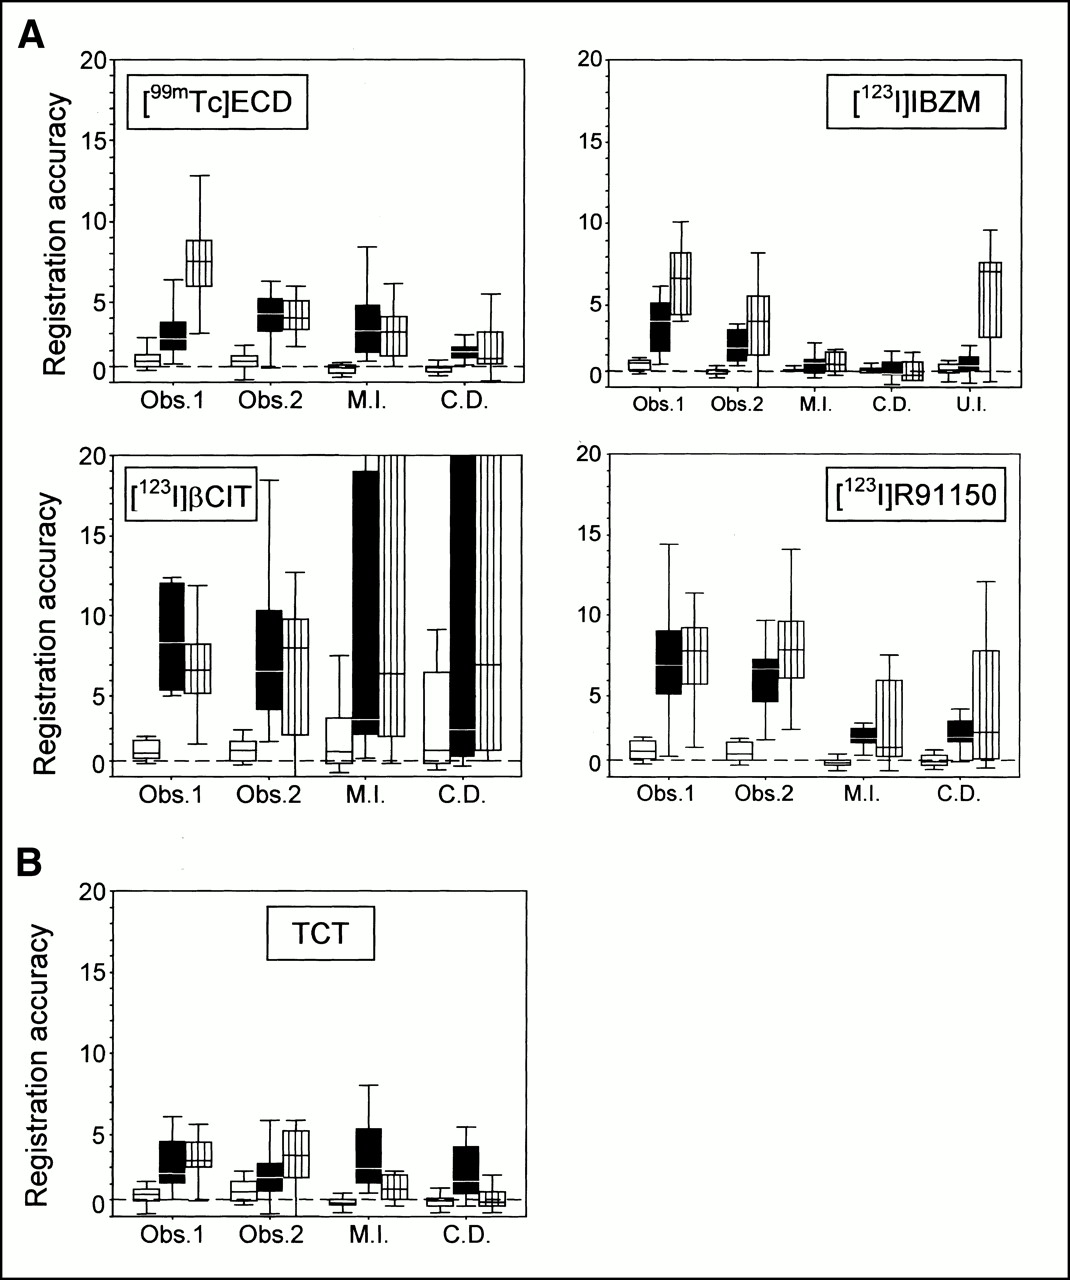
Figure 3 shows the accuracy of template registration for the whole set of data obtained for observers 1 and 2 and the three automated registration algorithms, expressed as squared mean residual errors. Only in [123I]IBZM, template matching for U.I. minimization resulted in a residual error within the predefined randomization limits. In all cases, best results were obtained for M.I. and C.D. minimization algorithms, with a slight advantage for C.D. over M.I. for [99mTc]ECD, [123I]IBZM, and TCT data. For [123I]β-CIT and [123I]R91150 data, the average misregistration was high, especially for rotational and scaling components. These latter two components were generally significantly higher for manual registration when compared to automated registration for all other study types. Between both manual observers, there was no significant difference, irrespective of the type of study.

Accuracy of template registration for different radioligand studies, shown as box-and-whisker plots. The accuracy of emission registration (top four charts) and transmission registration (bottom chart) is given as square root of quadratic sum of subdimensional deviations for translation (open boxes, pixels (1 pixel = 3.59 mm)), rotation (black boxes (degrees)), and scaling (striped boxes (%)). Obs. 1, observer 1; Obs. 2, observer 2.
The accuracy for registration to intrasubject studies was systematically better and is summarized in Table 2, compared to template matching. There was a significantly higher residual error accompanied with scaling and rotation for template-based registration compared to intrasubject registration but not with translation.
Coregistration Accuracy for Intrasubject and Template Matching for Perfusion and Receptor Ligand Studies
U.I. registration appeared to be inappropriate for intrasubject TCT registration as well as for all template-matching procedures, with the exception of [123I]IBZM. No significant difference between registration accuracies for sequential versus simultaneously acquired TCT studies was found.
The correlations between the original misalignment parameters, categorized similarly as square roots of the quadratic sums of the individual components (Eq. 1–3), and the same residual registration errors, categorized in the same way, were investigated. There was a significant correlation for all automated ECT and TCT registration methods and data types between initial and residual misalignments for translation (Pearson ρ = 0.64–0.68; P = 0.002–0.007), rotation (ρ = 0.66–0.91; P = 0.001–0.004), and scaling (ρ = 0.55–0.71; P = 0.002–0.033) parameters, indicating a significant relationship between the a priori misalignment and fit accuracy.
Mean Quantification Errors
Figure 4 shows the semiquantification errors, separated for the nine registration dimensions. This error, εj, was calculated as the average coefficient of variation for each study type j as follows:
 4
with Nj the number of VOI regions for type j, i the region number (for [99mTc]ECD, i = 1.35; for [123I]R91150, i = 1.24 (no subcortical regions); and for [123I]IBZM and [123I]β-CIT, i = 1 and 2, respectively), and Q′ij the relative quantitative value after misregistration. As can be seen from this figure, there is substantial heterogeneity between the study types as well as the transformation parameters. Translation differences of >1 cm (3 pixels) gave rise to unacceptably large (>10%) mean errors for all study types. The largest quantification errors for translation are seen in receptor ligand studies with the highest SNRs. Within the specified limits, quantification is relatively less sensitive to rotation and positive scaling variations, except for sagittal (Φyz) angular and z-scale variations in the case of [123I]R91150, caused by normalization procedures to the cerebellum with aspecific uptake.
4
with Nj the number of VOI regions for type j, i the region number (for [99mTc]ECD, i = 1.35; for [123I]R91150, i = 1.24 (no subcortical regions); and for [123I]IBZM and [123I]β-CIT, i = 1 and 2, respectively), and Q′ij the relative quantitative value after misregistration. As can be seen from this figure, there is substantial heterogeneity between the study types as well as the transformation parameters. Translation differences of >1 cm (3 pixels) gave rise to unacceptably large (>10%) mean errors for all study types. The largest quantification errors for translation are seen in receptor ligand studies with the highest SNRs. Within the specified limits, quantification is relatively less sensitive to rotation and positive scaling variations, except for sagittal (Φyz) angular and z-scale variations in the case of [123I]R91150, caused by normalization procedures to the cerebellum with aspecific uptake.
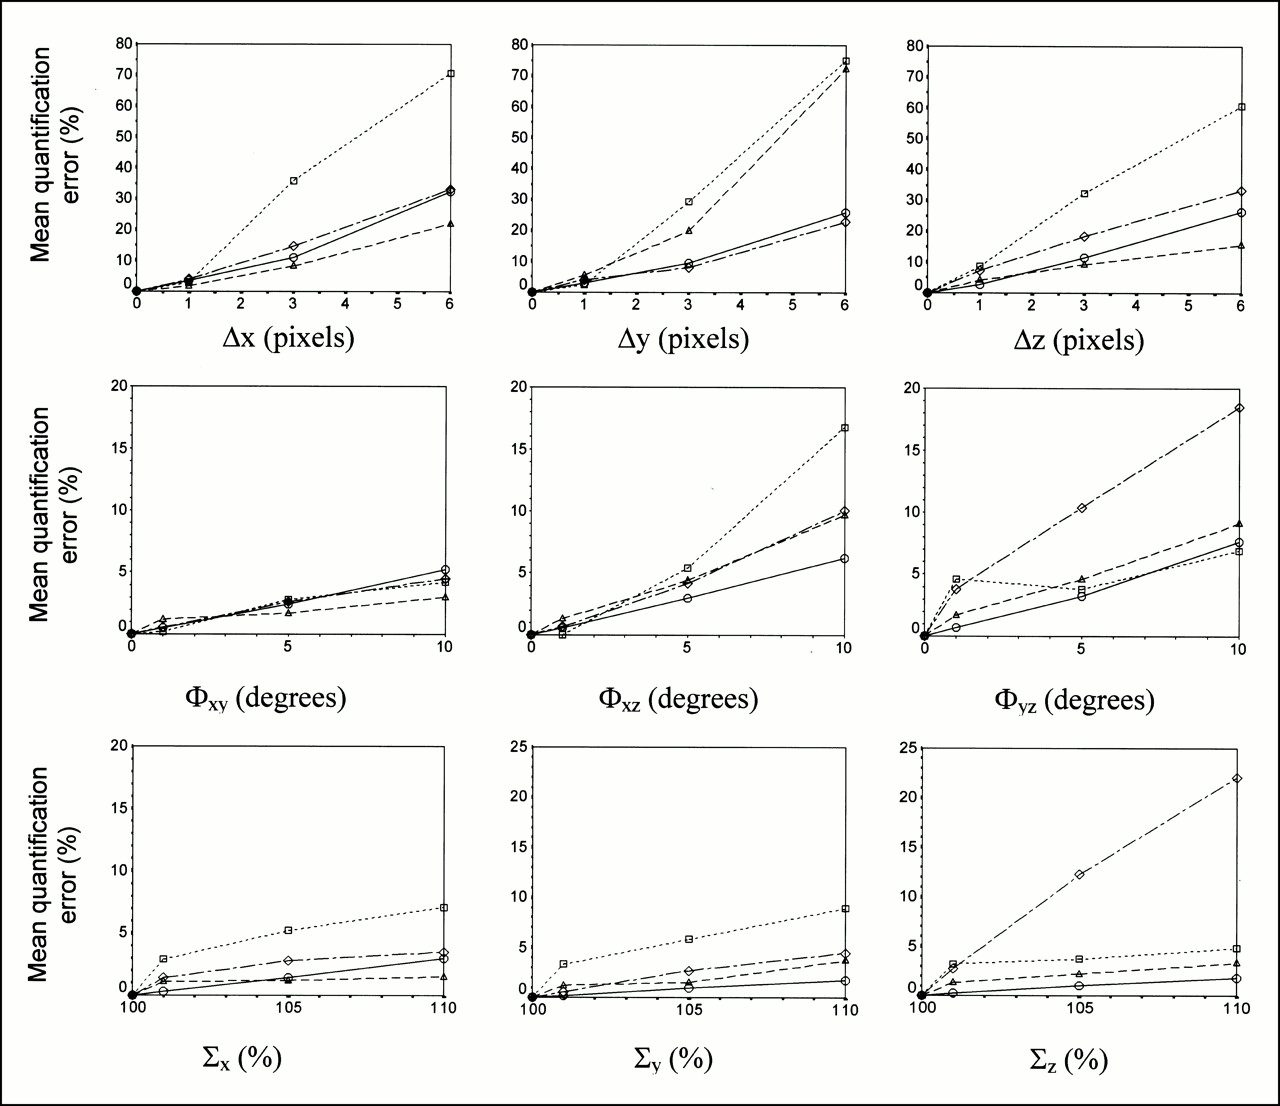
Mean error on quantification for perfusion and receptor ligand studies as function of shift, scaling, and rotation errors, calculated for a normal study. ○, [99mTc]ECD; ▴, [123I]IBZM; □, dashed line, [123I]β-CIT; ◊, [123I]R91150.
Table 3 compares the mean quantification error for ECT-based registration with the C.D. procedure versus TCT matching in all nine variable dimensions. The overall mean quantification error is not significantly different for ECT versus TCT registration in the case of [123I]IBZM and [99mTc]ECD, but it is highly significantly better for TCT matching in the case of [123I]β-CIT- and [123I]R91150-type data. It can be seen from Table 3 that misregistration in z-scaling and z-translation has the largest relative impact on the total uncertainty for the receptor ligand studies.
Mean Quantification Error for Emission Versus Transmission Template Matching for Perfusion and Receptor Ligand Studies Based on Count Difference Registration Accuracy
Processing Time
The amount of time required for each coregistration procedure was measured starting from the placements of the two studies in the software display. Table 4 shows the range of processing time for all studies with respect to processing method (manual versus automated) for template matching. M.I. and C.D. resulted in average calculation times of 3.4 min, compared to 8.2 min for manual registration. The automated procedures were not significantly different in processing time per iteration, and on average 0.55 s/iteration was consumed. Manual registration for perfusion studies took significantly longer for both observers than receptor ligand studies. One-way ANOVA revealed no significant differences between any ECT or TCT registration times for the automated procedures.
Processing Time (Mean and SD) for Manual and Automated Registration of All Data Types
Constrained Versus Free Scaling
Intrasubject coregistrations with and without constrained scaling were compared for all data types, with five misregistrations per type with the same uniformly distributed misalignment range (all scaling parameters, 100%). Table 5 shows that no significant improvement on shift and rotation registration accuracy was obtained, irrespective of study. Only in the cases of the [123I]β-CIT data, rotational differences were increased significantly. There was however a significant reduction in number of iterations to reach convergence for constrained scaling: 227 (±59) versus 430 (±146) (P < 0.001).
Translation and Rotation Registration Accuracy for Intrasubject Coregistration Comparing Constrained Versus Unconstrained Scaling, for Mutual Information Minimization
Emission Registration of Patient Versus Normal Data
In clinical practice, it has to be shown that registration occurs accurately not only for normal data but also for patient data with significant defects. Patient data with deficits were available for [99mTc]ECD, (simulated) [123I]β-CIT, and [123I]R91150. Differences between template registration accuracies were investigated for these study types for the C.D. and M.I. minimization algorithms.
For [99mTc]ECD, slightly better average accuracy was obtained for normal data, although the difference was not significant for the patient with corticobasal degeneration (Table 6). For the receptor data, a significantly worse accuracy was obtained for emission fitting of patient data. For [123I]R91150, this was entirely attributable to patient 10 (Table 1) with a global severe reduction of specific 5-HT2a binding potential. In this case, scaling accuracy was highly significantly aberrant (P < 0.001), likely because of the total absence of specific anatomical reference regions (Fig. 1).
Template Registration Accuracy for Patient Studies Versus Normal Studies
Effects of Incomplete Transmission Data
Figure 5 shows the importance of obtaining complete TCT data to allow accurate registration. For subsequent deletion of two to eight slices, the registration algorithm will try to elongate the original TCT image in the z (axial) direction, as can be seen from the negative z-shift and parallel increased z-scaling that was significantly correlated (Spearman ρ = −0.928; P < 0.001). All of the other 7 parameters did not differ significantly from zero. The registration error resulting from incomplete image sampling at the cranium of the skull was much less important, since the discriminative regions at the lower half of the skull were still present.
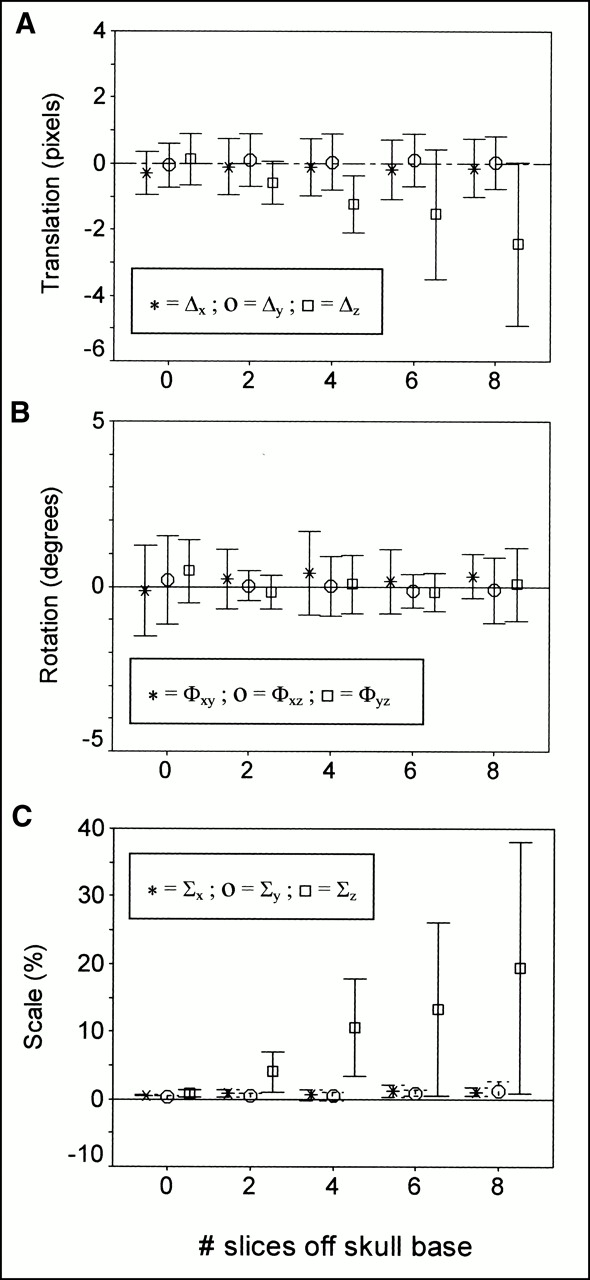
Residual registration error for count difference in TCT matching as function of incomplete sampling of infratentorial skull, shown as clustered error bar plot. y-axis, 95% CI limits on registration difference. Data are squared quadratic sums of translation (A), rotation (B), and scaling (C) errors.
Discussion
Whereas techniques for anatomic standardization of SPECT and PET blood flow or metabolic images to a standard brain template are well established (6), as well as those for dynamic PET receptor ligand studies, and the assessment of neuroreceptor distribution with an anatomic standardization technique can conveniently be performed with integrated time–activity data (3,4), there is no generally accepted technique for automated anatomic standardization of static SPECT receptor studies. Yet, accurate anatomic localization of abnormalities in functional SPECT receptor images is critical. In the signal analysis of human brain function activation, the effect of spatial registration noise in brain images was shown to be important at the voxel level (32), and it may produce false-positive results in pixel-based statistical tests becaused of registration errors. For rCBF studies, Sychra et al. (33) have shown that misregistration of one-eighth pixel (0.7 mm) can produce 5%–10% voxel signal variation. To achieve the same level of operator-independent, voxel-based analysis capabilities for receptor studies and to fully realize their potential of becoming diagnostic tools in clinical practice, an anatomic standardization approach is highly desirable. In this study, we have shown that it is possible to achieve an anatomic standardization accuracy comparable to conventional coregistration of perfusion studies by using intermediary rigid TCT registration. Realistic study doses and acquisition times were used to demonstrate the true clinical potential.
Registration Accuracy
We have chosen the approach of voxel similarity minimization since, for retrospective registration, it has been shown to produce the most accurate results (18). Moreover, similarity measures do not require separate segmentation and are thus more useable than the surface-based approaches.
It should be stressed however that, in the use of automated voxel-similarity minimization algorithms, several parameters need to be optimized for particular study types. The most important one is the optimal cutoff or threshold below which all voxel information is masked for the calculation of the similarity measure. Since a substantial variation by the choice of this parameter was shown, a priori knowledge of its optimal value is necessary. Although there was little difference between a 10% and 30% cutoff value for all study types but the β-CIT studies, the residual registration error was systematically lower at 10%. Discarding a minimum level of background noise from the emission or transmission scans is thus necessary to obtain optimal results.
U.I. registration appeared to be inappropriate for intrasubject TCT registration as well as for all template-matching procedures, with the exception of [123I]IBZM studies. However, the measure has performed well also in comparison to C.D. minimization in a registration validation study of a thorax phantom using conventional CT and TCT data, as performed by Dey et al. (11). One hypothesis is that the range of different voxel densities and size of the regions with different densities are different in brain TCT images, which may lead to lower variances of voxel intensity ratios and thereby less sensitivity to registration inaccuracies because of less sharply defined minima. The observation that [123I]IBZM data did perform well may partly result from the relatively low number of subjects included in the normal [123I]IBZM template and therefore a higher similarity to the individual studies used in this work.
In this study, the difference in registration accuracy between C.D. and M.I. was only marginal. In a previous study for SPECT–SPECT registration, before the availability of the M.I. algorithm, C.D. and U.I. showed comparable registration errors for brain MRI–SPECT and perfusion SPECT–SPECT registration, in which the former performed relatively best for SPECT-SPECT and the latter for MRI–SPECT (22). Generally, M.I. should be most broadly applicable since it can be used for both intramodality and intermodality registration (23).
From the above data it can also be seen that care should be expressed when analyzing receptor data by manual coregistration, since especially rotation and anisotropic scaling parameters are difficult to assess reliably within a few degrees or a few percent. Moreover, relatively long processing times make these data also less practical in clinical routine. The fact that it took significantly longer for both observers to coregister perfusion studies compared with receptor data studies may have been caused by excessive comparisons to all neocortical, cerebellar, and subcortical regions to achieve a subjectively “perfect” match. This study was conducted with 64 by 64 matrices, but even for 128 by 128 studies, current increases in hardware speed will reduce the automated processing time to a value significantly below that for manual processing. Similar improvements in registration accuracy of automated voxel-based methods over manual registration were also demonstrated for simulation studies and 18F-FDG brain PET by Zuk and Atkins (18).
Contrary to intuitive expectations, fixing the scaling parameter did not significantly improve translation and rotation residual-error accuracy. This may imply that for these types of functional studies, scaling is more or less independently done from the former two registration dimensions. There was however significantly less optimization time needed, with approximately half of that time necessary for six versus nine parameters.
The magnitude of the deliberate misalignments that were used is higher than that in comparable published studies (34). We also found a significant correlation between the magnitude of initial misregistration parameters and the registration accuracy. In practice, this means that a priori (manual) estimation of the approximate fit should enhance the accuracy and performance of the automated algorithm in finding the registration minimization nadir.
The translation and rotation registration errors found in this work are in agreement with literature data for different intra- and intermodality registration experiments. Only few studies addressed the problem of nine registration parameters. Scaling is an absolute necessity to evaluate the potential of multisubject database construction with anatomic standardization.
Only few literature studies have used transmission images for registration purposes, all in the thorax region. Dey et al. (11) have shown that for registration of TCT and conventional CT data in the thoracic region, three-dimensional landmark distances of 2.5 ± 1.2 mm (C.D.) and 3.3 ± 1.3 mm (U.I.) can be obtained. This study considered only intrasubject matching with no scaling adjustment (6° of freedom). For registering TCT maps to MR images, these authors found that the uniformity index algorithm provided better convergence and possibly a better registration (11).
Eberl et al. (19) used misregistration of PET and SPECT transmission measurements of a thorax phantom with external markers and a count difference algorithm with six rigid parameters. They found 3.1 (±1.7 mm SD—maximum 4.5 mm) residual registration differences for the SPECT reconstruction of the thorax phantom. Bacharach et al. (34) studied PET cardiac scans of the same patient. They stated a registration accuracy of better than 1 mm along all translation axes and 1.5° in each rotation angle, using fiducial markers with an algorithm maximizing the correlation coefficients between stacks of slices (34). Pallotta et al. (35) used a surface-matching registration algorithm with cardiac PET and observed an average fiducial marker displacement of 2.7–4.5 mm.
Anatomic standardization using PET ligand templates and registration based on integrated dynamic studies resulted in mean landmark distances ranging from 1.1 to 4.9 mm (4). As for intra- or intermodality ECT registration, our values for the “well”-registered studies ([99mTc]ECD and [123I]IBZM) also produced residual registration errors that were very similar to published data. The magnitude of ECT [123I]IBZM registration errors was similar to that described by Radau et al. (29). The same C.D. algorithm was used in this work, with a higher masking threshold (35%).
Although evaluation of coregistration accuracy in millimeters and degrees is necessary, it is not sufficient to demonstrate clinical utility, but the outcome parameter for routine clinical analysis requires quantification of the physiological parameters of interest. The influence of residual registration errors on mean semiquantification errors was relatively mild, but it is largely dependent on the use and size of VOIs. For the brain perfusion studies, there was a significant correlation between the size of the VOI and the semiquantification error introduced by a certain misregistration. Sychra et al. (33) found that registration errors for single-axis-shift differences of 0.7 mm and 1° of rotation produce intensity errors of 5%–10% on the voxel level. Nevertheless, such analysis produces a maximum possible error that is diminished by considering larger adjacent regions or clusters, because errors of both signs in neighboring pixels are present. ROI or VOI analysis or smoothing before statistical voxel-based analysis (36) will therefore result in significantly lower errors.
Although in our study, only two [123I]IBZM normal scans and two [123I]β-CIT simulation scans were included, the conclusions from these findings are likely to remain unaltered. Strongly abnormal [123I]IBZM scans with diminished striatal uptake may demonstrate the necessity of TCT registration, although the SNR of these types of ligand studies is fairly low and there is global cerebral aspecific activity that can be used for similarity registration with the above algorithms, appreciable registration accuracy may still be preserved. Also, there are no technical factors that would partially invalidate the results from the simulated [123I]β-CIT scans compared with true patient or volunteer studies.
Clinical Applications
It has been demonstrated that the extra radiation burden associated with transmission scanning for both patient and hospital staff is a very small fraction of the typical doses that occur in conventional nuclear medicine investigations, including those with the radioligands [123I]IBZM, [123I]β-CIT, and [123I]R91150 (37), even in the case of the uncollimated, unshielded sources (38).
For the clinical 123I data, TCT maps were acquired sequentially because our own experiments have precluded the possibility that, when TEW cross-talk correction from the high-energy emission of 153Gd is applied to the emission peak of low-count 123I studies, a large number of 123I emission counts are subtracted, resulting in a reduced counting rate of up to 50%. The count density of short sequential transmission scans for static emission procedures was sufficient for accurate registration and did not increase patient imaging time significantly. A possible disadvantage of sequential acquisition is patient motion between the transmission and emission scans. This should be controlled to avoid significant bias in the registration. A second postemission TCT scan can aid to ensure that no patient motion has occurred during the whole acquisition procedure.
The anatomic standardization technique as shown here permits us to build databases of the D2 receptor, dopamine transporter, and serotonin-2a receptors and to automatically register patient data to these databases, allowing pixel-to-pixel comparison. The diagnostic accuracy of this method compared to a conventional operator-dependent VOI analysis is currently under investigation.
However, the technique presented in this study has relevance beyond the aforementioned applications. In principle, it is extendable to any SPECT receptor study to allow automated quantification and thereby to eliminate all intra- and interobserver variability. For difficult neurological or psychiatric patients, who are often unable to lie still for prolonged periods, registration allows successive time frames to be registered and added to generate a summed image of improved quality. For sequential TCT scans, this would be at the expense of multiple TCT acquisitions before or after each emission study. Nevertheless, these steps can be justified by their low time cost and very limited burden of extra radiation. Multisubject pixel-based parametric images of rate constants or other physiologic parameters can then be obtained. It would be interesting to compare the registration accuracy and possibility of motion corrections to specific elegant emission registration techniques such as principal-component analysis (10) or neural-network registration (39).
TCT maps can also be used for multimodality image registration of single or multiple subjects, such as MRI/ CT-receptor ligand registration. The same technique can be used for the registration of oncological studies, such as 201Tl or [99mTc]hexakis-2-methoxyisobutyl isonitrile ([99mTc]MIBI) for improved active lesion localization.
Study Limitations
Validation of registration algorithms is of vital importance, yet it is difficult. Phantom validation, simulations from segmented MRI, observer assessment, and fiducial markers all have drawbacks. We have chosen to evaluate registration algorithms by their capability to register intentionally randomly displaced studies within realistic limits, thereby inherently assessing the robustness of these methods, giving a realistic idea on the accuracy that can be obtained in clinical use. For the evaluation of registration accuracy, we preferred not to determine the retrospective residual registration error by comparison to fiducial markers on humans, because such a fiducial based registration itself has inherent measurement errors. The registration errors obtained with these methods are then a combination of errors in the measurement of the fiducial markers and registration errors by the algorithms. Use of internal anatomic markers such as the top of the petrous bone or the orbita is also prone to inaccuracies because of the low, multipixel SPECT resolution compared to attainable subvoxel registration accuracy. The technique of reregistration of controlled misregistrations to evaluate the performance of registration algorithms has been used in several studies (19,29,40).
As was shown in Figure 5, it is very important for optimal spatial TCT coregistration that a complete set of TCT data is obtained. The most important discriminative regions, such as sinuses, the oronasal cavity, and the skull base should be completely imaged. This proved necessary to avoid elongation of the coregistered image along the z-axis in an attempt with the algorithms to shift the intensity center and contour of the image to match the complete template. If this should fail, z-scaling may have to be manually adjusted in combination with the z-translation parameter, but all other parameters should be kept as determined by the algorithm. The effect of consistently higher z-axis translation errors was also described by Studholme et al. in brain PET–MR registration (16).
This limitation may also be one of the reasons why we were unable to find references to automated registration of PET receptor ligand studies using 511-keV transmission data. The field-of-view of most PET cameras is insufficient for complete skull inclusion. Moreover, the contrast features are decreased since smaller differences in attenuation coefficients are present at 511 keV, compared to low-energy SPECT measurements. A longer time between the transmission and subsequent emission scan is also required for 511-keV-transmission scanning, enabling more motion artifacts.
In this work, we have used 9° of freedom for coregistration purposes, which is the minimum necessary to construct intersubject template data. Although the head can be appropriately modeled as a rigid organ for intrasubject registration, it remains to be shown whether affine (12-parameter) or even nonlinear scaling can improve the intersubject anatomic accuracy of TCT registration. This is not straightforward since external skull information does not necessarily lead to a detailed cerebral standardized anatomic registration (e.g., aged populations with increased atrophy components). Therefore, a more elaborate approach may include prior intrasubject-rigid TCT–MR registration, and successive nonlinear intersubject MR registration and application of the combined transformation parameters to the original ligand data.
Conclusion
This study demonstrated that automated stereotactic registration or anatomic standardization of brain SPECT receptor data using intermediary TCT registration is clinically feasible, accurate, and less time consuming than operator-dependent techniques. C.D. and M.I. minimization algorithms are appropriate for both ECT and TCT SPECT registration, but TCT registration is more accurate that ECT matching for receptor ligand studies, especially with images that show poorly defined anatomy or specific localized anatomic distribution and a high SNR. Especially in abnormal patient receptor data, ECT matching through voxel similarity measures can be highly problematic. Subvoxel accuracy can be obtained by TCT registration in an entirely automated way and without prior preprocessing steps. The average semiquantification uncertainties are acceptable (4.2%–6.1%) with respect to intersubject differences when intermediary TCT matching is performed for receptor ligand data.
Therefore, TCT matching allows an accurate standardized and pixel-to-pixel comparison of receptor ligand emission data, independently of receptor type and ligand occupancy.
Acknowledgments
The authors express their gratitude to the staff at Middlesex Hospital, London (Head Professor P.J. Ell), in particular, D. Costa, MD, PhD, and W. Waddington, PhD, for the use of their striatal phantom. The help of Dutoit Medical, Toshiba Europe, and, in particular, Mr. I. Verbruggen is greatly appreciated for the implementation of 153Gd transmission hard- and software. The authors gratefully acknowledge the logistical support obtained from Nuclear Diagnostics Ltd., Hägersted, Sweden, and Sun Microsystems, Belgium. This work is supported by a special research grant from Ghent University and by a grant from the Flemish government (BOZF 01104699).
Footnotes
Received March 21, 2000; revision accepted Sept. 14, 2000.
For correspondence or reprints contact: Koenraad Van Laere, MD, DSc, Nuclear Medicine Division, P7, Ghent University Hospital, De Pintelaan 185, 9000 Ghent, Belgium.
References
In this issue


Jump to section
Related Articles
Cited By...
- Establishing Age-Associated Normative Ranges of the Cerebral 18F-FDG Uptake Ratio in Children
- SPECT/CT
- Construction and Evaluation of Multitracer Small-Animal PET Probabilistic Atlases for Voxel-Based Functional Mapping of the Rat Brain
- Dual-Tracer Dopamine Transporter and Perfusion SPECT in Differential Diagnosis of Parkinsonism Using Template-Based Discriminant Analysis
- Clinical Testing of an Optimized Software Solution for an Automated, Observer-Independent Evaluation of Dopamine Transporter SPECT Studies
- Decreased 5-HT2a Receptor Binding in Patients with Anorexia Nervosa