


Article Figures & Data
Figures
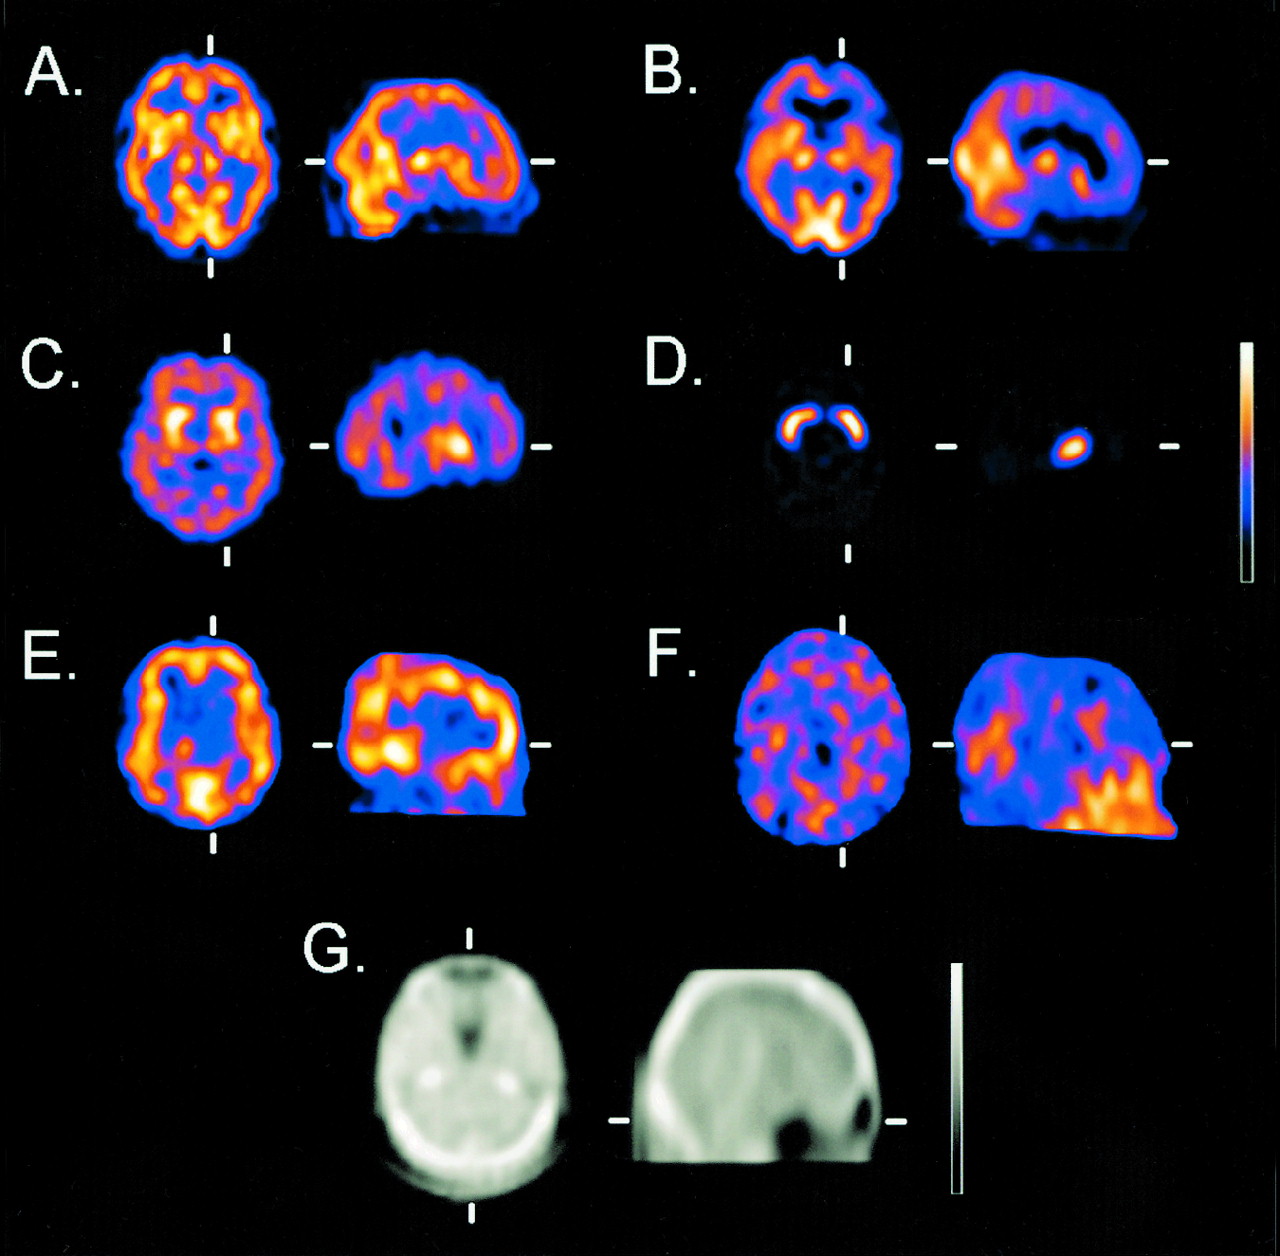
- FIGURE 1.
Representative radioligand studies used for emission registration and transmission images used for transmission registration. Images show transaxial (trx) and sagittal (sag) normal [99mTc]ECD (A), patient with corticobasal degeneration [99mTc]ECD (trx) (B), [123I]IBZM (trx) (C), [123I]β-CIT (striatal phantom, 7:1 ratio of striatum/background; trx) (D), normal [123I]R91150 5-HT2a study (trx + sag; note absence of specific binding in the cerebellum) (E), patient post-suicide attempt (deliberate self-injury) [123I]R91150 5-HT2a (sag) (F), and 153Gd transmission map (trx + sag) (G).
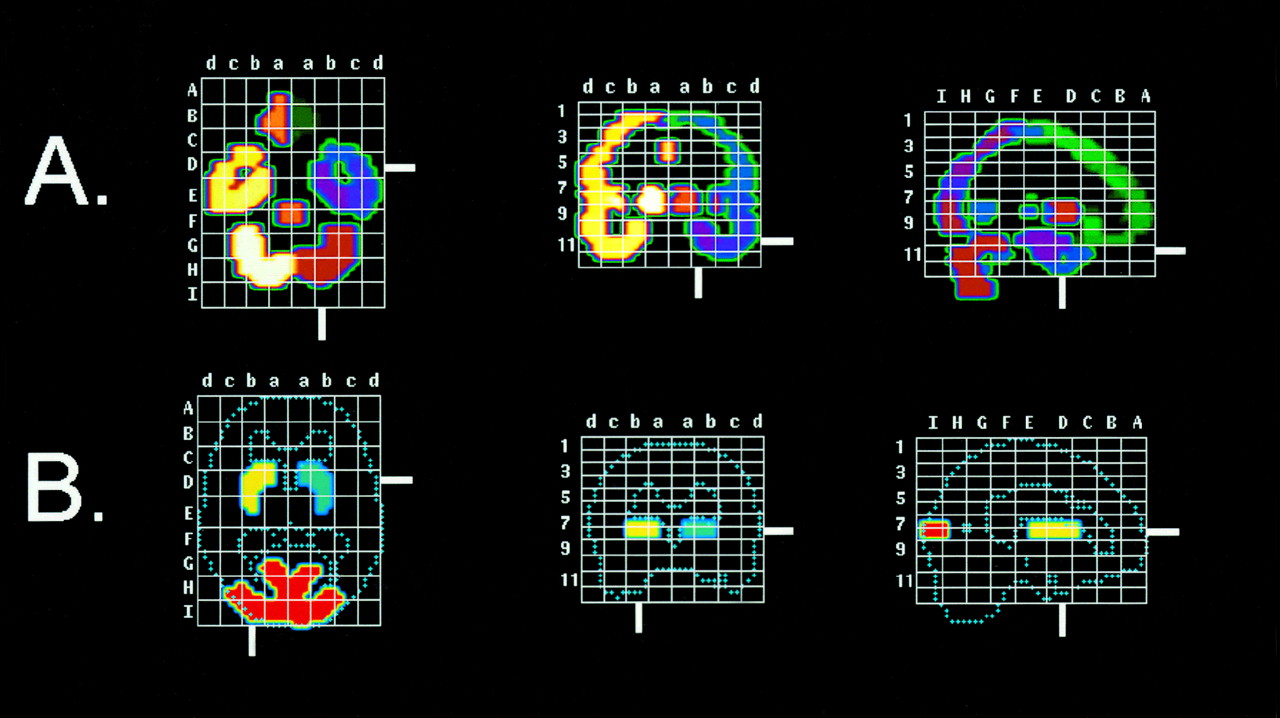
- FIGURE 2.
Stereotactic VOI maps for automated quantification. Maps include representative slices in stereotactic reference frame for [99mTc]ECD perfusion and neocortical receptor ligand [123I]R91150 quantification (A) and stereotactic VOI map for striatal [123I]IBZM and [123I]β-CIT (1.08-cm thickness, centered at site of standard anatomic striatum) (B).
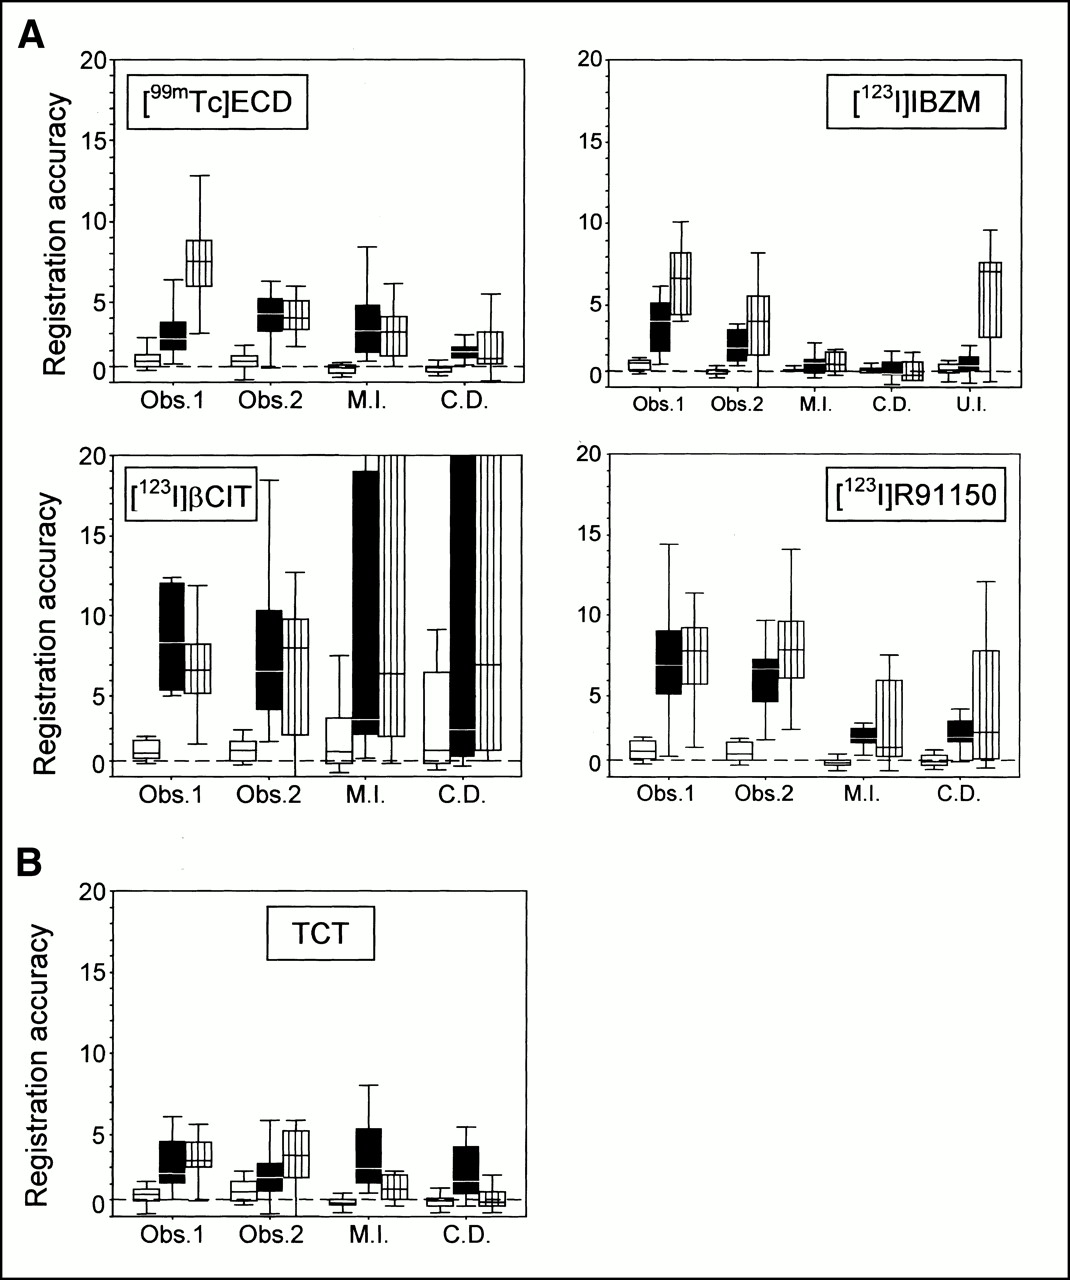
- FIGURE 3.
Accuracy of template registration for different radioligand studies, shown as box-and-whisker plots. The accuracy of emission registration (top four charts) and transmission registration (bottom chart) is given as square root of quadratic sum of subdimensional deviations for translation (open boxes, pixels (1 pixel = 3.59 mm)), rotation (black boxes (degrees)), and scaling (striped boxes (%)). Obs. 1, observer 1; Obs. 2, observer 2.
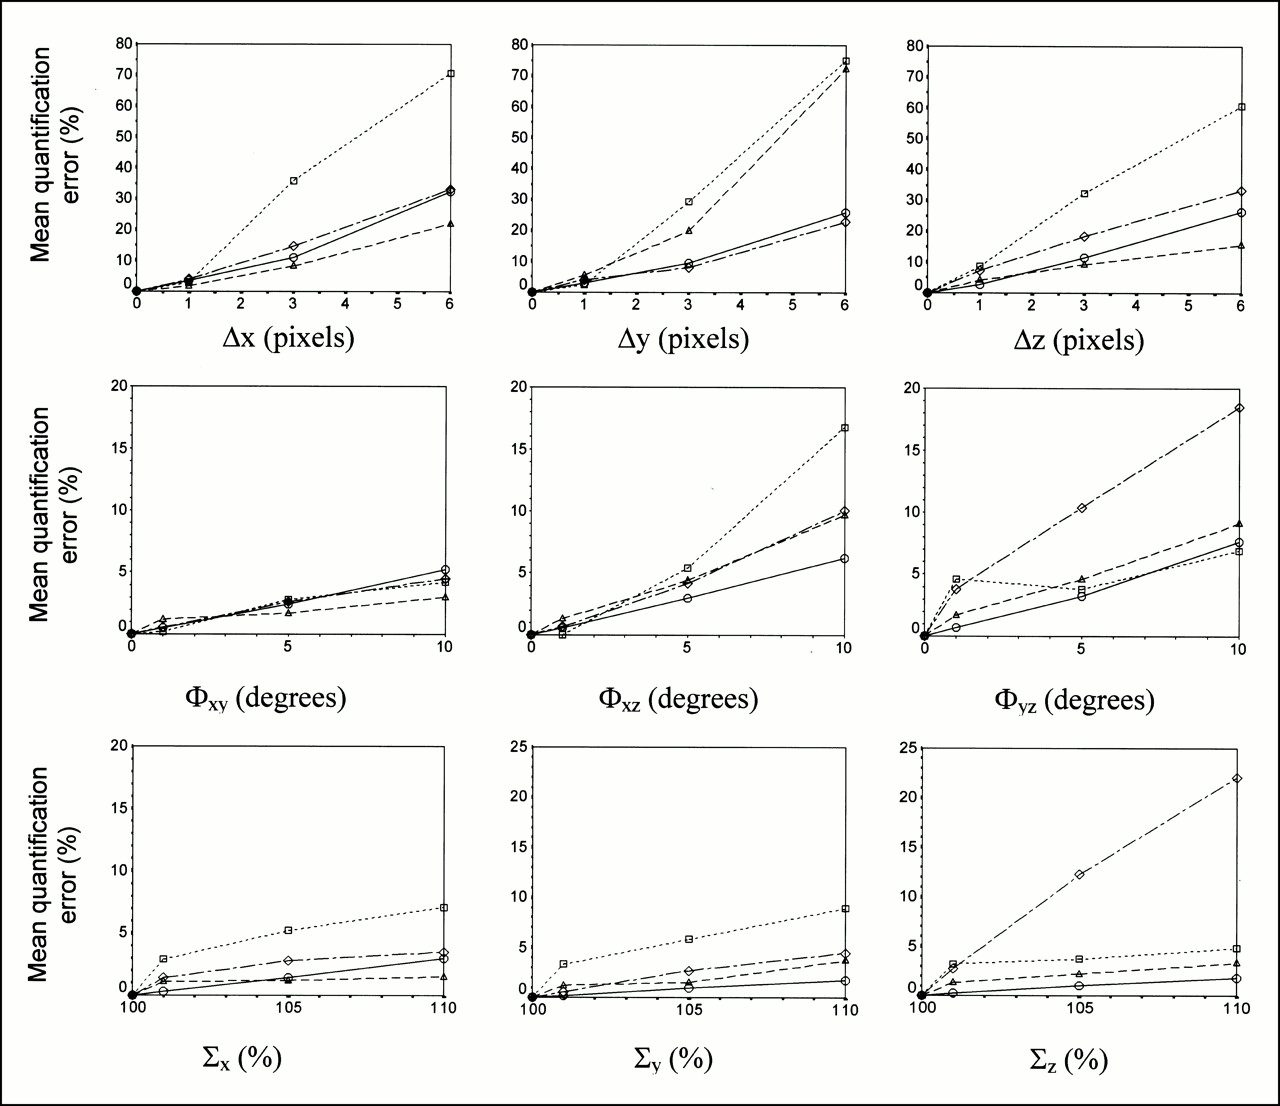
- FIGURE 4.
Mean error on quantification for perfusion and receptor ligand studies as function of shift, scaling, and rotation errors, calculated for a normal study. ○, [99mTc]ECD; ▴, [123I]IBZM; □, dashed line, [123I]β-CIT; ◊, [123I]R91150.
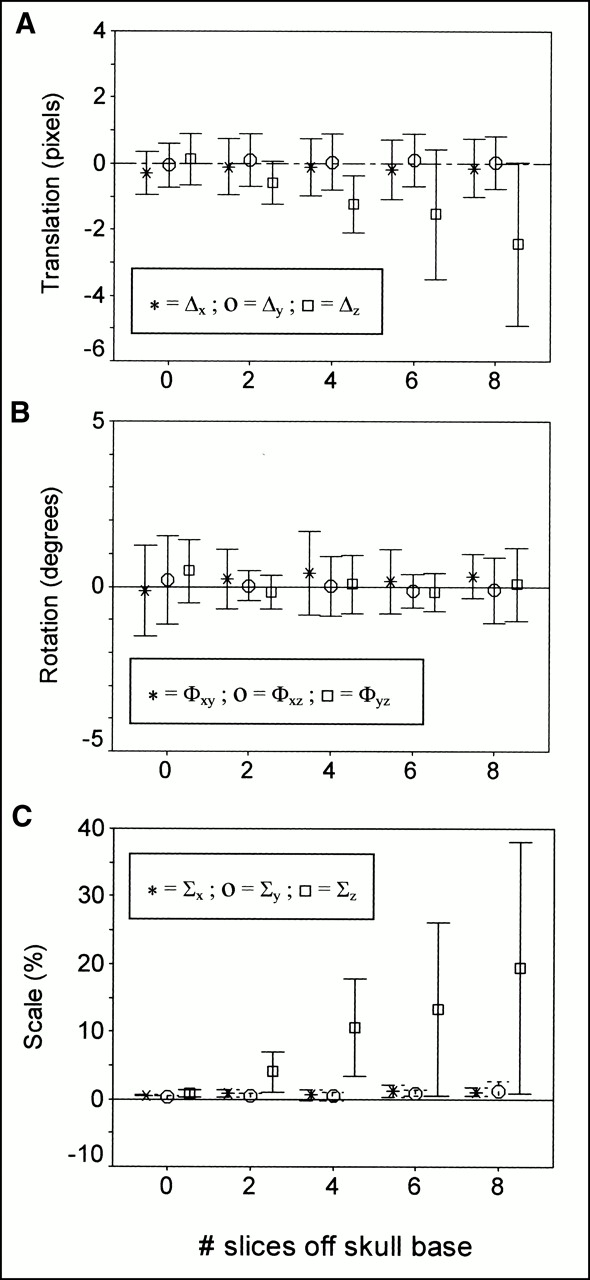
- FIGURE 5.
Residual registration error for count difference in TCT matching as function of incomplete sampling of infratentorial skull, shown as clustered error bar plot. y-axis, 95% CI limits on registration difference. Data are squared quadratic sums of translation (A), rotation (B), and scaling (C) errors.


Tables
- TABLE 1.
Overview of Radioligand Types, Subject Demographics, and Scan Description for Perfusion and Receptor Images
Scan no. Radioligand Age (y) Sex Description 1 [99mTc]ECD 33 M Normal healthy volunteer 2 [99mTc]ECD 60 F Normal healthy volunteer 3 [99mTc]ECD 67 F Cortico-basal degeneration, z-score, left frontal, −3.2 4 [123I]IBZM 52 F Normal uptake (Parkinson) 5 [123I]IBZM 68 M Normal uptake (Parkinson) 6 [123I]β-CIT Phantom Normal 7 [123I]β-CIT Phantom Background uptake R head caudate nucleus 8 [123I]R91150 25 F Normal healthy volunteer 9 [123I]R91150 16 F Eating disorder, slight decreased frontal binding potential (z-score, −1.0) 10 [123I]R91150 43 M Suicide attempt (deliberate self-injury), global decreased uptake (z-score ≤ −3) - TABLE 2.
Coregistration Accuracy for Intrasubject and Template Matching for Perfusion and Receptor Ligand Studies
Study type Intrasubject registration* Template registration* Δtot (pixels) Φtot (degrees) Σtot (%) Δtot (pixels) Φtot (degrees) Σtot (%) [99mTc]ECD Obs. 1 1.1 (0.6) 3.0 (2.1) 4.4 (2.3) 1.4 (0.6) 3.1 (1.6) 7.8 (3.3)† Obs. 2 1.0 (0.4) 3.1 (1.8) 3.2 (1.8) 1.3 (0.5) 3.9 (1.7) 4.2 (2.0) M.I. 0.8 (0.4) 1.0 (0.6) 0.8 (0.3) 0.9 (0.4) 4.2 (3.5)† 3.1 (1.7)† C.D. 0.9 (0.4) 1.0 (0.6) 1.1 (1.1) 0.9 (0.4) 2.0 (0.7)† 2.2 (1.6)‡ U.I. 0.9 (0.4) 1.1 (0.6) 1.1 (0.3) 3.1 (1.5) § § [123I]IBZM Obs. 1 1.1 (0.3) 2.8 (1.3) 2.9 (1.5) 1.4 (0.3) 3.8 (1.7) 6.6 (2.1)† Obs. 2 1.1 (0.4) 2.2 (0.7) 3.1 (2.0) 0.9 (0.2) 2.6 (1.0) 3.7 (2.5) M.I. 0.9 (0.3) 1.0 (0.6) 1.6 (0.4) 0.9 (0.3) 1.6 (1.0) 1.9 (1.7) C.D. 0.9 (0.3) 0.9 (0.6) 1.2 (1.3) 1.0 (0.4) 1.2 (1.0) 1.3 (1.2) U.I. 0.8 (0.3) 1.0 (0.6) 3.4 (5.2) 1.0 (0.4) 1.3 (0.7) 6.7 (4.6) [123I]β-CIT Obs. 1 2.1 (1.8) 7.2 (4.2) 7.5 (2.5) 1.9 (1.5) 8.4 (3.0) 7.1 (3.7) Obs. 2 1.8 (1.6) 8.1 (5.9) 9.5 (6.6) 2.0 (1.6) 7.7 (5.0) 6.5 (4.4) M.I. 1.3 (1.4) 3.4 (4.7) § 2.3 (2.2) 8.6 (8.3) § C.D. 1.7 (1.5) 6.9 (9.4) 6.7 (7.5) 3.1 (3.3) § § U.I. 4.8 (4.4) 5.7 (4.8) 8.7 (3.9) § § § [123I]R91150 Obs. 1 1.7 (2.5) 2.5 (1.4) 2.9 (1.9) 1.9 (1.4) 6.9 (3.6)† 7.9 (4.3)† Obs. 2 1.2 (0.4) 3.2 (1.9) 3.2 (2.0) 1.7 (0.8)‡ 6.0 (2.2)† 8.3 (3.6)† M.I. 0.9 (0.3) 1.1 (0.6) 0.8 (0.3) 0.9 (0.6) 2.9 (1.6)† 3.0 (2.5)† C.D. 0.9 (0.5) 1.1 (0.6) 0.9 (0.7) 1.3 (0.9) 3.7 (2.4)† 4.3 (3.9)† U.I. 0.9 (0.3) 1.0 (0.6) 1.6 (0.5) § § § TCT Obs. 1 1.3 (1.2) 1.8 (1.0) 2.4 (1.5) 1.3 (0.5) 3.5 (2.3)‡ 3.7 (1.8) Obs. 2 1.1 (0.6) 1.7 (1.1) 2.5 (2.3) 1.6 (0.7)‡ 2.5 (1.4) 3.6 (1.9) M.I. 0.9 (0.4) 1.3 (0.6) 1.6 (2.4) 0.8 (0.3) 4.2 (3.3)† 2.8 (3.0) C.D. 0.9 (0.4) 1.2 (0.7) 1.0 (0.8) 0.9 (0.4) 2.4 (1.5)† 1.2 (0.7) U.I. § § § § § § - TABLE 3.
Mean Quantification Error for Emission Versus Transmission Template Matching for Perfusion and Receptor Ligand Studies Based on Count Difference Registration Accuracy
Parameter [99mTc]ECD [123I]IBZM [123I]β-CIT [123I]R91150 ECT TCT ECT TCT ECT TCT ECT TCT Translation Δx 1.6 1.7 0.9 0.9 3.0 1.4 2.0 1.9 Δy 1.4 1.6 2.7 2.8 9.8 1.4 2.4 2.1 Δz 1.2 1.1 1.4 1.6 19.8 3.2 3.6 3.2 All Δ 2.4 2.6 3.2 3.3 22.3 3.8 4.8 4.3 Rotation Φxy 0.3 0.2 0.6 0.7 5.5 1.5 1.9 0.7 Φxz 0.2 0.1 0.8 0.7 10.5 1.6 1.3 0.3 Φyz 0.3 0.2 1.2 0.8 11.2 1.6 4.6 1.5 All Φ 0.5 0.3 1.6 1.3 16.3 2.7 5.1 1.7 Scaling Σx 0.3 1.0 0.7 1.3 2.9 1.5 1.1 1.0 Σy 0.8 0.5 0.7 1.0 7.0 0.8 1.7 1.0 Σz 0.7 0.5 1.2 1.4 4.2 3.5 5.8 3.0 All Σ 1.1 1.2 1.6 2.2 8.0 3.9 6.1 3.3 All dimensions 2.7 2.9 3.9 4.2 28.9 6.1 9.3 5.7 Significance (paired t test) NS (P = 0.9) NS (P = 0.2) P = 0.006 P = 0.021 NS = not significant.
All values are expressed as percentages.
- TABLE 4.
Processing Time (Mean and SD) for Manual and Automated Registration of All Data Types
Radioligand or data type Average processing time (s) (mean (SD)) for registration type Manual Automatic Obs. 1 Obs. 2 M.I. C.D. U.I. [99mTc]ECD 790 (216) 688 (320) 192 (86) 221 (88) 244 (105) [123I]IBZM 381 (105) 384 (122) 234 (98) 207 (78) 232 (126) [123I]β-CIT 402 (141) 483 (247) 189 (58) 177 (88) 180 (34) [123I]R91150 378 (106) 308 (58) 192 (65) 207 (88) 226 (116) TCT 456 (180) 412 (148) 206 (86) 217 (72) 344 (182) All 495 (228) 458 (242) 201 (80) 208 (83) 250 (134) Mean no. of iterations (all) 360 365 464 Average processing time/iteration (all) 0.56 0.57 0.54 Calculations were performed on a 300-MHz Pentium Pro processor (128-Mb RAM).
- TABLE 5.
Translation and Rotation Registration Accuracy for Intrasubject Coregistration Comparing Constrained Versus Unconstrained Scaling, for Mutual Information Minimization
Study type Constrained scaling Scaling free Δtot (pixels) Φtot (degrees) Δtot (pixels) Φtot (degrees) [99mTc]ECD 0.90 (0.26) 0.92 (0.25) 0.89 (0.25) 0.88 (0.31) [123I]IBZM 1.01 (0.12) 0.92 (0.37) 1.01 (0.13) 0.83 (0.31) [123I]β-CIT 0.78 (0.33) 1.44 (0.62) 0.78 (0.36) 2.33 (2.01)* [123I]R91150 0.89 (0.28) 0.86 (0.28) 0.90 (0.27) 0.99 (0.30) TCT 0.89 (0.29) 0.92 (0.21) 0.92 (0.31) 0.93 (0.31) ↵* P < 0.05.
All values are expressed as mean (SD).
Study type Minimization Normal emission scans* Patient emission scans Δtot (pixels) Φtot (degrees) Σtot (%) Δtot (pixels) Φtot (degrees) Σtot (%) [99mTc]ECD M.I. 0.80 (0.45) 4.1 (3.9) 3.0 (1.6) 1.09 (0.11) 4.4 (3.1) 3.3 (2.0) C.D. 0.87 (0.37) 1.95 (0.48) 2.0 (1.9) 0.88 (0.52) 2.1 (1.1) 2.5 (0.8) [123I]β-CIT M.I. 0.80 (0.37) 2.3 (0.8) 2.05 (1.0) 3.8 (2.3)† ∞† ∞† C.D. 0.81 (0.40) 1.34 (0.49) 2.3 (1.4) 5.5 (3.1)† ∞† ∞† [123I]R91150 M.I. 0.94 (0.50) 2.4 (0.6) 1.32 (0.49) 0.95 (0.65) 3.2 (2.0) 3.9 (2.7)† C.D. 1.09 (0.41) 2.1 (1.3) 2.3 (0.9) 1.43 (1.02) 4.5 (2.5)* 5.3 (4.4) TCT M.I. 0.81 (0.26) 4.9 (4.8) 2.9 (2.3) 0.85 (0.38) 4.0 (2.6) 2.8 (3.4) C.D. 1.00 (0.51) 2.4 (1.9) 1.20 (0.83) 0.88 (0.43) 2.5 (1.4) 1.14 (0.75)
In this issue


Jump to section
Related Articles
Cited By...
- Establishing Age-Associated Normative Ranges of the Cerebral 18F-FDG Uptake Ratio in Children
- SPECT/CT
- Construction and Evaluation of Multitracer Small-Animal PET Probabilistic Atlases for Voxel-Based Functional Mapping of the Rat Brain
- Dual-Tracer Dopamine Transporter and Perfusion SPECT in Differential Diagnosis of Parkinsonism Using Template-Based Discriminant Analysis
- Clinical Testing of an Optimized Software Solution for an Automated, Observer-Independent Evaluation of Dopamine Transporter SPECT Studies
- Decreased 5-HT2a Receptor Binding in Patients with Anorexia Nervosa