


Abstract
Automated voxel-based or predefined volume-of-interest (VOI) analysis of rodent small-animal PET data is necessary for optimal use of information because the number of available resolution elements is limited. We have mapped metabolic (18F-FDG), dopamine transporter (DAT) (2′-18F-fluoroethyl(1R-2-exo-3-exe)-8-methyl-3-(4-chlorophenyl)-8-azabicyclo[3.2.1]-octane-2-carboxylate [18F-FECT]), and dopaminergic D2 receptor (11C-raclopride) small-animal PET data onto a 3-dimensional T2-weighted MRI rat brain template oriented according to the rat brain Paxinos atlas. In this way, ligand-specific templates for sensitive analysis and accurate anatomic localization were created. Registration accuracy and test–retest and intersubject variability were investigated. Also, the feasibility of individual rat brain statistical parametric mapping (SPM) was explored for 18F-FDG and DAT imaging of a 6-hydroxydopamine (6OHDA) model of Parkinson's disease. Methods: Ten adult Wistar rats were scanned repetitively with multitracer small-animal PET. Registrations and affine spatial normalizations were performed using SPM2. On the MRI template, a VOI map representing the major brain structures was defined according to the stereotactic atlas of Paxinos. 18F-FDG data were count normalized to the whole-brain uptake, whereas parametric DAT and D2 binding index images were constructed by reference to the cerebellum. Registration accuracy was determined using random simulated misalignments and vectorial mismatching. Results: Registration accuracy was between 0.24 and 0.86 mm. For 18F-FDG uptake, intersubject variation ranged from 1.7% to 6.4%. For 11C-raclopride and 18F-FECT data, these values were 11.0% and 5.3%, respectively, for the caudate-putamen. Regional test–retest variability of metabolic normalized data ranged from 0.6% to 6.1%, whereas the test–retest variability of the caudate-putamen was 14.0% for 11C-raclopride and 7.7% for 18F-FECT. SPM analysis of 3 individual 6OHDA rats showed severe hypometabolism in the ipsilateral sensorimotor cortex (P ≤ 0.0004) and a striatal decrease in DAT availability (P ≤ 0.0005, corrected). Conclusion: MRI-based small-animal PET templates facilitate accurate assessment and spatial localization of rat brain function using VOI or voxel-based analysis. Regional intersubject and test–retest variations found in this study, as well as registration errors, indicate that accuracy comparable to the human situation can be achieved. Therefore, small-animal PET with advanced image processing is likely to play a useful role in detailed in vivo molecular imaging of the rat brain.
Neuroimaging studies are increasingly performed on rodents as models for a variety of human diseases and genetic traits. Rodent models of brain disease encompass all major neurodegenerative diseases and stroke, but also psychiatric diseases such as anorexia nervosa, obesity, depression, and anxiety (1,2). Functional small-animal PET imaging allows longitudinal follow-up, which is important when investigating neuropharmacologic interventions or when characterizing diseases. Because the number of available resolution elements is lower in small-animal PET measurements of rodent brain than in the human PET counterpart, optimal use of information is imperative for detailed regional analysis.
An important step in functional neuroimaging analysis is the development of methods to combine data from different subjects into a common atlas space (3). Spatial normalization, using operator-independent voxel-based algorithms, can increase the sensitivity of low-magnitude responses and facilitate group comparisons (4). The group comparisons can be performed using either automated voxel-based or operator-independent volume-of-interest (VOI) analysis on probabilistic atlases that are oriented into a common stereotactic space—for example, according to Talairach and Tournoux for humans (5). For small-animal imaging, a common digital atlas or template to enable spatial normalization of animal brain MR images has been developed for rats (6), baboons (7,8), and macaque brain. Other atlas-based image analysis methods have been developed as well—for example, by means of simulated PET targets (9), derived from a digitized cryosectioned atlas of a single rat and used in combination with predefined VOIs for quantification of small-animal PET data on the rat brain.
Extension to automated whole-brain analysis methods, either by predefined VOI analysis or by statistical parametric mapping (SPM), has not been systematically investigated. Especially in SPM, voxel-based analysis may offer a unique way of extracting information in a fully automated data-driven approach, which has been shown to be superior in detecting pathologic signals in humans (10).
In the current study, we have used an existing 3-dimensional T2-weighted MRI template, aligned in space with the rat brain atlas of Paxinos (6), onto which we have mapped functional metabolic (18F-FDG), dopamine transporter (DAT) (using 2′-18F-fluoroethyl(1R-2-exo-3-exe)-8-methyl-3-(4-chlorophenyl)-8-azabicyclo[3.2.1]-octane-2-carboxylate [18F-FECT]), and dopaminergic D2 receptor (11C-raclopride) small-animal PET data of healthy rat brains to create ligand-specific templates for the assessment of metabolism and dopaminergic neurotransmission and to investigate population variability in radioligand distribution. First, the accuracy of the template registration process was assessed quantitatively for data on normal and lesioned animals. Second, test–retest and intersubject variability and right-to-left asymmetry indices were determined for all used radioligands by applying the predefined VOI analysis. Finally, the feasibility of SPM in detailed regional analysis of molecular changes in the rat brain was explored in a model of Parkinson's disease, the 6-hydroxydopamine (6OHDA)–lesioned rat model (11), by studying individual rat brains in comparison to a control group with both DAT and metabolic imaging.
MATERIALS AND METHODS
Animals
Ten female Wistar rats (age range, 13–34 wk; body weight range, 242–335 g) were scanned repetitively with 3 radioligands. Furthermore, to demonstrate voxel-based image analysis of the rat brain using functional templates, we studied 3 female 6OHDA-lesioned Wistar rats (age range, 13–17 wk; body weight range, 230–290 g) 7–11 wk after creating the lesions. The lesions were created by injection of 24 μg of 6OHDA (Sigma), dissolved in 3 μL of 0.9% sterile NaCl containing 0.1% ascorbic acid, into the right substantia nigra. The injection coordinates were −4.8 mm anteroposterior, 2.1 mm lateral, and 7.2 mm dorsoventral, using bregma as the reference.
All animals were housed 3 to a cage, at an average room temperature of 22.4°C and with illumination available from 8 am to 8 pm daily. Food and water were given ad libitum. The research protocols were approved by the local Animal Ethics Committee.
Tracer Synthesis
Functional images of the striatal dopamine system were obtained for each rat using the DAT radioligand 18F-FECT (n = 9, 1 animal died) (12) and the D2 receptor radioligand 11C-raclopride (n = 10) (13). Metabolic images were obtained using 18F-FDG (n = 10).
The 18F-FECT PET radiotracer was synthesized according to the procedure of Wilson et al. but using 2-18F-fluoroethyltrifluoromethanesulfonate instead of 2-18F-fluoroethylbromide (12). 11C-Raclopride was obtained by methylating the corresponding nor-precursor with 11C-methyltriflate, whereas 18F-FDG was prepared by using an Ion Beam Applications 18F-FDG synthesis module. Approximately 18 MBq (500 μCi) of each radioligand (specific activity range, 53–760 GBq/μmol; injection volume, 500 μL) were injected into the tail vein using an infusion needle set.
Data Acquisition
Small-animal PET imaging was performed using a lutetium oxyorthosilicate detector–based tomograph (microPET Focus 220; Siemens Medical Solutions USA, Inc.), which has a transaxial resolution of 1.35 mm in full width at half maximum. Data were acquired in a 128 × 128 × 95 matrix with a pixel width of 0.475 mm and a slice thickness of 0.796 mm. The coincidence window width was set at 6 ns. Before being imaged, the rats were anesthetized with an intraperitoneal injection of 50 mg of sodium pentobarbital (Nembutal; Ceva Sante Animale) per kilogram of body weight. All rats were breathing spontaneously throughout the entire experiment.
Time–activity curves for the 3 tracers are shown in Figure 1. For 18F-FECT, pseudoequilibrium binding was reached approximately 3 h after injection. For atlas creation, static 18F-FECT measurements were obtained during 40 min starting 3 h after injection. For 18F-FDG, static acquisitions were performed for 40 min, starting 30 min after injection after overnight fasting (14). Although the time–activity curve for 18F-FDG steadily increases up to 60 min after injection (Fig. 1), we applied an earlier, accurately timed starting point as used in previous literature (15). For 11C-raclopride, dynamic data were acquired during 60 min (frame duration: 4 × 15 s, 4 × 60 s, 5 × 180 s, and 8 × 300 s).
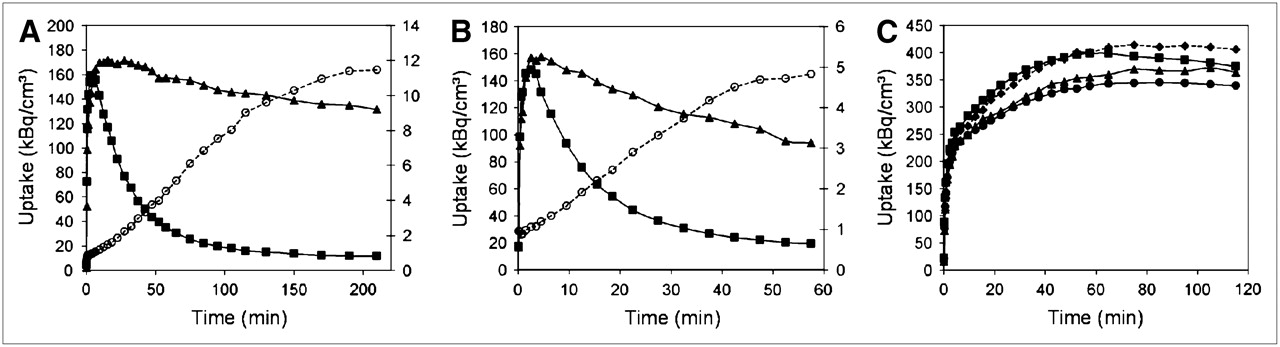
Representative example of time–activity curves for 18F-FECT (A), 11C-raclopride (B), and 18F-FDG (C) expressing regional uptake in striatum (▴), cerebellum (▪), cortex (•), and thalamus (♦). For pre- and postsynaptic dopaminergic ligands, specific-to-nonspecific ratio (striatum to cerebellum [○]) is also shown.
6OHDA-lesioned rats were studied using 18F-FECT and 18F-FDG. All animals were scanned in the prone position with their brain centered in the field of view.
For every tracer, several control animals were scanned twice to estimate test–retest variability (18F-FECT, n = 3; 11C-raclopride, n = 4; 18F-FDG, n = 6). The interval between the 2 scans was 1 d for 18F-FECT and, on average, 6 and 10 wk for 18F-FDG and 11C-raclopride, respectively.
Data Reconstruction
Small-animal PET studies were reconstructed using both filtered backprojection and a statistical maximum a posteriori probability algorithm (MAP) (18 iterations, β = 0.5 resolution) (16). Compared with filtered backprojection, MAP has been shown to result in improved spatial resolution and noise properties on small-animal PET images (17)—an advantage for image registration. On the other hand, filtered backprojection may more accurately estimate radioactivity concentration and was used for quantification. For 11C-raclopride data, MAP reconstructions were made of only the last 30 min of acquisition time. Randoms correction was performed using a delayed coincidence window; no corrections were made for attenuation or scatter.
Atlas Construction
The flowchart of the procedure for atlas creation is shown schematically in Figure 2. Construction of the 3-dimensional T2-weighted MRI template, which is aligned in space with the atlas of Paxinos, has previously been described extensively (6). The following within-modality procedure was repeated for all individual 18F-FECT, 11C-raclopride, and 18F-FDG MAP images of healthy subjects. Of the individual PET images, one was selected as the “representative” brain. Each individual PET scan was then transformed into the space of the representative scan. Data voxel size was scaled by a factor of 10 to approximately fit the human brain size so that default parameter settings in SPM could be applied. This within-modality registration of individual data was performed using the sum-of-squared-differences minimization algorithm and 12-parameter affine transformations only in SPM2 (Wellcome Department of Cognitive Neurology), because this provided the best results on a visual basis. The normalized image datasets were averaged voxelwise to create functional image atlases using the SPM Imcalc function.
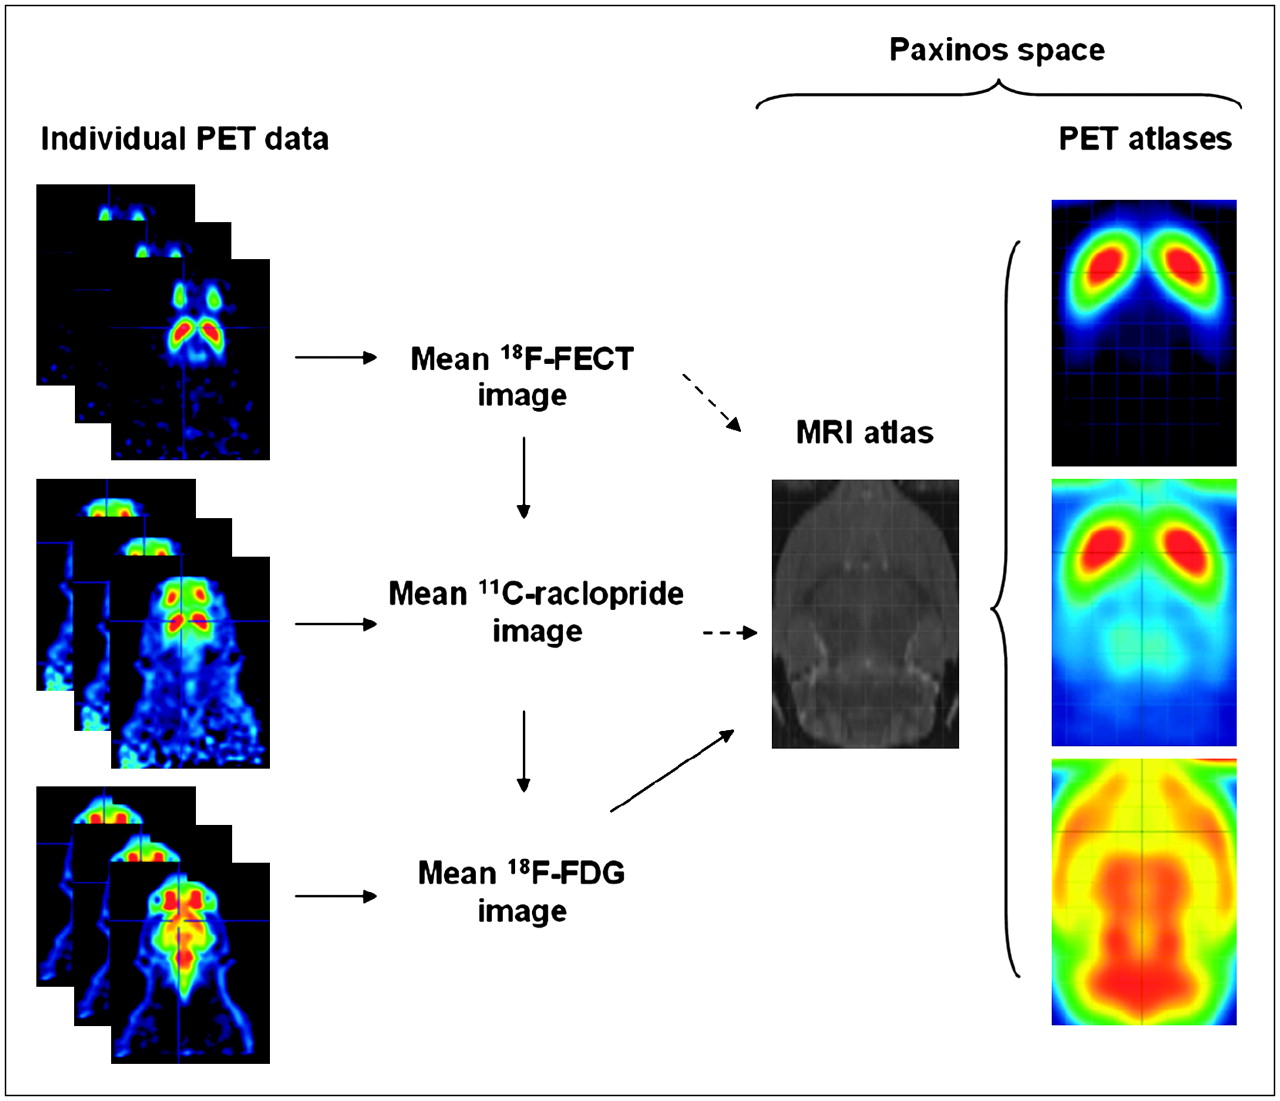
Schematic representation of construction pathway for functional PET atlases. Solid arrows express the followed procedure; dashed arrows, objective. On standardized atlases, stereotactic grid is shown (2-mm interlines).
Cross-modality (18F-FDG PET:MRI) and dopaminergic-to-18F-FDG atlas registrations to obtain ligand-specific templates mapped in Paxinos space were performed using the mutual information maximization algorithm (18), where an adaptation in interpolation method to obtain a smoother cost function is done in SPM2. Consequently, a rat brain spatially normalized to these functional templates will facilitate the reporting of results in coordinates directly corresponding to the Paxinos coordinate system (6).
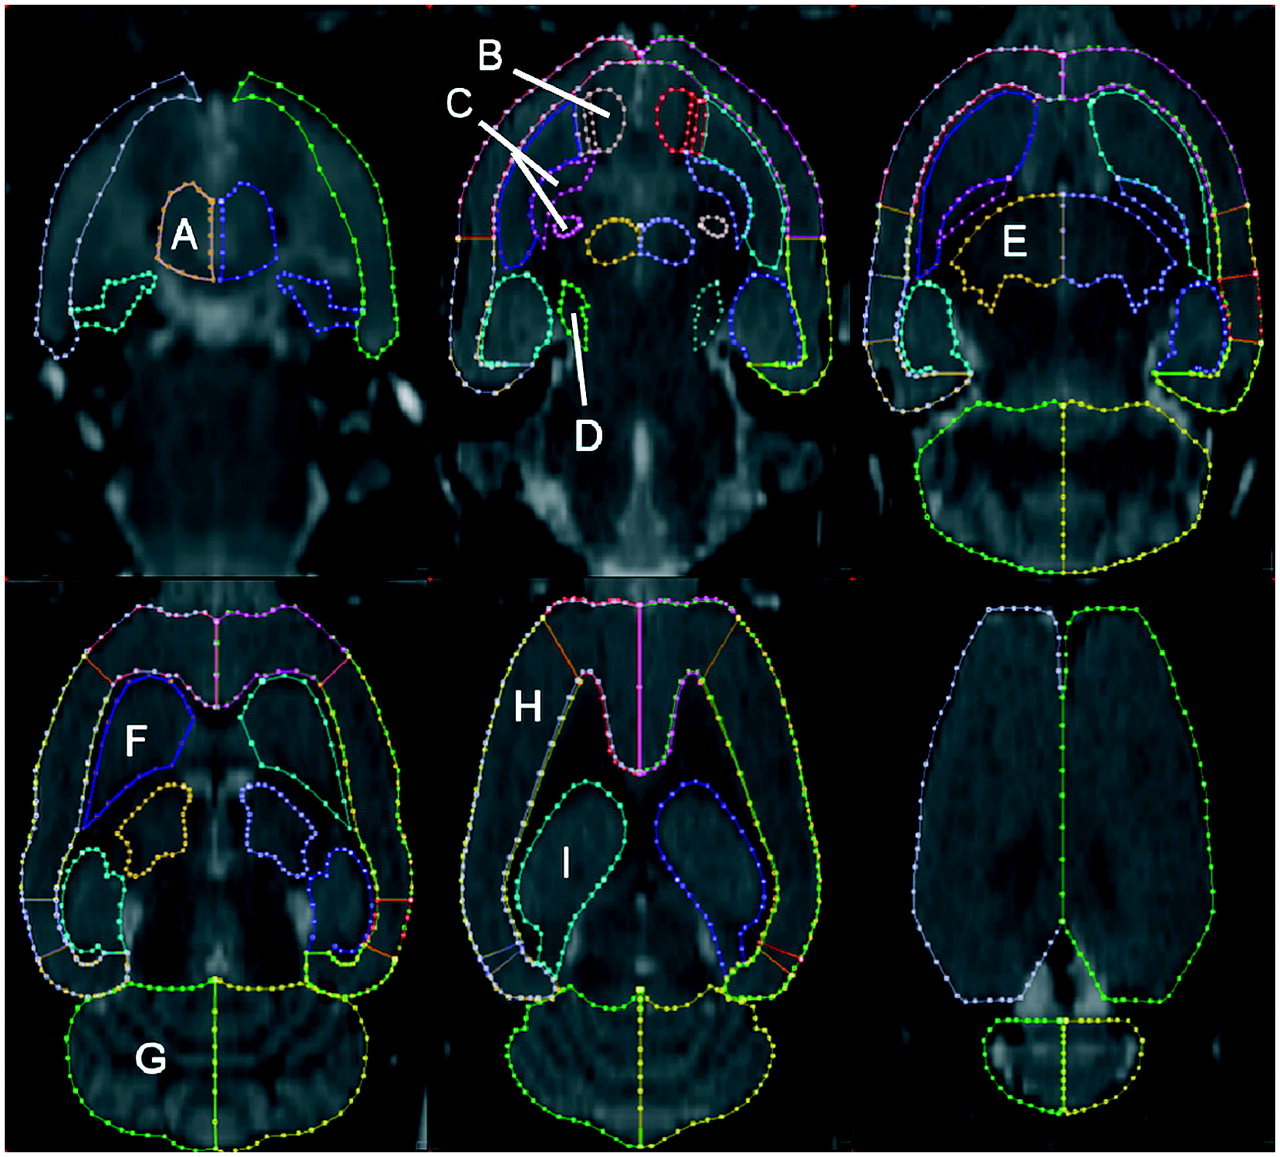
Making use of the stereotactic rat brain atlas of Paxinos, we defined on the MRI template a VOI map representing the major cortical and subcortical structures of the rat brain (5). Each region was primarily defined on horizontal slices, with sagittal and coronal slices used to confirm regional boundaries (PMOD, version 2.65; PMOD Inc.). VOIs were defined separately for the left and right hemispheres and covered 51 slices of the MRI template. VOIs were defined for the rat brain caudate-putamen, globus pallidus, nucleus accumbens, cerebellum, cerebral cortex, thalamus, hypothalamus, hippocampus, pituitary gland, and pons (substantia nigra). The VOIs, superimposed on horizontal slices of the rat brain MRI atlas, are displayed in Figure 3.

MRI atlas showing representative horizontal images at multiple levels of rat brain (7 slices apart; radiologic orientation). Many cortical and subcortical structures have been identified: hypothalamus (A), nucleus accumbens (B), globus pallidus (C), pons (substantia nigra) (D), thalamus (E), caudate-putamen (F), cerebellum (G), cerebral cortex (H), and hippocampus (I). Also see Table 1.
Data Analysis
Voxelwise parametric DAT and D2 binding index images were constructed from original filtered backprojection data by reference to the cerebellum using, for 11C-raclopride data, the Ichise MRTM2 module in PMOD (19). DAT binding index parametric images were constructed by a voxelwise calculation: (tissue/average activity concentration cerebellum) − 1). 18F-FDG data were count normalized to the whole-brain uptake. Transformations obtained after mapping individual MAP data to ligand-specific PET templates were passed on to parametric dopaminergic binding index images and 18F-FDG–filtered backprojection data for quantification purposes.
Determination of Registration Accuracy
The following experiment was performed to quantitatively assess the registration accuracy of mapping individual MAP data to the ligand-specific PET templates. The anatomically standardized image volume from a MAP PET study of a control animal and a 6OHDA-lesioned animal underwent 40 random misalignments each time: 10 translations, 10 rotations, 10 linear stretchings, and 10 combinations of the 3 previous parameters. This was done for all 3 tracers in the case of the control animal and for the 18F-FECT and 18F-FDG data in the case of the 6OHDA-lesioned rat. The misalignments were uniformly distributed (random number generation function in Excel 2003; Microsoft) within −5 to +5 mm of translation, −20° to +20° of rotation, and −10% to +10% of scaling along the 3 orthogonal axes/planes. For the combination misalignments, rotations were allowed only within a range of 10° in the 3 main planes. The amount of deliberate misalignment was based on typical magnitudes that can occur in realistic situations. Each resultant image volume was then reregistered to the study-specific template using the automated spatial normalization procedure (12-parameter affine) integrated in SPM2. For each voxel (x,y,z) in the original image, the position (x + Δx, y + Δy, z + Δz) after reregistration was computed. This position was determined by means of 3 self-constructed images in which neighboring voxels differed by 1 unit in the x, y, and z directions. The distance ( was averaged over all rat brain voxels and used as a measure of accuracy.
General Statistics
Regional intersubject and test–retest variability, as well as right-to-left asymmetry indices, were calculated from VOI-derived measurements of radioactivity concentration. The test–retest variability for radioligand index (relative metabolic activity and binding index) Ri in VOI region i was determined as |Ri,1 – Ri,2| × 2/(Ri,1 + Ri,2), where the indices 1 and 2 refer to the 2 different scans of the same animal.
SPM
A categoric subject design using conditions (disease vs. controls) was performed on parametric DAT and 18F-FDG images of 3 individual 6OHDA-lesioned rats in comparison to the respective control data. Spatially normalized images were masked to remove extracerebral signal that would disrupt the global normalization for 18F-FDG. All images were smoothed with a 16-mm isotropic gaussian kernel. SPM analysis of parametric DAT data was performed without global normalization, whereas for 18F-FDG data, proportional scaling with a threshold of 0.8 of the maximum image intensity was applied (scaled to 50 mL/100 g/min). For statistical analysis, T-map data were interrogated at a peak probability level of 0.001 (uncorrected) and an extent threshold of more than 50 voxels, unless indicated otherwise. Because of the conventional orientation in SPM2, the x-axis in the MRI template is negative to the right of the midline and positive to the left (6).
RESULTS
Multitracer Small-Animal PET Probabilistic Atlases
Figure 4 shows the metabolic, DAT, and D2 receptor small-animal PET templates aligned in space with the rat brain atlas of Paxinos. The regional mean uptake, intersubject and test–retest variability, and right-to-left asymmetry indices of 18F-FECT, 11C-raclopride, and 18F-FDG are displayed in Table 1.

(A) Series of axial sections (ventral to dorsal; slice interval, 1.2 mm; radiologic orientation) through rat brain MRI atlas (top row) and coregistered small-animal PET templates. (B) One representative coronal (radiologic orientation) and sagittal slice through striatum. (C) Horizontal section through variance map at level z = −5.8 (relative to bregma). Color bars indicate relative intensities for 18F-FDG and binding indices for DAT and D2 ligands. Note higher uptake of 18F-FDG in inferior colliculus, visualization of D2 receptors in rat midbrain, and availability of DAT in substantia nigra (arrows). RAC = raclopride.
Mean Uptake, Intersubject Variability, Test–Retest, and Right-to-Left Asymmetry Indices Obtained Using Predefined VOI Analysis
As can be seen from these templates and Table 1, relative 18F-FDG activity in the rat brain shows a fairly homogeneous and symmetric uptake in the cortex and brain stem and the highest relative activity in the cerebellum and inferior colliculus. The lowest uptake is seen in the medial temporal cortex, brain stem, and pituitary gland. Intersubject variation for 18F-FDG ranged from 1.7% in the hippocampus and cerebral cortex to 6.4% in the pituitary gland. Regional test–retest values for metabolic normalized data were slightly lower, with a range from 0.6% in the hippocampus to 6.1% in the pituitary gland. Right-to-left ratio ranged from 0.963 (±0.017) in the temporal medial cortex to 1.013 (±0.009) in the cerebellum.
As for 11C-raclopride, caudate-putamen binding is on average 2.45, with an SD of 0.27, which is comparable to the situation in humans, where a factor of 2.35 is found in healthy subjects (20). Modest uptake is also seen in the brain stem, including the inferior colliculus. The test–retest variability of the caudate-putamen was on the same order as intersubject variability for 11C-raclopride, namely 14.0% and 11.0%, respectively.
18F-FECT shows a high binding index of almost 9 and a relatively low intersubject variation of 5.3%. Test–retest variability was 7.7% for the caudate-putamen and 10.4% for the nucleus accumbens. The values of test–retest variability for 18F-FECT and 11C-raclopride were determined in a small sample, which is likely to give conservative values.
Registration Accuracy
Table 2 summarizes mean registration errors obtained when comparing guided misaligned MAP PET image volumes from a control and a 6OHDA-lesioned animal with their original spatially normalized image volumes. All results are reported in real distances (scaling factor of the images in SPM taken into consideration, so the reconstructed pixel size is actually 0.2 mm).
Estimates of Registration Accuracy for Tracers and Animals Used in This Study After Reregistration of Randomly Misaligned Data
For the control animal, in all cases, the best results were obtained for 11C-raclopride and 18F-FDG data, whereas 18F-FECT data showed the largest registration errors, likely because of the absence of a very specific signal outside the striatum. For 11C-raclopride, the average translation and rotation errors were both 0.238 mm (range, 0.056–0.526 mm), whereas the average combination and linear stretching errors were 0.252 mm (combination range, 0.051–0.558 mm; linear stretching range, 0.054–0.564 mm). In comparison, larger registration errors occurred after linear stretching and combined transformations for an 18F-FDG image volume: 0.344 mm (range, 0.002–0.796 mm) and 0.344 mm (range, 0.002–0.779 mm), respectively. The average 18F-FDG translation and rotation errors were both 0.348 mm (range, 0.003–0.772 mm). For 18F-FECT, the average combined error was 0.416 mm (range, 0.017–1.113 mm), whereas the average linear stretching error was 0.428 mm (range, 0.011–1.195 mm). The average 18F-FECT translation and rotation errors were 0.428 mm (range, 0.020–1.080 mm) and 0.427 mm (range, 0.020–1.080 mm).
Reregistration of randomly misaligned data to the ligand-specific templates was less accurate for 6OHDA-lesioned rat data in comparison to control data, because of the induced lesion and the corresponding functional alterations, which result in asymmetric image information. The largest registration error was obtained for 18F-FECT data. The average combined error was 0.862 mm (range, 0.003–2.601 mm), whereas the average linear stretching error was 0.812 mm (range, 0.004–4.244 mm). The average 18F-FECT translation and rotation errors were 0.734 mm (range, 0.011–1.514 mm) and 0.712 mm (range, 0.001–1.920 mm), respectively. Reregistration of one 18F-FECT MAP image volume with the highest rotation values failed, and this outlier result was excluded. For 18F-FDG, the average translation and rotation errors were both 0.580 mm (translation range, 0.089–1.545 mm; rotation range, 0.089–1.544 mm), whereas the average combination and linear stretching errors were 0.577 mm (range, 0.087–1.573 mm) and 0.585 mm (range, 0.084–1.630 mm), respectively.
SPM Analysis of 6OHDA-Lesioned Rat Model
Statistical parametric maps from the metabolic/presynaptic dopaminergic characterization of individual 6OHDA-lesioned rats, compared with the control group, are shown in Figure 5. A highly significant reduction in DAT availability in the right striatum is seen in the lesioned rats, compared with the controls (P ≤ 0.0005, corrected for multiple comparisons; Paxinos coordinate peak maximum, (x,y,z) = (−3.8, −0.8, −5.8) for all subjects). The intensity of the deficit (percentage change in right striatal binding index vs. controls) was 99.4%, 98.0%, and 95.4% for the 3 animals.
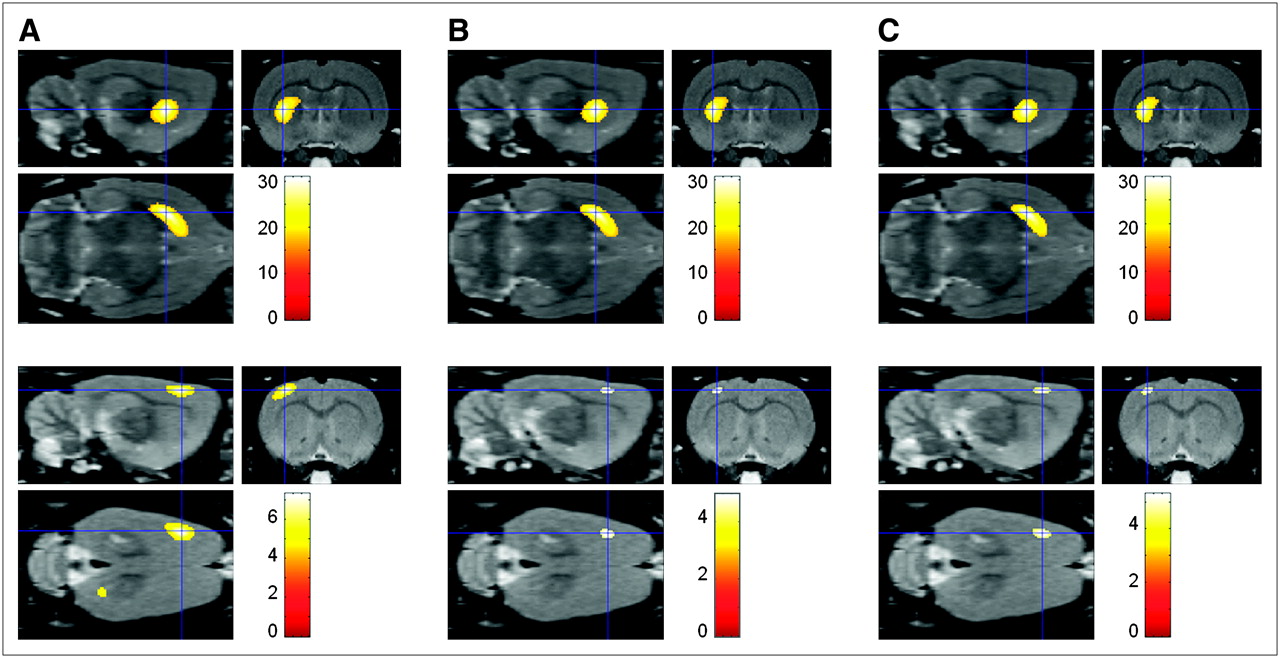
Statistical parametric maps of 3 lesioned 6OHDA animals (1 animal each in A, B, and C). Differences for brain regions have been color coded and are superimposed on MRI template in 3 orthogonal planes. Sections with T-maps are rendered on MRI atlas of rat brain and show a significant reduction in DAT availability (top row) and glucose metabolism (bottom row). Colored bars on right express T-score levels. Intersection points of 3 planes have been set to position of maximum (i.e., (x,y,z) = (−3.8, −0.8, −5.8), Paxinos coordinates), which corresponds to right striatum.
Also, a significant glucose hypometabolism was noted in comparison to controls in the right sensorimotor cortex (P ≤ 0.0004; peak maximum, (−3.6, 0.8, −2.0), (−3.4, 0.4, −2.0), (−3.4, 0.8, −2.0) for subjects A, B, and C, respectively). The mean glucose metabolic decrease was 10.0% versus controls (−12.1%, −8.3%, and −8.8% for subjects A, B, and C, respectively).
DISCUSSION
This work evaluates the construction of MRI-based functional templates of the rat brain in Paxinos standard space and their application to automated standardized analyses—using both a predefined-VOI approach and an SPM approach—of small-animal PET studies. This work also highlights the exemplary use of both analysis approaches by means of regional variability assessment and SPM analysis of pathologic data. The intersubject and test–retest variation, as well as the registration errors obtained in this study, indicate that accuracy comparable to that in the human situation can be achieved.
The total number of resolution elements in the rat brain (weighing about 1–2 g (21)) is limited to a few hundred calculated from a resolution of 1.5 mm in full width at half maximum. It is therefore of the utmost importance that the amount of information be used maximally in these functional images. The limitations of operator-dependent ROI or VOI approaches are well known (10). The optimal way to maximize performance is by using a data-driven approach such as SPM, whereas in some instances—for reasons of a priori hypotheses or for sensitivity reasons—a predefined-VOI approach may be preferred (22). In both cases, added variability through inter- and intraobserver subjectivity in placement of regions is eliminated.
In our approach, use of an average small-animal MRI template, aligned in space with the rat brain Paxinos atlas, allows the reporting of SPM results in coordinates directly corresponding to the Paxinos coordinate system, as well as an accurate definition of all major VOI structures because of the direct relationship between the coordinates of the Paxinos atlas and the MRI template voxels (6).
The constructed probabilistic PET atlases were averaged from several female Wistar rats. However, because of the similar anatomy for the given weight range, the atlases may also be used for spatial normalization of similar strains of rats or for the male sex (23), although the uptake values or binding indices might theoretically differ slightly because of changes in the menstrual cycle or other hormonal effects. These effects are second order for the current tracers when studied in humans and need to be investigated in more detail in rodents.
Validation of registration accuracy is of vital importance but often difficult. Determining registration errors by observer assessment and external fiducial markers has some drawbacks. As was our experience, reproducibility of animal positioning within a restraining or even stereotactic device proves to be insufficient for calibration purposes. The applied technique of reregistration of controlled misregistrations to evaluate the performance of a registration algorithm has been used in several studies (9,24). This technique assesses the robustness of the registration algorithm, thereby giving a realistic idea of the accuracy that can be obtained.
The automated spatial normalization procedure (12-parameter affine) integrated in SPM2 succeeded in obtaining similar registration accuracies independent of the type of transformation applied a priori. Registration errors within the range of 0.24–0.86 mm indicate that a sufficient accuracy for novel animals can be achieved for subsequent quantitative analysis. The registration errors found in this study, both for normal and pathologic data, are in relative agreement with published human data when relative values are considered with respect to imaging resolution (e.g., corresponding to 2- to 3-mm accuracy for PET or SPECT devices with 4- to 10-mm resolution) (25). They are, however, higher than the values reported by Rubins et al., who found an accuracy of 0.05 mm and 0.05° using the mutual-information algorithm to reregister misaligned PET images of the rat brain (9), but the accuracy was not clearly defined in their work and they applied translation and rotation separately on a single image. Moreover, the registration errors found in this work are even better than the errors obtained when using a stereotactic frame for repositioning the rat brain in serial PET studies (15).
Few reports have studied the implications of misalignments on quantitative measures in the (human) brain. Sychra et al. found that registration errors for single-axis-shift differences of 0.7 mm and 1° of rotation may produce intensity errors of 5%–10% on the voxel level using a voxel size of 5.6 mm (26). However, this estimation produces a maximum possible error that is diminished by considering larger adjacent regions or clusters as is done with the SPM approach, where smoothing is the standard applied technique to level out intersubject anatomic differences in the spatial normalization method. Therefore, it is expected that VOI analysis and statistical voxel-based analysis will result in significantly lower (semi)quantitative errors.
The mean translation, rotation, linear stretching, and combination errors found for the control animal in this work were strongly dependent on the radioligand used. The striatal specific uptake and the global cerebral aspecific distribution of raclopride, with the exception of some midbrain areas, proved to be superior in registration accuracy. On the opposite side, 18F-FECT uptake is characterized by a high signal-to-noise ratio and poor anatomic information because of the high specificity of the ligand used. Lesion induction and corresponding functional alterations resulted in less accurate registrations for the radioligands used, but still below the system resolution and comparable to pathologic human data.
The reported intersubject variability comprises image registration error, true nonlinear anatomic differences among the individual rat brains, and functional differences. In humans, variations in anatomy are often reduced by applying nonlinear warping techniques during spatial normalization, whereas in this study only affine transformations were applied. In this work, we have not yet considered applying nonlinear deformations because these need to be validated in detail for the rat brain, especially lesioned brains (27). Test–retest coefficients of variation, shown in Table 1, are consistent in magnitude with published measurements in humans (28–30) and in animal pilot studies using 123I-N-ω-fluoropropyl-2-β-carboxymethoxy-3β-(4-iodophenyl)nortropane small-animal SPECT (31) and 11C-raclopride small-animal PET (32). This finding confirms the possible utility of small-animal imaging as a precise molecular biomarker tool for longitudinal evaluation, such as in studies of disease progression or after neuromodulatory interventions. In view of the known negative aging effect of dopamine D2 receptor expression (33) and the possibility of additional environmental influences, the relatively long interval between 11C-raclopride PET scans (average, 10 wk) can be seen as a conservative estimate for the reproducibility of 11C-raclopride imaging in rats.
Examination of the intersubject and test–retest variability of template VOI measurements only within our method may not provide insight into the accuracy of the template method itself, because variability reflects several factors other than the accuracy of registration. Previous studies have compared intersubject and test–retest variability values between template-based methods and the traditional individual VOI method without using templates. In control animals, Rubins et al. (9) found a significant decrease in right–left binding index differences using their cryosectioned atlas-derived VOI method than using manually drawn ROIs. The test–retest variability was also lower using an atlas-derived VOI method. Moreover, reduced intersubject and test–retest variability by atlas-derived methods has been demonstrated repeatedly for human brain imaging.
Additionally, we demonstrated the feasibility of using the functional rat brain templates in an experiment to characterize metabolic/dopaminergic alterations in a 6OHDA rat model of acute Parkinson's disease. The reduction in striatal DAT binding is a well-known feature in 6OHDA-lesioned rats, primarily validated using invasive histologic and electrophysiologic analysis (34), and correlates to the nigrostriatal dopaminergic damage inflicted by toxin administration (35). Additionally, a metabolic decrease in the ipsilateral sensorimotor cortex was found, pointing to a hypofunctional striatocortical network that corresponds to corticosubcortical network findings in humans (36). This feasibility substudy therefore shows that multitracer small-animal PET is a promising and sensitive tool for evaluations of rat models of brain disease and translational investigations of correspondence to human disease.
An important limitation of the study, and an issue for further research, is correction for the partial-volume effect (37). At present, even the relatively high resolution of the microPET Focus 220 precludes detailed functional brain scanning in mice for most applications. Nevertheless, the availability of multiple transgenic mouse models for various neurologic disorders would allow the neuroimaging community to take a giant leap into functional characterization of these widely studied and well-characterized genetically induced disease models. Also, for identification of activity in smaller nuclei centrally in the rat brain, partial-volume-effect corrections would be advantageous. For such applications, first, the issues of (automated) intermodality high-resolution small-animal PET-to-MRI registration need to be resolved, and segmentation algorithms need to be optimized for rodent brains. Then, algorithms for partial-volume-effect correction that have been developed for human brain imaging (38,39) could be extended to use in rodents.
In comparison to human studies, the animals in this study received a relatively high dose of radiotracer. Because the average weight of humans versus rats has a ratio of approximately 300, care needs to be taken not to induce pharmacologic effects. For the specific activity administered, the calculated percentage receptor occupancy of 11C-raclopride ranged from 0.4% to 8%. This range is still unlikely to induce a major pharmacologic effect, such as dyskinesia, which is observed at an occupancy of over 50% for dopamine D2 receptors (40).
CONCLUSION
Functional rat brain templates in stereotactic Paxinos coordinate space allow automatic anatomic standardization of anatomic and functional rat brain scans with the necessary registration accuracy and the standardization of predefined VOI or SPM analysis. Because test–retest and intersubject variability are comparable to the human situation, a path is formed for precise interventional or longitudinal studies in the rat brain for disease characterization or treatment response.
Acknowledgments
We thank Erwin Lauwers for invaluable help with animal preparation; Marva Bex, Tjibbe de Groot, and Dominique Vanderghinste for radiopharmaceutical preparation; and Patrick Dupont for advice on data handling. This work is financially supported by the Research Council of the Katholieke Universiteit Leuven (OT/05/58), the Flemish Research Foundation FWO (G.0548.06), and the Institute for Science and Technology SBO (AniMoNe) and is conducted under the European Community FP6 Network-of-Excellence DiMI (LSHB-CT-2005-512146)/EMIL (LSHC-CT-2004-503569).
Footnotes
-
COPYRIGHT © 2006 by the Society of Nuclear Medicine, Inc.
References
- Received for publication May 30, 2006.
- Accepted for publication August 14, 2006.


Jump to section
Related Articles
Cited By...
- Preclinical Evaluation of 18F-JNJ64349311, a Novel PET Tracer for Tau Imaging
- Preclinical Evaluation of a P2X7 Receptor-Selective Radiotracer: PET Studies in a Rat Model with Local Overexpression of the Human P2X7 Receptor and in Nonhuman Primates
- Preclinical Evaluation and Quantification of 18F-FPEB as a Radioligand for PET Imaging of the Metabotropic Glutamate Receptor 5
- Micro-Positron Emission Tomography Imaging of Rat Brain Metabolism during Expression of Contextual Conditioning
- A PET Brain Reporter Gene System Based on Type 2 Cannabinoid Receptors
- Progressive Metabolic and Structural Cerebral Perturbations After Traumatic Brain Injury: An In Vivo Imaging Study in the Rat
- Preclinical Evaluation of 18F-JNJ41510417 as a Radioligand for PET Imaging of Phosphodiesterase-10A in the Brain
- A Mouse Model Characterizing Features of Vascular Dementia With Hippocampal Atrophy * Supplemental Methods