


Abstract
PET of gene expression in the brain may greatly facilitate neuroscience research and potential clinical implementation of gene or cell therapy of central nervous system diseases. To date, no adequate PET reporter system is available for the central nervous system because available tracers either do not cross the intact blood–brain barrier or have high background signals. Here we report the first, to our knowledge, PET reporter system for imaging gene expression in the intact brain. Methods: We selected the human type 2 cannabinoid receptor (hCB2) as a reporter because of its low basal expression in the brain. An inactive mutant (D80N) was chosen so as not to interfere with signal transduction. As a reporter probe we used the 11C-labeled CB2 ligand, 11C-GW405833, which readily crosses the blood–brain barrier. Dual-modality imaging lentiviral and adeno-associated viral vectors encoding both hCB2(D80N) and firefly luciferase or enhanced green fluorescent protein were engineered and validated in cell culture. Next, hCB2(D80N) was locoregionally overexpressed in rat striatum by stereotactic injection of lentiviral and adeno-associated viral vectors. Results: Kinetic PET revealed specific and reversible CB2 binding of 11C-GW405833 in the transduced rat striatum. hCB2 and firefly luciferase expression was followed until 9 mo and showed similar kinetics. Both hCB2 expression and enhanced green fluorescent protein expression were confirmed by immunohistochemistry. Conclusion: Dual-modality imaging viral vectors encoding hCB2(D80N) were engineered, and the reporter system was validated in different animal species. The results support the potential future clinical use of CB2 as a PET reporter in the intact brain.
Gene therapy is an investigational technique for various neurologic diseases (1). Besides locoregional delivery of the therapeutic agent, the main challenges are assessment of location, magnitude, and duration of gene expression in the treated subjects. To meet this requirement, expression of the therapeutic gene can be linked with that of a reporter gene (2). Several reporter systems for molecular imaging have been developed (3), such as enhanced green fluorescent protein (eGFP, fluorescence detection) (4), firefly luciferase (fLuc, bioluminescence imaging) (5), and herpes simplex virus type 1 thymidine kinase (HSV1-tk), the expression of which can be visualized with PET or SPECT after injection of a radiolabeled HSV1-tk substrate (6).
PET offers sensitive and quantitative 3-dimensional imaging with the potential of translation to clinical applications. Ideally, the reporter gene should be nonimmunogenic and metabolically inactive but should not be endogenously expressed. The reporter tracer should be able to cross the blood–brain barrier (BBB), should have high affinity and selectivity for the protein encoded by the reporter gene, and should have fast washout kinetics (7). Despite the promising results in peripheral tissues, molecular imaging of reporter genes in the brain is hampered by penetration issues (8) or confounding signals due to high endogenous levels (9).
Since the discovery of cannabinoid receptors, the endocannabinoid system has shown promise as a target for the treatment of neurodegenerative diseases, cancer, obesity, inflammatory bowel disease, and pain (10). The endocannabinoid system is distributed throughout the body and involves at least 2 types of G-protein–coupled receptors, namely type 1 cannabinoid receptor (CB1) and type 2 cannabinoid receptor (CB2) (10). CB1 is one of the most abundantly expressed receptors of the central nervous system, whereas CB2 is mainly found in spleen and cells of the immune system (11). In physiologic conditions, CB2 expression in the brain is low and present only in the cerebellum and pons, but expression can be upregulated in inflammatory conditions by activated microglia (12). The highly conserved aspartic acid D80 in the second transmembrane domain of CB2 is functionally important for G-protein coupling. A mutant form of human CB2 with a D80N substitution displays wild-type ligand recognition and binding but is deficient for signal transduction (13).
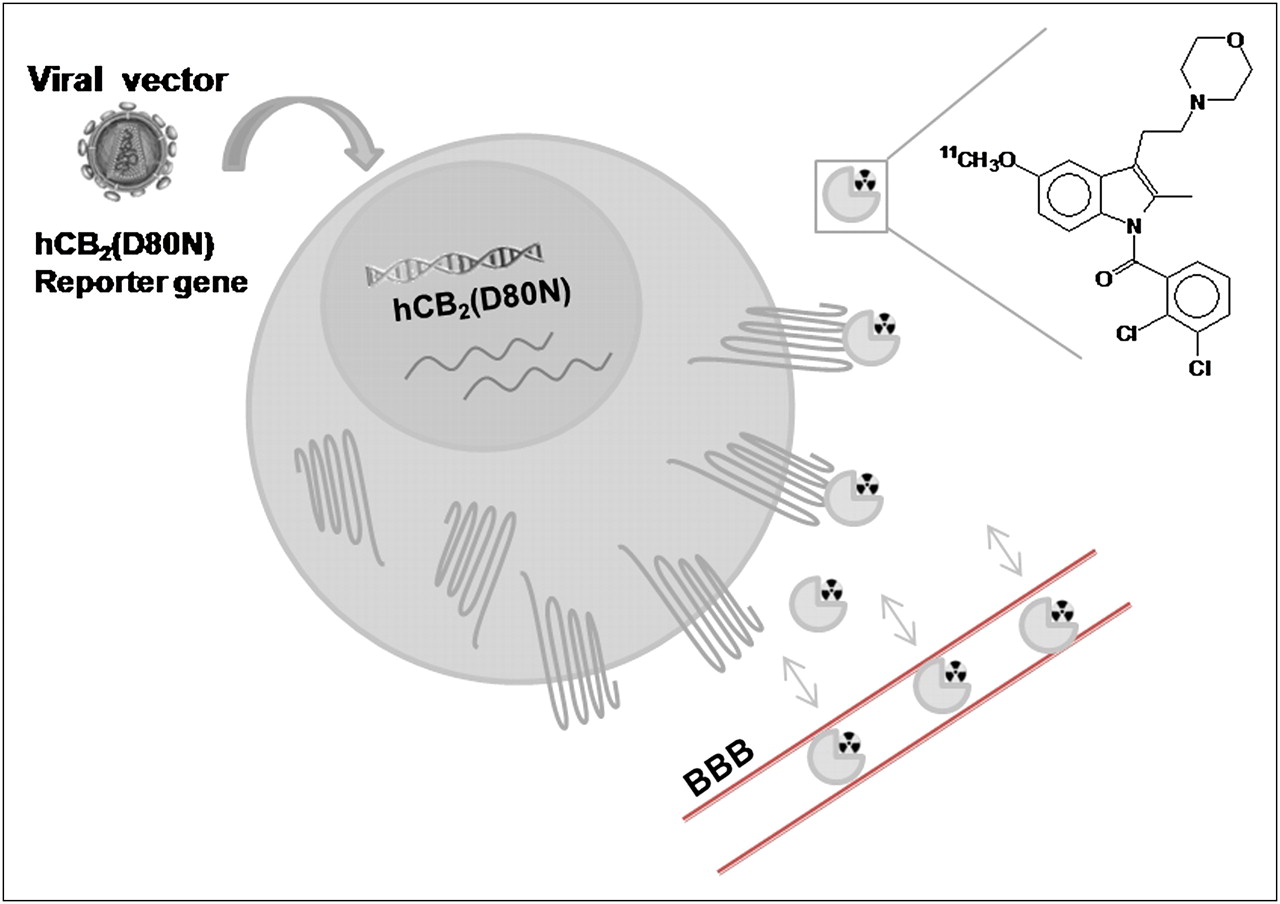
Currently, several CB2 PET tracers for human imaging are under development but none has been used in humans yet (14,15). GW405833 (L-768,242) is a CB2-selective partial agonist (16), known to cross the BBB (17). In this study, we engineered a novel PET reporter system based on either a lentiviral or an adeno-associated viral (AAV) vector expressing hCB2(D80N) as a reporter gene (Fig. 1). We evaluated 11C-GW405833 as a PET tracer for CB2 in several species and validated the new hCB2(D80N)-based reporter system both in vitro and in vivo.

Schematic representation of CB2 reporter gene imaging with reporter probe 11C-GW405833. Cells are transduced with viral vector encoding hCB2(D80N) as reporter gene. hCB2(D80N) is transcribed to hCB2(D80N) messenger RNA and then translated to hCB2(D80N). After administration of CB2-specific radioligand, 11C-GW405833, which crosses BBB, the probe binds to hCB2(D80N). Magnitude of accumulation of 11C-GW405833 reflects level of hCB2(D80N) gene expression.
MATERIALS AND METHODS
The methodology used for the chemical synthesis and radiosynthesis of the radioligand; the measurement of the distribution coefficient; the biodistribution studies; the viral vector construction and production; cell culture and transduction; Western blot analysis; stereotactic injections; bioluminescence imaging; and immunofluorescence and immunohistochemistry have been described in the supplemental data (available online only at http://jnm.snmjournals.org).
Biodistribution Studies in Mouse and Rat
Studies were performed in accordance with the current institutional regulations for use and care of laboratory animals provided by the University of Leuven (P03103, P067/2009) and approved by the local ethical committee for animal experiments of K.U. Leuven.
Plasma and Brain Metabolites in Mouse
Radiometabolites were quantified in the plasma and brains of male NMRI mice according to previously described methods (18). Plasma was analyzed on an Oasis hydrophilic–lipophilic balanced column (4.6 × 20 mm; Waters) connected to an analytic XTerra RP18 column (5 μm, 4.6 × 250 mm; Waters) eluted using 0.05 M ammonium acetate, pH 6.9/acetonitrile (30/70 v/v, 1 mL/min). Brain samples were analyzed on a high-performance liquid chromatography system comprising an XTerra RP18 column (5 μm, 4.6 × 250 mm; Waters) and ammonium acetate buffer, 0.05 M, pH 6.9/acetonitrile 40/60 (v/v) as a mobile phase (1 mL/min).
PET Study in Rhesus Monkey
A juvenile male rhesus monkey (Macaca mulatta, 5.0 kg) was sedated with ketamine (Ketalar; Pfizer) and medetomidine hydrochloride (Domitor; Pfizer). The monkey was injected with 122 MBq of 11C-GW405855 via the vena saphena. PET was performed using a Focus 220 tomograph (Siemens/Concorde Microsystems), which has a nominal transaxial resolution of 1.35 mm in full width at half maximum. Dynamic small-animal PET images were acquired for 90 min and were reconstructed using filtered backprojection with a RAMP filter. Data were analyzed using PMOD software (version 2.7; PMOD Technologies); volumes of interest were defined on the summed images and time–activity curves were drawn. Anatomic MR images were acquired on a Siemens 3-T scanner at a resolution of 0.6 mm isotropic.
Competition Binding Assay and 35S-GTPγS Assay
The competition binding assay and 35S-GTPγS assay were done according to previously described methods (19).
Immunocytochemistry
After fixation, SHSY5Y cells were incubated with a blocking buffer containing 10% horse serum for 20 min, followed by a 90-min incubation with primary antibody against CB2 (rabbit, 1:400; Cayman Chemical). After being washed 3 times with phosphate-buffered saline for 5 min, the plates were incubated for 1 h with secondary antibody (donkey–antirabbit, CY3 543 nm, 1:400; Jackson ImmunoResearch Laboratories, Inc.). Thereafter, the glass plates were mounted on a cover glass, and the expression of hCB2(D80N) was analyzed by fluorescence microscopy (Leica DMR).
PET of hCB2(D80N) Expression
Images of CB2 binding in the brain were obtained using the radioligand 11C-GW405833. Before PET, rats were anesthetized using 3% isoflurane in 2.0 L of oxygen per minute. The tail vein was catheterized to enable the infusion of 11C-GW405833. 11C-GW405833 was diluted with saline to obtain a solution with a maximum of 10% ethanol and injected in a total volume of approximately 500 μL. A dynamic acquisition (60 min) was started immediately after intravenous injection of approximately 37 MBq of the tracer. For the 1 wk scan of the rats injected with lentiviral-hCB2(D80N), a 20-min scan was obtained 10 min after injection of the tracer.
Specific binding to CB2 was confirmed by a chase study 41 d after stereotactic injection of 5 μL of AAV-eGFP-T2A-hCB2(D80N) (5E+08 genome copies [GC]) in the right striatum and 5 μL of AAV-eGFP-T2A-fLuc (5E+09 GC) in the left striatum of a rat. A dynamic acquisition (90 min) was started immediately after intravenous injection of approximately 37 MBq of 11C-GW405833. Twenty minutes after tracer injection, the animal was treated intravenously with a solution of nonradioactive GW405833 (5 mg/kg, solution in 10% dimethyl sulfoxide and 2% polysorbate80 in water for injection), thereby confirming specific binding of 11C-GW405833.
Scans were reconstructed via filtered backprojection. Small-animal PET images were spatially normalized to a stereotactic space and analyzed using a predefined volume-of-interest approach. The procedure of spatial normalization and its validation have been described previously (20). For the analysis of lentiviral-hCB2(D80N), volumes of interest were defined manually and the binding potential was derived from a Logan graphical method using the cerebellum as a reference region.
RESULTS
Radiosynthesis and In Vitro and In Vivo Validation of GW405833 and 11C-GW405833
Radiosynthesis.
Synthesis of GW405833 was based on literature methods (17). A precursor for 11C labeling (1) was obtained in moderate yield (62%) by demethylation using BBr3. Radiosynthesis of 11C-GW405833 was performed by bubbling 11C-methyl iodide or 11C-methyl triflate through a solution of 1 in N,N-dimethylformamide in alkaline conditions. Similar alkylation yields were obtained whether 11C-CH3I or 11C-methyl triflate was used (33% ± 17% [n = 10] or 29% ± 7% [n = 28], respectively) (Supplemental Fig. 1).
Distribution Coefficient, Polar Surface Area.
The lipophilicity of 11C-GW405833 was determined by partitioning between 1-octanol and 0.025 M phosphate buffer, pH 7.4, and a theoretic polar surface area (tPSA) was calculated (http://www.daylight.com/meetings/emug00/Ertl/tpsa.html). The log D value of 11C-GW405833 was 2.5, and the tPSA was 4.37 nm2 (43.7 Å2).
Biodistribution Studies in Mouse and Rat.
The biodistribution of 11C-GW405833 was similar in rats and mice (Table 1 and Supplemental Table 1). The compound is cleared by the hepatobiliary system, but intestinal excretion is faster in mice than in rats (49.6% and 6% of injected dose in intestines at 60 min after injection in mice and rats, respectively). Brain uptake was high (mean standard uptake value [SUVmean], 1.4 and 1.8 at 2 min after injection for mice and rats, respectively). Several well-perfused organs showed high initial tracer uptake. Initial uptake in kidneys was high, but no excretion in urine was observed. Except for the liver, which has a role in excretion, no major organ retained the tracer. Blood values remained persistently high.
Biodistribution of 11C-GW405833 in Wistar Rats
Plasma and Brain Radiometabolite Analysis in Mouse.
Plasma analysis after intravenous injection showed fast metabolism of the tracer, with only 15% of intact tracer left at 30 min after injection (Supplemental Fig. 2). Only more polar metabolites relative to 11C-GW405833 were observed. In the brain, more than 90% of the activity found at 10 min after injection was due to the presence of intact tracer.
PET in Rhesus Monkey.
A relatively high initial brain uptake of 11C-GW405833 was found in a monkey small-animal PET study (SUVmean, 2.0 at 2 min after injection in frontal cortex) (Supplemental Fig. 3). Uptake in brain regions other than the frontal cortex was slightly lower (SUVmean, 1.5 at 2 min after injection) in the thalamus, pons, and cerebellum and about half as much (SUVmean, 1.0 at 2 min after injection) in the white matter. Washout from white matter was slower than from other brain regions.
In Vitro Studies.
Nonradioactive GW405833 was evaluated for its CB1 and CB2 affinity in a competition binding assay using human CB1 (hCB1) or hCB2 expressing Chinese hamster ovary cells. The affinity (Ki value) of GW405833 was 6 μM and 35 nM for hCB1 and hCB2, respectively. A 35S-GTPγS assay was performed for evaluation of the compounds’ potency and efficacy in signal transduction. GW405833 behaved as an inverse agonist (half maximal effective concentration [EC50], 23 nM) (Supplemental Fig. 4).
Lentiviral Vector–Mediated Overexpression of hCB2(D80N) in Cell Culture
After validation of the CB2 PET tracer 11C-GW405833 for applications in the intact brain, we decided to design a new PET reporter system for monitoring gene expression in the central nervous system (Fig. 1). Apart from requiring a suitable tracer, a PET reporter system requires a reporter and a gene transfer vehicle. To stably overexpress hCB2(D80N) in nondividing neuronal cells, lentiviral or AAV vectors could be used.
First, a monocistronic lentiviral construct encoding hCB2(D80N) under control of the ubiquitous human cytomegalovirus immediate-early (hCMVie) promoter was constructed (lentiviral-hCB2(D80N)). In parallel, bicistronic lentiviral constructs expressing hCB2(D80N) with either eGFP (lentiviral-hCB2(D80N)-IRES-eGFP) or the hygromycin resistance protein, hygromycin B phosphotransferase (lentiviral-hCB2(D80N)-IRES-Hygro), linked in both cases with an IRES (internal ribosomal entry site) element were engineered (Fig. 2).

Viral vector–mediated overexpression of hCB2(D80N) in cell culture. In lentiviral constructs, reporter genes are driven by hCMVie promoter and followed by woodchuck hepatitis posttranscriptional element (WPRE). Promoter is preceded by central polypurine tract (cPPT), and lentiviral cassette is flanked by 5′ long terminal repeat (LTR) and 3′ self-inactivating (SIN) LTR. (A–C) Monocistronic construct expressing hCB2(D80N) (A), hCB2(D80N) linked to eGFP by IRES sequence (B), or hCB2(D80N) linked to hygromycin B phosphotransferase (C). AAV 2/7 constructs are driven by hCMVie promoter, and AAV cassette is flanked by inverted terminal repeats (ITR). (D and E) Bicistronic construct encoding eGFP or fLuc and hCB2(D80N), linked by self-cleaving T2A 2A sequence. CMV = cytomegalovirus.
Human embryonic kidney-293T cells were transduced with serial dilutions of lentiviral-hCB2(D80N), and expression was verified by Western blotting (Supplemental Fig. 5A). We observed 3 distinct bands of 41, 45, and greater than 200 kDa, corresponding to the nonglycosylated CB2, glycosylated CB2, and CB2 aggregates, respectively. These aggregates are a result of heating before sodium dodecyl sulfate polyacrylamide gel electrophoresis, as detailed in a previous study (21). In the absence of heating, protein aggregation was significantly reduced (Supplemental Fig. 5B). CB2 expression correlated with vector dilution (Supplemental Fig. 5A).
The expression of hCB2(D80N) was also evaluated by immunocytochemistry in SHSY5Y (human dopaminergic neuroblastoma) cells, to allow subcellular hCB2(D80N) localization (Supplemental Fig. 5). CB2 expression was detected in the cells that were transduced with either lentiviral-hCB2(D80N) (Supplemental Figs. 5E and 5F), lentiviral-hCB2(D80N)-IRES-eGFP (Supplemental Figs. 5G and 5H), or lentiviral-hCB2(D80N)-IRES-Hygro (Supplemental Figs. 5I and 5J). No CB2 expression was seen in control SHSY5Y cells that were transduced with lentiviral-IRES-eGFP (Supplemental Fig. 5C and 5D). Supplemental Figure 6 shows expression of both CB2 and eGFP in a SHSY5Y cell cotransfected with both hCB2(D80N) and eGFP.
In Vivo Validation of hCB2(D80N) Reporter System
To validate the hCB2(D80N) reporter system in vivo, 7 Wistar rats were stereotactically injected with 5 μL of lentiviral-hCB2(D80N) (1.56E+06 pg p24/mL) in the right striatum (RS), and 5 μL of lentiviral-eGFP (similar concentration) was injected in the left striatum (LS). Animals were scanned after 11C-GW405833 injection 1 wk later. One of the animals showed an increased tracer uptake in the RS, compared with the contralateral hemisphere (51 ± 2 kBq/cm3 in RS, >42 ± 1 kBq/cm3 in LS) (Supplemental Figs. 7A–7C), which was confirmed by a dynamic scan 3 d later (data not shown) and the detection of hCB2(D80N) overexpression in the RS by immunohistochemical analysis (Supplemental Fig. 7D). The other animals showed no differences in tracer uptake between the 2 hemispheres on small-animal PET images. Immunohistochemistry revealed overexpression of eGFP in the LS but low expression of hCB2(D80N) in the RS. Although the lentiviral-hCB2(D80N) constructs were adequate for in vitro validation of cell labeling, they failed to induce sufficient hCB2(D80N) expression to be detected by PET in all animals. Because AAV vectors can induce higher transgene expression levels in the brain mainly because of their higher titers, we designed AAV vectors encoding hCB2(D80N) (Fig. 2).
Construction of AAV Vectors Encoding hCB2(D80N)
Two AAV vectors (AAV2/7) containing hCB2(D80N) were generated. Bicistronic AAV constructs encoding hCB2(D80N) with either eGFP or fLuc were made (Fig. 2), driven by the hCMVie promoter. The open reading frames of each protein were separated by a viral self-cleaving 2A-like peptide sequence, namely T2A of the Thosea asigna insect virus, which allows equimolar expression of both proteins (2,22).
To evaluate the transduction efficiency of the AAV vectors, a Wistar rat was injected stereotactically with 5 μL of AAV-eGFP-T2A-hCB2(D80N) (E+11 GC/mL) in the RS and 5 μL of AAV-eGFP-T2A-fLuc (E+12 GC/mL) in the contralateral striatum. The animal was sacrificed 1 wk later and brain CB2, eGFP, and CD68 (activated microglia or macrophages) were detected in brain sections using immunohistochemistry (Fig. 3A–3D). CB2 and eGFP were coexpressed in the right hemisphere (Fig. 3D). No overlay was seen between the CB2+ and CD68+ cells.

Small-animal PET of AAV-mediated hCB2(D80N) reporter gene expression in rat brain. (A–D) Triple fluorescent immunohistochemistry of RS of Wistar rat 1 wk after stereotactic injection of 5E+08 GC AAV-eGFP-T2A-hCB2(D80N). Control vector AAV-eGFP-T2A-fLuc (5E+09 GC) was injected in contralateral hemisphere. (A–C) Staining for eGFP (fluorescein isothiocyanate) (A), CD68+-activated microglia and macrophages (Alexa 555 nm) (B), CB2 (647 nm) (C), and overlay image (D). Colocalization of both eGFP and CB2 was observed in RS. (E) Summed small-animal PET image of 30–60 min after injection of 11C-GW405833 at 18 d after stereotactic injection of 5 μL of AAV-eGFP-T2A-hCB2(D80N) (5E+08 GC) in RS and 5 μL of AAV-eGFP-T2A-fLuc (5E+09 GC) in the LS in rat. (F) Summed small-animal PET image of 30–90 min after injection of 11C-GW405833 at 41 d after surgery, whereby nonradioactive GW405833 (5 mg/kg, arrow) was administered 20 min after tracer injection. As a result, no significant 11C-GW405833 tracer binding was detected. (G) Corresponding time–activity curves of 11C-GW405833 at 18 and 41 d after surgery in same animal. After administration of nonradioactive GW405833 (5 mg/kg, arrow), activity in RS dropped to activity level in LS, indicating competition of tracer binding and confirming specific binding of 11C-GW405833. Scale bar = 20 μm. Max = maximum; min = minimum.
To assess long-term in vivo small-animal PET, 2 rats were injected under the same conditions and scanned 6, 13, 18, and 96 d after surgery. Immunohistochemistry was performed on 1 animal after scanning on day 18. Small-animal PET images were analyzed and binding potential calculated (Fig. 4C). The time–activity curve of 11C-GW405833 in 1 rat 18 d after stereotactic injection is shown in Figure 3G. Average uptake in the RS (AAV-eGFP-T2A-hCB2(D80N)) was 1.8 times higher than uptake in the LS (AAV-eGFP-T2A-fLuc), also demonstrated in a summed image of 30–60 min after injection (Fig. 3E).

Bimodal BLI/small-animal PET of AAV-transduced brain cells. BLI and small-animal PET of rats stereotactically injected with 5 μL of AAV-fLuc-T2A-hCB2(D80N) (5E+08 GC) in RS. (A) Representative photon flux 58 d after stereotactic surgery. (B) Binding potential image of representative animal 73 d after surgery. (C) Follow-up over time of binding potential of 11C-GW405833 at 14, 73, and 252 d after surgery or photon flux at 16, 58, and 281 d after surgery. BLI signal at 281 d corresponds to average of 1,952 CB2+ cells detected by immunohistochemistry (range, 727–3,067). avg = average; BP = binding potential; max = maximum; min = minimum.
After in vivo validation of the hCB2(D80N) AAV–based reporter gene system, specific binding of 11C-GW405833 was confirmed by a chase study 41 d after vector injection. Nonradioactive GW405833 (5 mg/kg) was administered approximately 20 min after tracer injection (Fig. 3G). The activity level in the RS dropped to the level in the contralateral hemisphere, demonstrating competition-induced tracer dissociation (Figs. 3F and 3G). Afterward, the animal was sacrificed, and immunohistochemistry confirmed coexpression of CB2 and eGFP in the right hemisphere (data not shown).
Next, AAV-fLuc-T2A-hCB2(D80N) was produced to allow dual-mode imaging (Fig. 2). Rats were injected with 5 μL of AAV-fLuc-T2A-hCB2(D80N) (E+11 GC/mL) in the RS and followed over time with bioluminescence imaging (BLI) (n = 3) and 11C-GW405833 small-animal PET (n = 5). BLI scans were obtained at 16, 58, and 281 d and small-animal PET scans at 14, 73, and 252 d after surgery. Figure 4A shows the photon flux of a rat injected with luciferin at 58 d after stereotactic injection of the vector. Figure 4B shows a representative slice of a binding potential image at 73 d after surgery of an animal. Both hCB2(D80N) expression and fLuc activity are detected in the RS.
Figure 4C shows the follow-up by 11C-GW405833 small-animal PET and BLI until 252 and 281 d after surgery, respectively. PET binding potential and BLI photon flux followed a similar course. The observed signal initially increased over time and reached a maximum in the RS between 18 and 58 d after vector injection in the brain. Afterward, the animals were perfused, and immunohistochemical analysis for CB2 was performed (mean CB2+ cells in the right hemisphere, 1,952 [range, 727–3,067]).
DISCUSSION
Reporter genes are essential in the evaluation and follow-up of gene therapy applications. Nonimaging markers such as β-galactosidase and eGFP can be detected on immunohistochemical staining but require tissue sampling by way of biopsy or necroscopy (3). Secreted transgenes such as secreted placental alkaline phosphatase or factor IX can be measured over time by body fluid sampling but fail to provide details about localization of gene expression (23). Noninvasive imaging can facilitate monitoring of gene expression over time, thereby reducing cohort size and inherent measurement variability. The radiotracer approach has sufficient sensitivity to quantitatively measure gene expression in vivo and is translationally applicable for use in humans (24,25). The aim of this study was to develop a new PET reporter gene system and validate it for brain applications (26). As shown in this study, hCB2(D80N) fulfils many of the criteria of an ideal reporter gene system (7), especially specificity for hCB2(D80N) and rapid crossing of the intact BBB.
In view of the high lipophilicity of 11C-GW405833, predominant hepatobiliary excretion can be expected. In rats, the gastrointestinal tract showed some initial activity, which decreased as a function of time while activity in the liver gradually increased. This gradual increase might be explained by enterohepatic circulation with intestinal resorption of excreted 11C-GW405833 or its metabolites and subsequent accumulation in the liver. Enterohepatic circulation also explains the stable blood concentration between 10 and 30 min after injection observed in both mice and rats (Table 1 and Supplemental Table 1). Binding to CB2-expressing leukocytes is less likely responsible for slow blood clearance, because we did not observe CB2 binding in the spleen.
11C-GW405833 showed rapid metabolism, with only 15% intact tracer left in plasma at 30 min after injection in mice. Despite the stable plasma activity concentrations, a fast clearance of the fraction of intact tracer was observed as shown by the rapid metabolism. Ideally, radiometabolites should be absent in the brain to allow accurate quantification of receptor binding with PET. At 10 min after injection, only 10% of the observed brain activity was present as radiometabolites.
Successful PET ligands for the central nervous system have generally high affinity for their receptor and are moderately lipophilic, as high nonspecific binding and low brain penetration are usually observed with very lipophilic compounds. The favorable characteristics for BBB passage (low molecular weight, 1 < log D < 3, PSA < 9 nm2 [90 Å2]) of 11C-GW405833 are confirmed by the biodistribution data showing high brain uptake of 11C-GW405833 (Table 1), also confirming the results from Valenzano et al., who described high brain uptake of GW405833 in rats (17). The small-animal PET study in the primate model confirmed the high brain uptake of 11C-GW405833, but the brain washout was slower than observed in rats.
Unlike CB1, there is low endogenous expression of CB2 in the healthy mammalian brain, although CB2 can be upregulated in inflammatory conditions (27). To quantify possible confounding signal due to procedure-induced inflammation, control vector injections were performed in the contralateral hemisphere. The spleen has the highest population of CB2, and therefore tracer accumulation in the spleen or a slower washout from spleen was anticipated. However, we did not observe specific binding in the spleen for 11C-GW405833. Possibly, the affinity of the tracer is insufficient to visualize the limited endogenous receptor expression. A maximal binding capacity (Bmax) value of 0.71 pmol/mg for rat spleen and 0.31 pmol/mg for mouse spleen has been described using the nonspecific agonist 3H-CP55,940 (28). As a general rule, to be able to visualize a receptor, the affinity value (Kd) should be 5–10 times smaller than the Bmax (Bmax/Kd > 5–10). Thus, to be able to visualize endogenous CB2 in the spleen, a radioligand with subnanomolar affinity (0.03–0.1 nM) would be required. Background signal could be a possible problem on translation of this reporter system to a primate or human context. When tested in the primate model, also in areas with known discrete CB2 expression, such as the pons and cerebellum, the probe showed no measurable background signal. The question remains to what extent upregulation of the CB2 receptor in activated microglia during acute or chronic inflammation increases background signal and thus potentially would interfere with this reporter system.
GW405833 was described by Valenzano et al. as a partial agonist on CB2 with high affinity for hCB2 (Ki hCB2R = 3.9 nM) (17). In our assay, GW405833 shows a 10-fold lower affinity for hCB2 and behaved as an inverse agonist in our GTPγS assay. Our results are in accordance with those of Yao et al., who reported that GW405833 is a potent inverse agonist in both hCB2 (EC50, 44.4 nM) and rCB2 (EC50, 3.3 nM) (29). Recently, Mancini et al. defined GW405833 as a protean agonist (30). We report a 200-fold selectivity versus hCB1 which is lower than the selectivity reported by Valenzano et al. (1,200-fold), but higher than that reported by Yao et al. (37-fold) and comparable to that observed by Gallant et al. (160-fold) (16, 29,30).
Similar to an existing dopamine receptor (D2R) gene reporter system, for which the reporter probes (e.g., 18F-3-(2′-18F-fluoroethyl)-spiperone) are able to cross the BBB (31) but suffer from high background signal in D2R-rich brain regions, a mutation has been applied in a highly preserved aspartic acid residue in the second transmembrane domain of hCB2(D80N), providing a disconnection of ligand binding from signal transduction (13,32). In consequence, endo- or exogenous ligands have little or no effect on the signal transduction pathway that is activated after normal endogenous CB2 binding. Binding itself is probably not hampered, because experimental and computational modeling studies indicate that interactions with residues of helices 3–7 account for most of the known ligand–CB2 interactions (33).
When using viral vectors, an important asset is the size of the reporter gene. With a size of about 1 kb, hCB2(D80N) fits in both lentiviral and AAV vector transfer plasmids, allowing coexpression with other imaging reporter genes such as fLuc and eGFP or even with (future) therapeutic genes (22). In theory, the hCB2(D80N) lentiviral constructs can be used for stem cell tracking in the brain or other stem cell applications, although the sensitivity of the system still needs to be determined. hCB2(D80N)-expressing AAV constructs were added to our platform of CB2 constructs to ensure high in vivo transduction efficiency after injection in the brain. Interestingly, we detected a decrease in AAV-mediated transgene expression in both imaging modalities over a period of about 9 mo, possibly due to promoter silencing, loss of epigenetic vector genomes, or an immune response. Nevertheless, this modest decrease does not significantly hamper the potential use of long-term gene reporter monitoring with this system.
CONCLUSION
A new PET reporter gene system was developed showing good BBB penetration and reversible and specific CB2 binding in vivo. Imaging of CB2 expression depends on several factors, such as the level of CB2 expression in the transduced tissue and the affinity, selectivity of the CB2 radioligand, and system sensitivity. Application of the system for gene expression has been further investigated in preclinical models and in alternative applications such as stem cell tracking.
DISCLOSURE STATEMENT
The costs of publication of this article were defrayed in part by the payment of page charges. Therefore, and solely to indicate this fact, this article is hereby marked “advertisement” in accordance with 18 USC section 1734.
Acknowledgments
We thank Peter Vermaelen and Ann Van Santvoort for their skillful help with the small-animal PET scans and Evy Lobbestael for her help with confocal microscopy. We are also grateful to Veerle Reumers and Sylvie De Swaef for their help with the histologic analysis. We gratefully acknowledge the staff of radiopharmacy of UZ Leuven for their help with the radiopharmaceutical preparations. This study is supported by the European Commission for EC-FP6-STREP-STROKEMAP, BRAINSTIM SBO-IWT-060838, DIMI LSHB-CT-2005-512146, and the K.U. Leuven Center of Excellence “MoSAIC.” No other potential conflict of interest relevant to this article was reported.
Footnotes
↵* Contributed equally to this work.
- © 2011 by Society of Nuclear Medicine
REFERENCES
- Received for publication October 25, 2010.
- Accepted for publication March 16, 2011.


Jump to section
Related Articles
Cited By...
- Longitudinal assessment of DREADD expression and efficacy in the monkey brain
- Genetically targeted reporter imaging of deep neuronal network in the mammalian brain
- Positron emission tomography reporter gene strategy for use in the central nervous system
- Multimodal Imaging for DREADD-Expressing Neurons in Living Brain and Their Application to Implantation of iPSC-Derived Neural Progenitors