


Abstract
Clinical differential diagnosis in parkinsonism can be difficult especially at early stages. We investigated whether combined perfusion and dopamine transporter (DAT) imaging can aid in the differential diagnosis of parkinsonian disorders: idiopathic Parkinson's disease (IPD), progressive supranuclear palsy (PSP), multiple system atrophy (MSA), dementia with Lewy bodies (LBD), and essential tremor (ET). Methods: One hundred twenty-nine patients were studied, retrospectively (69 males; 24 MSA, 12 PSP, 8 LBD, 27 ET, and 58 IPD; mean disease duration, 3.5 ± 3.7 y). Diagnosis was based on established clinical criteria after follow-up of 5.5 ± 3.8 y in a university specialist movement disorders clinic. Group characterization was done using a categoric voxel-based design and, second, a predefined volume-of-interest approach along Brodmann areas (BA) and subcortical structures, including striatal asymmetry and anteroposterior indices. Stepwise forward discriminant analysis was performed with cross-validation (CV) using the leave-one-out technique. Results: Characteristic patterns for perfusion and DAT were found for all pathologies. In the parkinson-plus group, MSA, PSP, and LBD could be discriminated in 100% (+CV) of the cases. When including IPD, discrimination accuracy was 82.4% (99% without CV). 2β-Carbomethoxy-3β-(4-iodophenyl)nortropane imaging as a single technique was able to discriminate between ET and neurodegenerative forms with an accuracy of 93.0% (+CV); inclusion of perfusion information augmented this slightly to 97.4% (+CV). Conclusion: Dual-tracer DAT and perfusion SPECT in combination with discrimination analysis allows an automated, accurate differentiation between the most common forms of parkinsonism in a clinically relevant setting.
Although idiopathic Parkinson's disease (IPD) is the most prevalent neurodegenerative form of parkinsonism, at early disease stages it may be clinically difficult to differentiate from other forms of parkinsonism that share, at least in part, symptoms such as tremor, bradykinesia, rigidity, gait disturbance, speech or swallowing difficulties, and autonomic dysfunction (1). The most prevalent differential diagnoses with neurodegenerative cause are multiple system atrophy (MSA), progressive supranuclear palsy (PSP), and Lewy body dementia (LBD). Specific clinical signs such as autonomic and cerebellar symptoms in MSA, gaze palsy, and axial rigidity in PSP and overt dementia and visual hallucinations in LBD may only manifest at a later stage. When monosymptomatic tremor is present, the differential diagnosis with essential tremor is also of relevance (2). Depending on the clinical setting, it is likely that at least 10% and up to 25% of patients who are initially diagnosed as having IPD actually have another disorder when reviewed pathologically (3,4).
The current status of functional imaging in the differential diagnosis of IPD has been described in recent review publications (5,6). For evaluating nigrostriatal dopaminergic integrity, multiple SPECT or PET biomarker ligands have been developed, such as 123I-N-ω-fluoropropyl-2β-carboxymethoxy-3β-(4-iodophenyl)nortropane) (123I-FP-CIT) for the dopamine transporter (DAT) or 18F-fluoro-DOPA (FDOPA) for dopa decarboxylase activity, that allow differentiation between normality and neurodegenerative causes (IPD + atypical forms) using presynaptic imaging with a sensitivity of 83%–97% (7,8). Because of the pathologic difference in the degree of caudate nucleus involvement and a highly conserved pathologic change across the nigra in IPD, patterns of symmetry and caudate-to-putamen ratios can provide some differentiation on a group basis (9,10), but presynaptic dopaminergic imaging alone does not allow accurate differentiation between IPD and atypical parkinsonian syndromes (11,12).
A difference in striatal pathology as shown by postmortem investigation between IPD and atypical parkinsonism is the loss of striatal D2 receptors (10). Although one study in 8 MSA patients revealed high accuracy to discriminate IPD from MSA using 11C-raclopride PET (13), decreased binding is seen in both PSP and MSA (10), D2 binding is also reduced in patients taking dopaminergic drugs (14), and false-negative findings have been described (15).
Indirect (perfusion or metabolism) imaging has been used to distinguish these disorders from each other in vivo, but in most studies using 2 groups of specific disease entities have been compared (16–18). Recently, FDG PET as a single technique in conjunction with pattern recognition on individual SPM maps was described with high concordance with independent 2-y clinical follow-up (19).
An important aspect in many previous studies is that there was no post hoc validation of discriminatory capacity of bioimaging markers in a clinical setting, hereby precluding precise interpretation of their relevance for differential diagnosis in individual new patients.
The aim of this study was to investigate the contribution of dual-tracer SPECT DAT and perfusion imaging in the differential diagnosis between IPD, MSA, PSP, DLB, and ET in a large population as encountered in a tertiary clinical setting, using an operator-independent, automated template-based discriminant analysis method. As operational gold standard, diagnosis after clinical follow-up was taken.
MATERIALS AND METHODS
Subjects
In total, 129 patients were studied in this cross-sectional, single-center study: 24 MSA, 12 PSP, 8 LBD, 27 ET, and 58 IPD patients (69 male; average age, 63.8 ± 12.1 y). Patients were selected from an existing database of internal referrals for combined perfusion and DAT SPECT between 1999 and 2003. Combined perfusion and DAT imaging was requested on a prospective basis in this time period without exceptions to investigate the potential added role of perfusion imaging. The clinical diagnosis of probable IPD, MSA, PSP, LBD, and ET was made according to established criteria (3,20–25) by a single movement disorder specialist.
All Parkinson-plus cases with full clinical data and follow-up information were included, whereas for IPD a subset of cases was taken based on random (alphabetical) selection. The following patients were excluded: those not routinely followed in the center for movement disorders, IPD patients using neuroleptic medication, patients with concomitant other neurologic pathology (vascular incidents, epilepsy, and so forth). A minimum clinical follow-up of 1 y was respected.
Final diagnoses were made by clinical follow-up of 5.5 ± 3.8 y after imaging. At the time of imaging, patients had a mean clinical disease duration of 3.6 ± 3.7 y (range, 0.2–25 y). The mean modified Hoehn and Yahr stage was 2.1 ± 1.2 for the neurodegenerative groups. All studies were approved by the local ethical committee.
Imaging: Data Acquisition and Reconstruction
99mTc-Ethylcysteinate dimer (ECD) (Neurolite; Bristol-Myers-Squibb) was used to measure relative regional brain perfusion. All subjects received 925 MBq (25 mCi) (±5%) of 99mTc-ECD in slow intravenous injection under standardized injection circumstances (supine, low ambient noise, dimly lit room, eyes closed). Data were acquired with the patient in the “on” state; medication schemes were continued before and on the day of the scan. SPECT data acquisition started 30 min after administration of the perfusion tracer.
123I-FP-CIT (DATScan; Amersham Health–GE Healthcare) SPECT was performed within 1 mo of the perfusion study. All subjects received 110–185 MBq (3–5 mCi) of 123I-FP-CIT in slow intravenous injection. Thyroid uptake was blocked before the scan by administration of Lugol solution (20 drops = 100 mg KI). SPECT data acquisition started between 3 and 6 h after administration of the DAT tracer.
All scans were obtained on the same triple-head γ-camera (Triad XLT 20; Trionix Research Laboratory), equipped with parallel-hole, low-energy, high-resolution collimators. In all cases, the head was fixed in a head-holder to minimize motion artifacts. The acquisition parameters included step-and-shoot mode over 30 min for perfusion and 40 min for DAT SPECT. One hundred twenty projection angles were taken over 360° and a 128 × 128 matrix was used.
Reconstruction was done using filtered backprojection by means of the manufacturer's software, with a Butterworth filter (order, 10; cutoff, 0.61 cm−1 for both perfusion and DAT). Uniform Chang attenuation correction was used to compensate for photon attenuation with a mean attenuation coefficient of 0.12 cm−1 for both tracers.
Image Processing and Data Analysis
All data were processed using Statistical Parametric Mapping (SPM2; Wellcome Department of Imaging Neuroscience, London, U.K.). After prior temporary gaussian smoothing with 10-mm full width at half maximum (FWHM, DAT), images were coregistered to their corresponding perfusion images using a rigid transformation in SPM99. Transformation parameters were applied to the original DAT images and both coregistered sets were thus spatially normalized using the perfusion images with nonlinear warping onto the provided SPECT template (25-mm cutoff, 5 iterations). Data were flipped according to the clinical predominant affected side in case of asymmetric disease, to match symptoms on the right hemibody.
A template volume-of-interest (VOI) set was constructed by predefining all relevant subcortical VOIs on a spatially normalized patient MPRAGE (magnetization prepared rapid-acquisition gradient echo) MR image constructed from a set of 10 aged healthy individuals between 50 and 80 y old. Template VOIs were delineated for the whole gray matter based on the atlas of Talairach and Tournoux. Because of remaining anatomic normalization inaccuracies in subcortical nuclei (e.g., the size, shape, and location of the caudate nucleus and putamen due to third ventricle enlargement in some patients) and lack of MR information for the whole group, the predefined subcortical VOIs were visually adjusted based on combined DAT and perfusion information. Unsmoothed spatially normalized images were used as input for the VOI-based discriminant analysis. VOI management was done using the PMOD software VOI tool (PMOD Inc.). In view of the underlying pathophysiologic differences of directional nigrostriatal affection in IPD, the putamen was subdivided into a pre- and postcommisural part. Ninety-two VOIs were constructed this way covering all brain gray matter for perfusion. For DAT, asymmetry ratios and gradients (caudate, anterior and posterior putamen) were taken as input variables.
For perfusion activity normalization, relative uptake values were determined by dividing VOI uptake to the total uptake over the whole of the brain gray matter (overall gray matter VOIs). For DAT SPECT, parametric binding indices (BI = total striatal uptake/occipital nonspecific uptake) were calculated in the caudate and putamen, with occipital activity = sum of Brodmann areas (BA) 17–19. Asymmetry and anteroposterior indices for the striatum were calculated.
SPM
SPM was used to characterize the populations studied in terms of perfusion and DAT binding at the voxel level. Data were smoothed with a FWHM of 12 mm and analyzed in a categoric subject design. Proportional scaling was used to a value of 50, with a relative (gray matter) analysis threshold of 40% for perfusion. For CIT, parametric images were constructed by dividing static images by the occipital gray matter VOIs as the measure for aspecific activity, without global scaling and using an analysis threshold of 20% of the maximum value (corresponding to a mask including cerebellum, pons, and all cerebral gray matter and not restricted to the striatum and brain stem). We explored differences using voxel intensity P value (Pheight) at 0.005 (uncorrected) and cluster extent (kE) > 50, unless otherwise specified. In all SPM analyses, age at the time of SPECT was taken as a covariate.
Discriminant Analysis and General Statistics
All general statistical analyses were performed using SPSS (Statistical Package for the Social Sciences, version 11.0 for Windows; SPSS Inc.). Differences are reported to be significant at the level of P < 0.05. ANOVA and subsequent post hoc Tukey tests were performed to find the most significant regional differences between the 5 disease entities. Then general discriminant modeling was used to perform the discriminant analysis. Stepwise forward analysis was used to identify possible multiple variables for optimal discrimination, with a decision scheme based on the smallest F ratio (maximum significance of F to enter 0.10, maximum significance of F to remove 0.20). The a priori classification probability was set as being equal to ascertain a conservative estimate.
Classification performance was initially tested using the training error—that is, by post hoc classification statistics. To estimate a more unbiased and generalized performance measure for new patient cases, the a priori discriminant value or discriminant cross-validity was tested using a classical leave-one-out procedure (26). In this cross-validation (CV), each case is classified by the functions derived from all cases other than that case. Data presented include CV and are presented as (–CV:..) for the effect of CV values without CV.
RESULTS
Subject Demographics
Subject demographic data are given in Table 1 for all patient groups. There were no significant differences between groups with regard to age (P = 0.11) or sex (P = 0.27). Disease severity as expressed by the modified Hoehn and Yahr score at the time of SPECT was 1.4 ± 0.6 for IPD, whereas it was about 2.9–3.4 for LBD, MSA, and PSP (P < 0.01) due to the more rapid course of atypical parkinsonism. Disease duration was highest for the essential tremor (ET) group (7.0 y), due to the fact that many ET patients were referred for a second opinion after unsuccessful therapy, and lowest (2.2 y) for the IPD group, which can be considered as an early IPD group (19). Disease duration was not significantly different for the neurodegenerative entities. There was a significant difference in the degree of clinical lateralization between IPD and both PSP and MSA (ANOVA, Tukey's post hoc test: P = 0.034 and 0.012, respectively).
Patient Demographic and Clinical Characteristics
Regional Perfusion and DAT Group Characterization
Perfusion.
Figure 1 shows the perfusion difference SPM t-maps compared with IPD of all patient groups (kE = 50; cutoff T statistic = 2.5; Pheight = 0.007). ET patients were characterized by a higher perfusion in the posterior striatum bilaterally, most pronounced on the left side compared with IPD, as well as in the upper parietal cortex bilaterally. No areas with higher relative perfusion were present for IPD compared with ET. MSA patients showed a decrease in perfusion bilaterally in the cerebellar cortex and vermis, as well as in the left and right posterior putamen. The inverse contrast did not show cortical or subcortical differences at the aforementioned thresholds. PSP patients showed multiple areas of significant hypoperfusion most pronounced in the left prefrontal and supplementary motor area (SMA) cortex, left periinsular cortex, left caudate, and bilateral rostral anterior cingulate and medial thalamic and mesencephalon. The inverse contrast showed higher relative perfusion in the occipital and right primary motor cortex than IPD. Finally, patients with LBD showed pronounced cortical hypoperfusion in the posterior temporoparietal area bilaterally, most prominent on the right (ipsilateral) side.
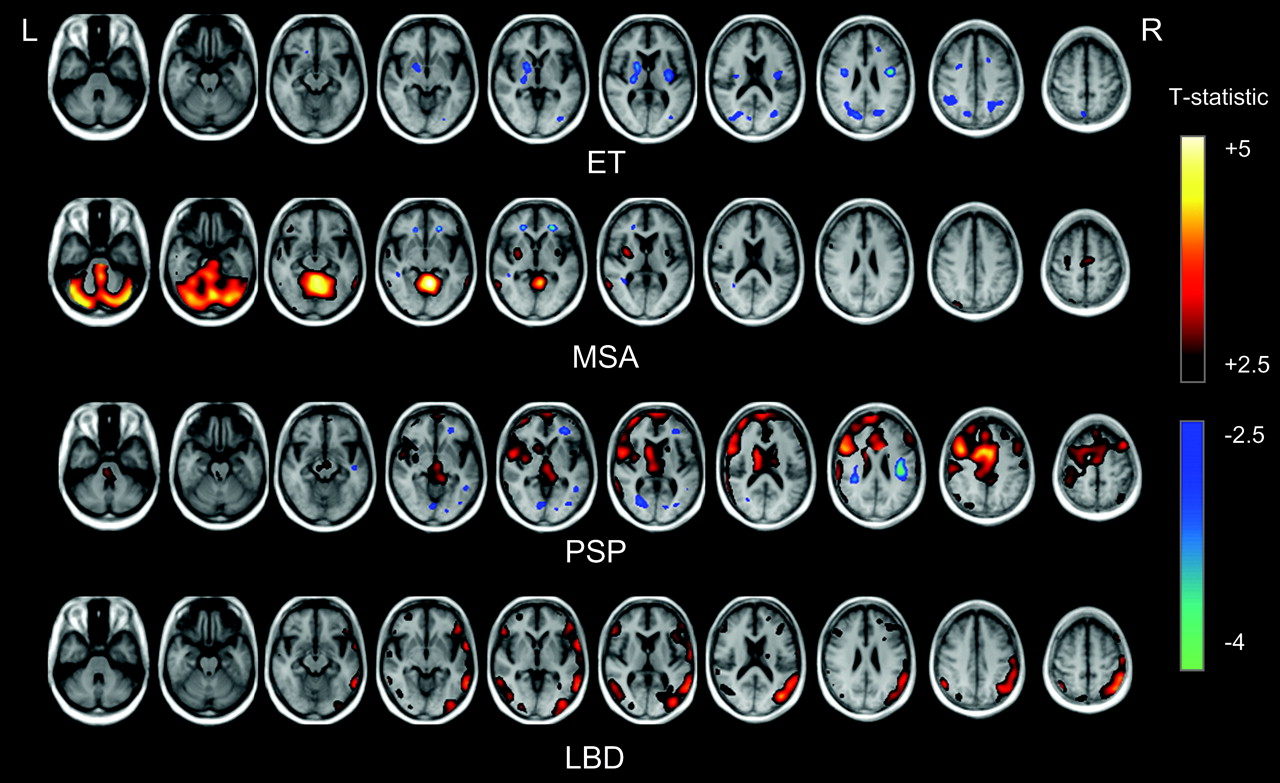
Perfusion SPM t-maps with respect to IPD of atypical parkinsonism and ET. In hot scale reductions in relative 99mTc-ECD uptake are given, in winter colors the increases with respect to IPD (extent threshold kE = 50; cutoff T statistic as indicated; t = 2.5 corresponds to a voxel intensity P value of 0.007).
DAT.
Figure 2 shows the DAT binding index difference t-maps compared with ET of all patient groups (kE = 50; cutoff T statistic = 3.0 corresponding to P = 0.002). IPD patients showed a bilateral decrease in CIT binding index over both striatal volumes, most pronounced on the right side and least present in the left caudate head. MSA, PSP, and LBD patients showed a more symmetric pattern of DAT binding reduction with lower t-values. Note that a lower t-value here does not correspond to lower binding index but is influenced by the larger number of cases in the IPD group.

DAT binding index SPM t-maps with respect to ET. Reductions (T statistic) in uptake are given for an extent threshold kE = 50 (t = 3 corresponds to a voxel intensity P value of 0.001).
When directly comparing IPD and MSA patients, no reduction of MSA versus IPD was noted. We especially investigated the brain stem region, where previous reports have shown differential β-CIT binding capacity between IPD and MSA (27), but could not detect differences even at the least stringent threshold (P = 0.05 uncorrected). The reverse contrast (IPD < MSA) showed a decreased binding in the left posterior putamen.
The PSP group visually showed more involvement of the caudate heads, although, when directly contrasted with IPD only at a P = 0.05 uncorrected level, a difference was found in the left striatum.
Discriminant Analysis
Discriminant analysis was performed sequentially for the whole dataset and also for specific subgroups of clinical interest, as well as for combined and separate perfusion/CIT imaging.
ET Versus Degenerative Disorders.
CIT imaging alone discriminated between the degenerative disorders and ET in 93% of cases (−CV: 93%). Nine cases of neurodegenerative parkinsonism (2 IPD, 2 LBD, 1 PSP, and 4 MSA) were within the normal range with regard to CIT indices. For perfusion, the lowest P values in ANOVA were found from cerebellum, BA9, BA44, anterior-to-posterior putamen ratio, and caudate head-to-putamen ratio (all P < 0.001). Combined CIT and perfusion data resulted in a higher discrimination value of 97.4% (−CV: 98.4%), where only 3 cases were misclassified (1 IPD, 1 MSA, 1 LBD).
Discrimination of Neurodegenerative Disorders MSA, PSP, LBD, and IPD.
The DAT binding index ratio between anterior and posterior putamen on the contralateral (left) side showed the lowest P value (P < 0.001). After Tukey's post hoc correction, this value was significantly different between PSP (0.97 ± 0.29) and both MSA (1.44 ± 0.33) and IPD (1.57 ± 0.34) (P < 0.001), respectively.
Despite of the finding for the putamen DAT gradient, DAT imaging alone was able to discriminate only 58.8% of all considered cases (−CV: 63.7%); nevertheless, 11 of 12 PSP cases were correctly identified. Perfusion imaging as a stand-alone technique allowed separation of 67.6% of cases (−CV: 78.4%). However, the combination of both imaging techniques augmented overall classification accuracy to 82.4% (−CV: 99%), as can be seen in Table 2 and in the canonical discriminant plots in Figure 3.

(A) 2-Dimensional projection plot of discriminant canonical functions for differentiation of neurodegenerative parkinsonism using DAT (123I-FP-CIT) and perfusion imaging (99mTc-ECD). (B) Discriminant canonical functions for differentiation of atypical neurodegenerative parkinsonism using DAT (123I-FP-CIT) and perfusion imaging (99mTc-ECD). Ellipses show minimal extent of contours that cover all plotted group data.
Classification Results for Combined 123I-FP-CIT and 99mTc-ECD Imaging Using Discriminant Analysis in Neurodegenerative Parkinsonism
The regions with the largest coefficients in the canonical discriminant functions were cerebellum and posterior putamen for MSA, dorsolateral and prefrontal cortex (BA 9, 10, 44, 47) and left caudate for PSP; occipital (BA 18, 19), premotor (BA 6) and (right), temporoparietal (BA 21, 22, 39, 40) areas for LBD. For IPD, the caudate-to-putamen DAT binding ratio was most discriminating. Figure 4 shows a box plot comparison for the most discriminating regions to illustrate the quantitative differences between these regional parameters in the disease entities.
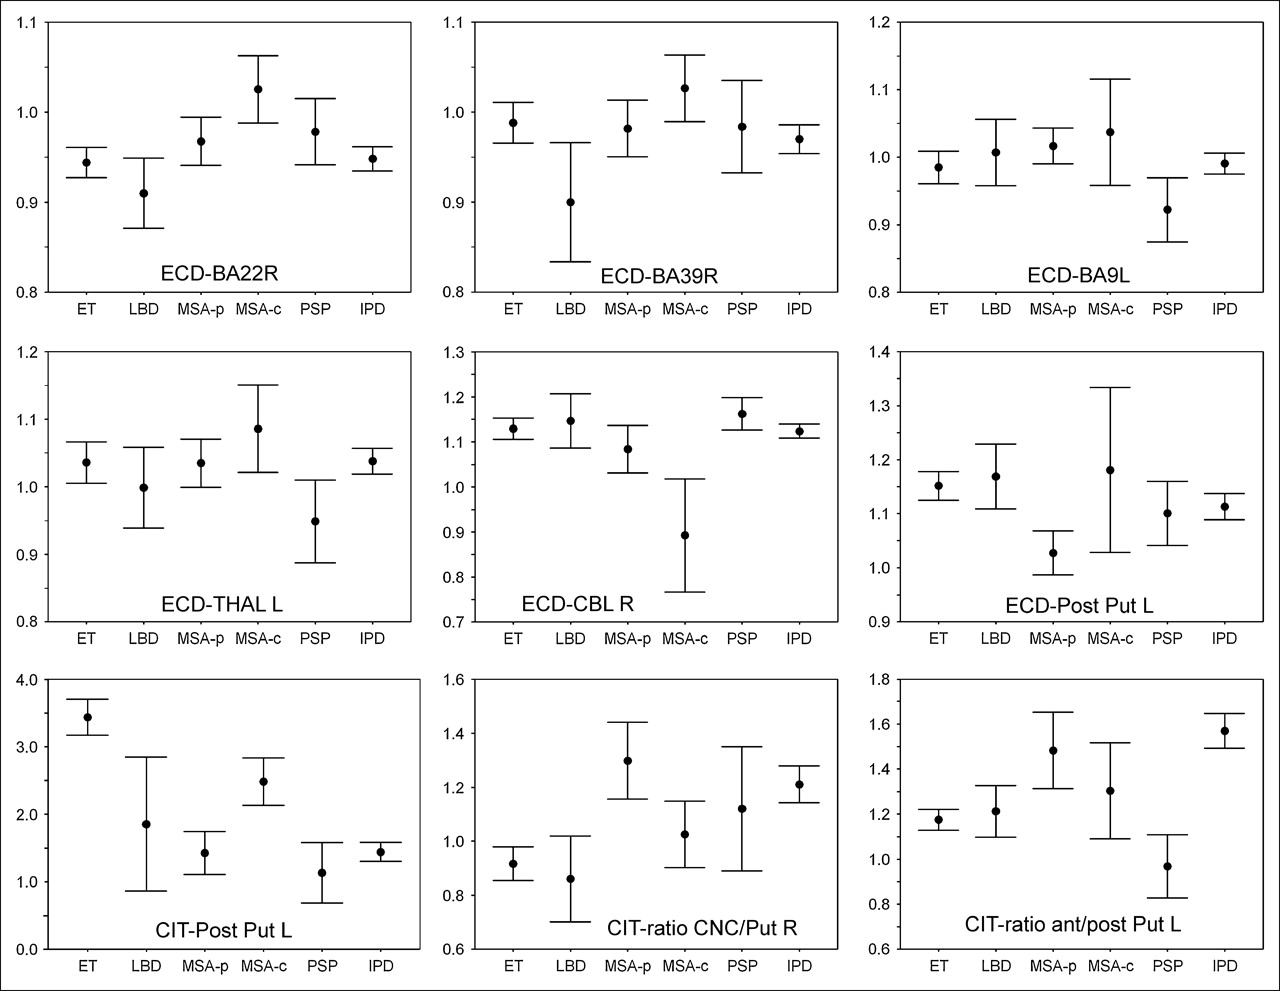
The 95% confidence intervals of most discriminating regions between IPD, MSA, PSP, LBD, and ET for combined perfusion and DAT imaging. Perfusion values are relative to the whole-brain gray matter average; 123I-FP-CIT binding indices are calculated as (uptake/occipital uptake − 1). R = right; L = left; THAL = thalamus; CBL = cerebellum; Post = posterior; Put = putamen; CNC = caudate head; MSA-p = striatal (parkinsonian) variant of MSA; MSA-c = cerebellar variant of MSA.
Separation of Atypical Parkinsonism: MSA, PSP, and LBD.
As in many clinical cases, additional information (e.g., lack of response to dopaminergic medication, additional cognitive deficits) is present, which increases the a priori likelihood of atypical parkinsonism, We also investigated the discriminatory capacity of dual DAT/perfusion imaging in the setting of discrimination between MSA, PSP, and LBD. For the post hoc and the cross-validated measurements, 100% separation was obtained (Fig. 3B; Table 3).
Classification Results for Combined 123I-FP-CIT and 99mTc-ECD Imaging Using Discriminant Analysis in Parkinson-Plus Disorders
DISCUSSION
Objective biomarkers have the possibility of allowing an unbiased evaluation of new patients. Although there is ongoing debate whether radiotracer-based imaging allows the final diagnosis of IPD or parkinsonian syndromes (28), individualized molecular imaging has become a crucial contribution in clinical characterization of movement disorder patients, which is of importance in therapy selection and prognosis (29).
In this work, we have characterized dual-tracer DAT and perfusion patterns that exist in a patient population referred to a tertiary movement disorder clinic, for the majority of patients relatively early in the disease course. The patterns observed for DAT imaging are qualitatively in correspondence with individual studies comparing neurodegenerative parkinsonism and ET. For DAT, a more symmetric involvement in PSP and MSA was found, with predominant caudate head involvement for PSP.
We were unable to demonstrate significant differences in MSA and IPD patients in the brain stem by either the VOI or SPM method, as was found recently by Scherfler et al. (27), or in perfusion, in view of the hypothesis of regional blood–brain barrier disruption (30). This was also not the case when considering only those patients with a predominant parkinsonian form of MSA (MSA-p) based on the clinical evaluation and perfusion pattern. Scherfler et al. used 123I-β-CIT in their work and state the hypothesis that their findings could be related to changes in the serotonin transporter (SERT) rather than DAT. It is known that both 123I-β-CIT and 123I-FP-CIT have important affinity for the SERT and the norepinephrine transporter (NET). However, SERT selectivity (ratio of the inhibition constant Ki for SERT over DAT) of 123I-β-CIT is 0.4, which is 2 times higher than the SERT selectivity of 123I-FP-CIT (31). Therefore, the 123I-FP-CIT images are more weighted by the DAT distribution compared with 123I-β-CIT, and the absence of differences between MSA and IPD using 123I-FP-CIT binding may therefore provide indirect support for the above hypothesis. Similarly, if NET binding was responsible for the observed finding, it would be expected that also 123I-FP-CIT binding should be able to detect these differences, because NET/DAT selectivity is higher compared with 123I-β-CIT (7.6 vs. 2.1, respectively) (31).
In the nigrostriatal form of MSA (MSA-p), striatal hypometabolism or hypoperfusion is able to distinguish IPD from MSA (16,19,32). However, striatal metabolic activity alone is low in both PSP and MSA (18). For IPD, resting state measurements of 18F-FDG have shown that in IPD increased lentiform nucleus and reduced premotor metabolism is found, correlating to motor severity. In this and other studies using perfusion SPECT ligands, however, there tends to be a pattern of relative striatal hypoperfusion in both early and later disease stages (16), a finding that is at odds with early hypermetabolism found in FDG PET studies. This could be related to either tracer-specific properties or perfusion/metabolism uncoupling in the basal ganglia.
The perfusion pattern observed in PSP with both striatal and widespread frontal hypoperfusion is in correspondence with earlier findings of diminished glucose use in the frontal cortex (33). Also, in LBD, the pattern of hypometabolism in posterior parietal and associated temporal areas (34) was the most discriminating finding for this analysis, but it must be pointed out that this may not be specific for cognitive deficit, as such regional hypometabolism has also been observed in some studies in nondemented IPD patients (35). In our study, no patients in the IPD group presented with overt cognitive impairment.
An overall problem with imaging biomarkers in the central nervous system is the lack of a gold standard (28). The standard used in this work was based on years of clinical follow-up of the patients by well-described clinical guidelines. It can be expected that around 10% of cases can be misclassified with respect to pathologic diagnosis (4). However, in the absence of anatomopathologic confirmation, the canonical discriminant functions derived from this work are expected to lead to a diagnostic accuracy that is comparable to a high standard of the specialist long-term evaluation and provide an objective, operator-independent classification in early stage of the disease.
A second important design item and limitation of the study is that some bias may have been introduced in our findings. Although no quantitative information was available to the referring neurologist, he was not strictly unaware of the qualitative results of SPECT. In our opinion, this may have had an impact in a minority of patients in the setting of the differentiation between ET and neurodegenerative causes, where visual interpretation of 123I-FP-CIT has been shown to give a high discriminatory yield. The observed value of 93% is in correspondence with several large phase III trails both for 123I-FP-CIT, resulting in 97% for visual assessment (including late-stage disease) (7), and for 123I-β-CIT (83% with semiquantitative analysis) (8). As for perfusion, however, in the patient work-up these data were not considered in the final clinical diagnosis. Moreover, in view of the relatively small quantitative differences (5%–10%), it is unlikely that visual interpretation alone would have assisted in such classification.
In the interpretation of functional neuroimaging data, multiple factors such as compensatory mechanisms or effects of the medication themselves, which can modify the results, need to be considered (6). We have not included variables such as disease duration and levels of various medication use at present. However, as the primary aim was to investigate the functional imaging data in a clinical setting, where generally medication is discontinued only for a small number of drugs specifically known to interfere with DAT imaging, such a situation may be less informative from a pathophysiologic viewpoint, but more generally relevant for evaluating new patients.
From the methodologic viewpoint, the estimates from this study have been made conservatively. First, apart from incorporation of the side of the main clinical symptoms, the pretest likelihood was not based on the clinical picture and all groups were set as equally probable in the discriminant analysis. When taking this information into account or adjusting the a priori likelihood of, for example, a distribution more related to clinical prevalence, the overall accuracy of this technique may further improve. The sensitivity of the currently applied technique of VOI-based discriminant analysis may also be augmented by using advanced voxel-based techniques such as logistic discriminant mapping, which was already used in the setting of parkinsonism with 99mTc-TRODAT imaging (36), or network analysis techniques such as principal component analysis to evaluate Parkinson's disease-related expression patterns (37) and which may be used for differential diagnostic classification.
Multitracer imaging has been explored previously with smaller numbers of patients and in specific entities (13,18,38). Because of the small number, however, the precise contribution to clinical diagnostic accuracy was difficult to assess. In contrast to most previous studies, care was taken here to provide also cross-validated results as a more unbiased predictor for future novel cases, because it is well known that discriminant analysis without CV can yield overly optimistic discrimination values (39).
Recently, Eckert et al. (19) described a method using a single FDG PET image with automated pattern recognition (single-subject SPM maps) in which they found differential accuracies of >90% for IPD–MSA and PSP with 2-y clinical follow-up as the standard. Advantages of this approach are the higher spatial resolution and single-scan approach; however, a potential disadvantage is that an operator-dependent factor of pattern recognition is still necessary, in contrast to discriminant analysis, which automatically provides classification probabilities for the disease entities.
In many previous region-of-interest− or VOI-based studies no attempt had been made to subdivide the putamen into posterior and anterior parts, owing to the relatively lower resolution of SPECT or earlier PET instrumentation. However, as can be seen from the above analysis, this increases the discriminating power because of the pathophysiologic alterations in the posterior putamen that are especially pronounced in MSA-p and the gradients that exist in the selective nigrostriatal affliction in IPD and PSP.
Although our study is useful for pathophysiologic interpretation, a limitation is that we have not included a healthy volunteer control group, because of the absence of a validated control population for 123I-FP-CIT.
Finally, in contrast to DAT imaging procedures using voxel-based analysis with anatomic standardization, we have used an indirect approach of anatomic standardization of DAT images, which may have offered some advantages. Especially for strongly abnormal DAT SPECT images, the accuracy of anatomic standardization has not been evaluated formally so far. We have shown previously that, especially in the scaling parameters of DAT SPECT images, considerable errors may arise (40). In the current study this potential problem was circumvented by initially applying a rigid transformation to the DAT data to fit the perfusion data, after which an accurate nonlinear transformation could be made. Although no formal phantom study has been performed for 99mTc-ECD/123I-FP-CIT registration, on the basis of these previous data, the remaining presence of a clear cortical signal for 123I-FP-CIT (specific-to-aspecific ratio between 2 and 4) and the careful visual control of all individual coregistered images in the current study without detectable coregistration errors, it was assumed that the accuracy of this approach is of the same magnitude as for intramodal perfusion/perfusion and DAT/DAT rigid registration as described (40).
CONCLUSION
In this study we have validated an automated technique of using clinically available combined perfusion and DAT SPECT and studied its contribution in the differential diagnosis of parkinsonism under clinical circumstances. This technique may supplement confidence of existing clinical measures at an earlier stage for such differential diagnosis and, thus, also for prognosis assessment and selection for therapeutic trials.
Even though CV was applied in this study and values found should be robust for novel cases, prospective confirmation of these data is currently being studied. Also, for widespread clinical use it should be demonstrated whether the technique and transfer of the canonical discriminant functions derived from this patient set to other nuclear medicine centers is feasible and retains the same discrimination accuracy.
Acknowledgments
Financial support of the Research Council of the Katholieke Universiteit Leuven is acknowledged. Support was also received from a Clinical Research Mandate of the Fund for Scientific Research, Flanders, Belgium. The authors thank Dr. Jimmy Vandeneynden for his contribution in data collection and preprocessing.
References
- Received for publication September 4, 2005.
- Accepted for publication December 1, 2005.


Jump to section
Related Articles
Cited By...
- Analysis of Extrastriatal 123I-FP-CIT Binding Contributes to the Differential Diagnosis of Parkinsonian Diseases
- Is ioflupane I123 injection diagnostically effective in patients with movement disorders and dementia? Pooled analysis of four clinical trials
- Whole-Body Biodistribution and Radiation Dosimetry of 18F-FP-(+)-DTBZ (18F-AV-133): A Novel Vesicular Monoamine Transporter 2 Imaging Agent
- Combined Striatal Binding and Cerebral Influx Analysis of Dynamic 11C-Raclopride PET Improves Early Differentiation Between Multiple-System Atrophy and Parkinson Disease
- Quantification of Striatal Dopamine Transporters with 123I-FP-CIT SPECT Is Influenced by the Selective Serotonin Reuptake Inhibitor Paroxetine: A Double-Blind, Placebo-Controlled, Crossover Study in Healthy Control Subjects