


Abstract
Striatal dopamine D2 receptor (D2R) PET has been proposed to differentiate between Parkinson disease (PD) and multiple-system atrophy with predominant parkinsonism (MSA-P). However, considerable overlap in striatal D2 binding may exist between PD and MSA-P. It has been shown that imaging of neuronal activity, as determined by metabolism or perfusion, can also help distinguish PD from MSA-P. We investigated whether the differential diagnostic value of 11C-raclopride PET could be improved by dynamic scan analysis combining D2R binding and regional tracer influx. Methods: 11C-raclopride PET was performed in 9 MSA-P patients (mean age ± SD, 56.2 ± 10.2 y; disease duration, 2.9 ± 0.8 y; median Hoehn-Yahr score, 3), 10 PD patients (mean age ± SD, 65.7 ± 8.1 y; disease duration, 3.3 ± 1.5 y; median Hoehn-Yahr score, 1.5), and 10 healthy controls (mean age ± SD, 61.6 ± 6.5 y). Diagnosis was obtained after prolonged follow-up (MSA-P, 5.5 ± 2.0 y; PD, 6.0 ± 2.3 y) using validated clinical criteria. Spatially normalized parametric images of binding potential (BP) and local influx ratio (R1 = K1/K′1) of 11C-raclopride were obtained using a voxelwise reference tissue model with occipital cortex as reference region. Stepwise forward discriminant analysis with cross-validation, with and without the inclusion of regional R1 values, was performed using a predefined volume-of-interest template. Results: Using conventional BP values, we correctly classified 65.5% (all values given with cross-validation) of 29 cases only. The combination of BP and R1 information increased discrimination accuracy to 79.3%. When healthy controls were not included and patients only were considered, BP information alone discriminated PD and MSA-P in 84.2% of cases, but the combination with R1 data increased accuracy to 100%. Conclusion: Discriminant analysis using combined striatal D2R BP and cerebral influx ratio information of a single dynamic 11C-raclopride PET scan distinguishes MSA-P and PD patients with high accuracy and is superior to conventional methods of striatal D2R binding analysis.
- 11C-raclopride
- Parkinson disease
- multiple-system atrophy
- tracer influx
- binding potential
- discriminant analysis
Multiple-system atrophy (MSA) is a neurodegenerative disease characterized clinically by various combinations of parkinsonian, cerebellar, autonomic, and pyramidal features (1). MSA is more rapidly progressive than Parkinson disease (PD) and shows a more widespread pattern of neurodegeneration. Two main motor presentations of MSA can be distinguished clinically. Parkinsonian features predominate in approximately 80% of cases (MSA-P subtype), whereas the remaining patients have cerebellar ataxia as their major motor feature (1).
Clinical differentiation between PD and MSA-P is often difficult, especially in early disease stages. Early differentiation is nevertheless important, mainly for 2 reasons. First, the accurate early diagnosis of MSA permits earlier counseling about prognosis, thus allowing patient and caregivers to take more timely measures to prepare for the expected deterioration. Second, reliable early discrimination between MSA-P and PD is crucial for clinical trials that recruit patients in early disease stages, such as trials with neuroprotective agents.
During life, the diagnosis of MSA is still largely based on clinical grounds. Clinical diagnostic criteria for MSA have been developed and validated pathologically (2,3). These consensus criteria show excellent positive predictive values (PPVs), but have rather poor sensitivity and are generally of little help in the early detection of MSA-P (1). Several technical investigations have been proposed to aid in the differential diagnosis of MSA-P and PD, including autonomic function testing; imaging of cardiac sympathetic innervation; sphincter electromyography; conventional, volumetric and diffusion-weighted MRI; and transcranial ultrasound (1,4,5). In addition, 18F-FDG PET or perfusion SPECT has been used as an adjunct in this differential diagnosis (6–11). Finally, previous work has also suggested that discrimination between PD and MSA-P can be improved by dopamine D2 receptor (D2R) imaging, using the PET D2R ligands 11C-raclopride (6–9) or 18F-desmethoxyfallypride (10) or the SPECT D2R ligands 123I-IBZM (11–14), 123I-epidepride (15), or 123I-benzofuran (16). The rationale behind these studies is that D2R-expressing striatal neurons tend to degenerate in MSA-P but not in PD. Indeed, D2R binding in the striatum (especially the posterior putamen) of MSA-P patients, compared with healthy controls, was reported to be reduced (6,7,9,12,14,16). In PD patients, compared with healthy controls, striatal DR2 binding was found to be normal, increased, or decreased (6,7,9,12). Importantly, most (6,9,11–13), but not all (7), studies found substantial overlap in striatal D2R binding measures between MSA-P and PD, which may limit the diagnostic value of D2R imaging in individual cases (5).
In our present study, we sought to determine whether the differential diagnostic value of 11C-raclopride PET in the early stages of MSA-P and PD can be increased by including not only data on striatal 11C-raclopride binding potential (BP) but also information on regional 11C-raclopride tracer delivery as an approximate relative indicator of regional blood flow.
MATERIALS AND METHODS
Subjects
We started from a database of 80 subjects who had undergone 11C-raclopride PET for differential diagnosis of parkinsonism at the University Hospital Leuven from 2001 to 2005. In each of these cases, 11C-raclopride PET had been performed at the request of the treating neurologist to assist in a clinically difficult differential diagnosis between PD and MSA-P or progressive supranuclear palsy. In this database, we identified all patients who eventually fulfilled established clinical diagnostic criteria for MSA-P (n = 8) or PD (n = 5) after extended clinical follow-up. For the diagnosis of MSA-P, the consensus criteria—which have a PPV of 91% for the pathologic diagnosis of MSA for probable MSA-P—were used (2,3). The diagnosis of PD was made using the Gelb criteria for possible or probable PD (17), which have a PPV of 92% and 93%, respectively, for the pathologic diagnosis of PD (18). Clinical diagnosis based on these criteria was assigned retrospectively by an investigator who was unaware of the 11C-raclopride PET results and was used as the diagnostic gold standard in this study. Patients who took dopamine agonists (bromocriptine, cabergoline, pergolide, pramipexole, or ropinirole) or neuroleptics were excluded.
In addition to this retrospective part, 1 and 5 patients fulfilling clinical criteria for probable MSA-P (3) and probable PD (17), respectively, and 10 age-matched healthy controls were recruited for 11C-raclopride PET. This additional prospective recruitment was approved by the local ethics committee, and written informed consent was obtained.
To calculate levodopa-equivalent daily dose, we assumed that 100 mg of standard levodopa was equivalent to 133 mg of controlled-release levodopa or 75 mg of levodopa plus entacapone.
Radiotracer Preparation
11C-Raclopride was produced by alkylation of norraclopride with 11C-CH3OTf (methyl triflate). The 11C-methyl triflate was prepared from 11C-CH4, which was obtained through an IBA Cyclone 18/9 irradiation of a mixture of N2/H2 (94.5/5.5 v/v) with 18-MeV protons. The radiochemical purity was always greater than 95%, and the maximal amount of raclopride in a recipient was 20 μg (specific activity > 740 GBq/mmol).
Imaging
All subjects received 222 MBq (6 mCi, ±5%) of 11C-raclopride in a slow intravenous bolus. Patients were asked to omit their morning levodopa dose on the day of the scan. All scans were performed on an HR+ PET camera (Siemens). Images were acquired dynamically immediately after injection, over 60 min (6 × 30 s, 2 × 60 s, and 11 × 300 s). Reconstruction was done using 3-dimensional filtered backprojection with measured attenuation, scatter, and randoms correction. Isotropic 2-dimensional gaussian postreconstruction filtering was used (full width at half maximum, 0.48 cm).
Data Analysis
Reference tissue modeling was used for the calculation of voxelwise parametric images (MRTM2 model, PMOD, version 2.7; PMOD Technologies). Parametric images of BP and local influx values relative to the whole brain (R1), defined as the ratio of regional tracer influx K1 to the influx of the reference region K1′ (R1 = K1/K1′), were calculated. The occipital region was used as reference region because in MSA cerebellar degeneration could hamper the use of the cerebellum as reference region (19,20). Parametric maps were spatially normalized using statistical parametric mapping (SPM2; The MathWorks), based on the R1 images, and the same transformation was given to the aligned BP images.
To evaluate voxel-based differences between the studied groups, in addition SPM2 was performed on BP and influx images, using a 3-group categoric comparison design. Data were smoothed with an isotropic 12-mm gaussian kernel. For BP maps, no proportional scaling was used, and a relative (gray matter) analysis threshold of 80% was applied. For regional R1 influx analysis, proportional scaling was used. Standardly, we explored data using a voxel-intensity P value (pheight) less than 0.001 (uncorrected) and an extent threshold greater than 50 voxels (0.4 cm3), unless otherwise specified.
For individual results, a predefined volume-of-interest (VOI) approach was used, with a previously published template (21) based on Brodmann areas and division of the putamen in anterior and posterior parts divided by the commissural line. Because of the known distortion and incomplete accuracy of spatial normalization in deep areas of gray matter (21), the striatal and thalamic VOIs were individually adjusted by a restricted manual procedure (allowing only shifts, taking into account both BP and R1 images). Conventional statistical discriminant analysis was performed on these VOI values and ratios, using BP in combination with R1 values (SPSS, version 11). A stepwise forward model was used, based on the significant VOIs (determined by 1-way ANOVA with post hoc Tukey test) and using the F-ratio method. Cross-validation was performed using the leave-one-out technique, meaning that each case was classified by the functions derived from all cases other than that case, to obtain realistic classification accuracy values for new clinical cases. Differences were considered significant at the P equals 0.05 level.
RESULTS
Clinical Characteristics of Study Subjects
11C-raclopride PET was performed in 9 patients with MSA-P, 10 patients with PD, and 10 healthy controls. Table 1 shows demographic and clinical subject characteristics. Age at the time of PET was not significantly different among the 3 groups. There was no significant difference in disease duration at the time of PET, total duration of clinical follow-up, or levodopa-equivalent daily dose between the MSA-P and the PD groups. The proportion of males was significantly higher in the PD group than in the MSA-P group. Parkinsonism (as expressed by Hoehn-Yahr stage) at the time of PET was clinically more severe in the MSA-P than in the PD group, consistent with the more rapid progression of MSA.
Demographic and Clinical Subject Characteristics
Group Differences in 11C-Raclopride BP and Influx
Transverse slices of 11C-raclopride BP and transverse, sagittal, and coronal slices of 11C-raclopride R1 from individual representative subjects are shown in Figure 1.
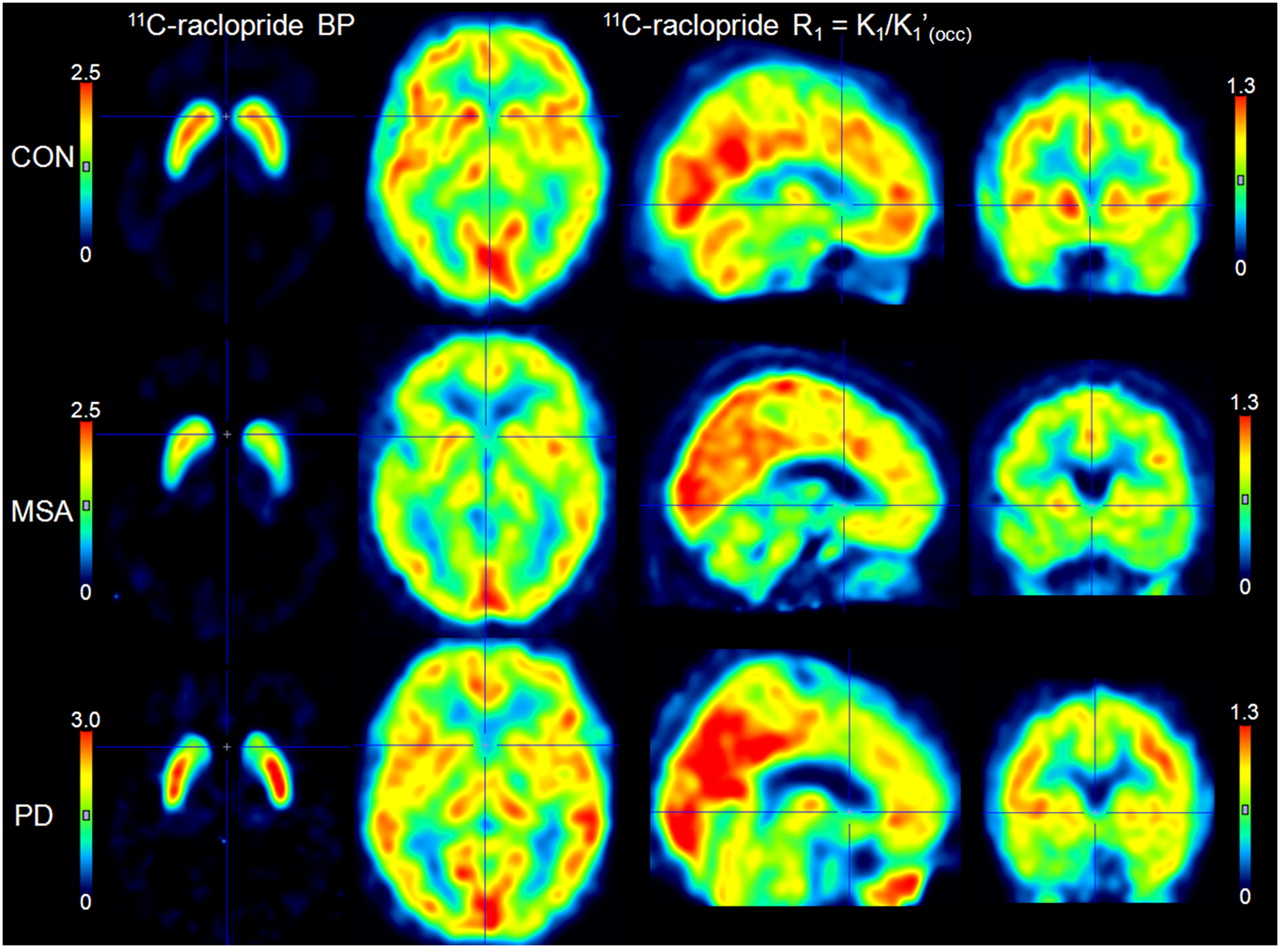
Representative transverse slices of 11C-raclopride BP and orthogonal slices of 11C-raclopride R1 (parametric maps) in healthy volunteer, MSA patient, and PD patient. Images are in radiologic orientation. CON = control; OCC = occipital.
We performed SPM analysis of the group differences in 11C-raclopride BP among controls, MSA, and PD. As shown in Figure 2A, the PD group had slightly lower 11C-raclopride BP in the caudate and slightly higher binding in the posterior putamen than did the controls. By contrast, MSA patients, compared with controls, showed decreased binding in the caudate and especially the putamen. Compared with PD, the MSA group showed a bilateral decrease in the putamen, most prominently in the posterior part.
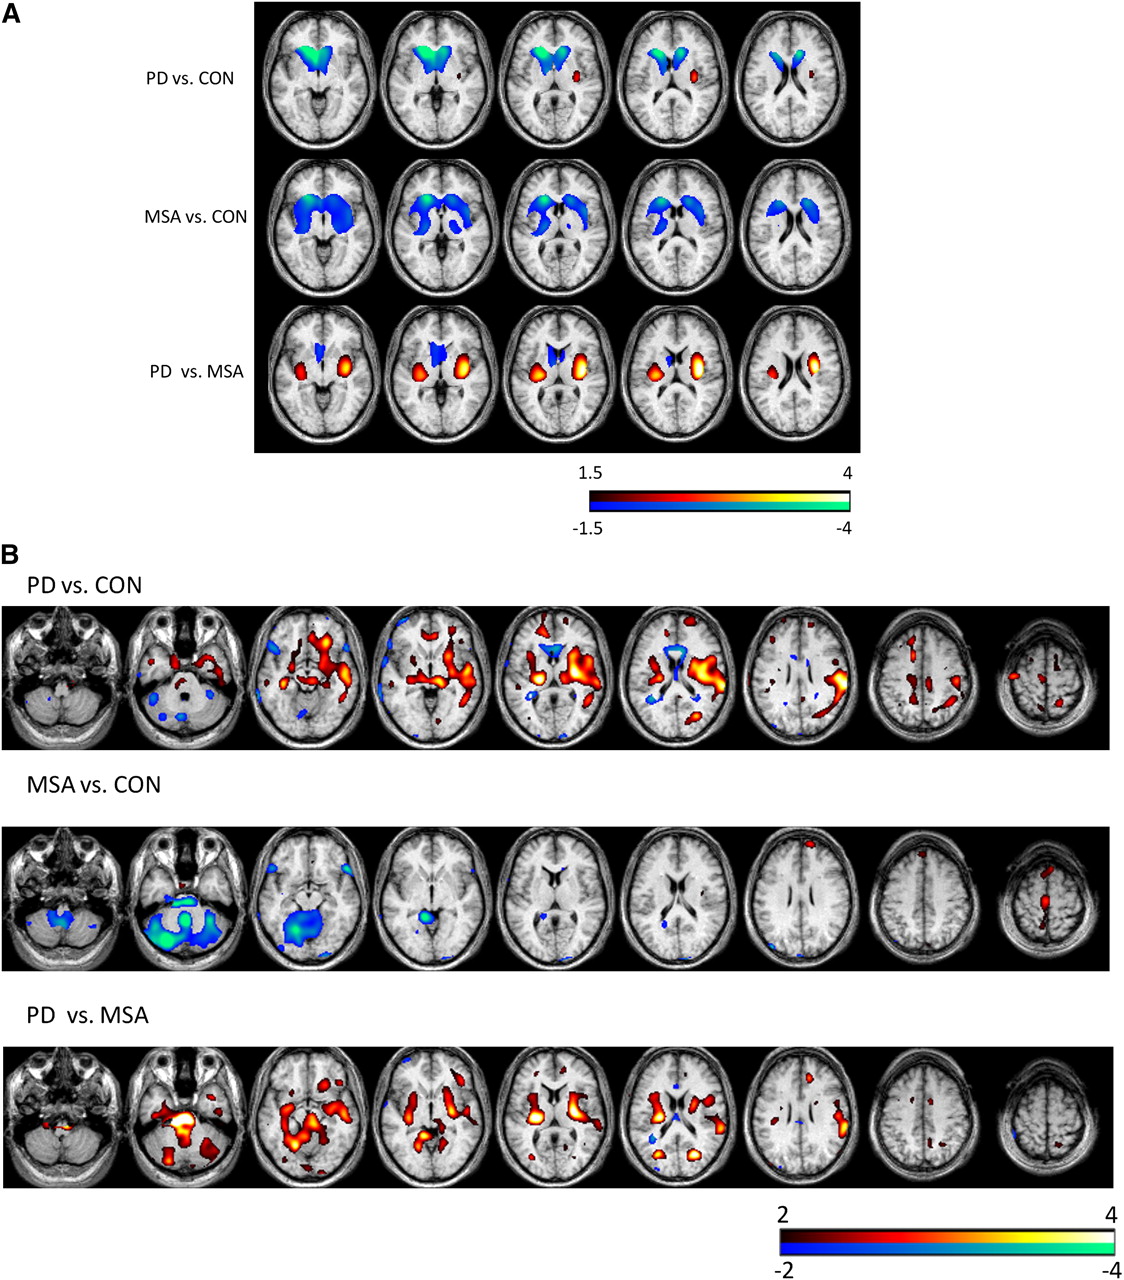
Results of SPM analysis of group difference among controls (CON), MSA, and PD for 11C-raclopride BP images (A) and R1 relative influx images (B). Images are in radiologic orientation.
Figure 2B shows the results of SPM analysis of the group differences in 11C-raclopride R1 among the 3 groups. Compared with controls, PD patients had relative increases in 11C-raclopride R1 in the medial temporal and left insular cortex, temporofrontal areas, striatum, and thalamus. The MSA group, compared with controls, showed decreased cerebellar influx; in addition, the MSA group, compared with the PD group, showed decreased striatal, ventral mesencephalic, pontine and cerebellar influx.
Discriminant Analysis
BP Indices Alone
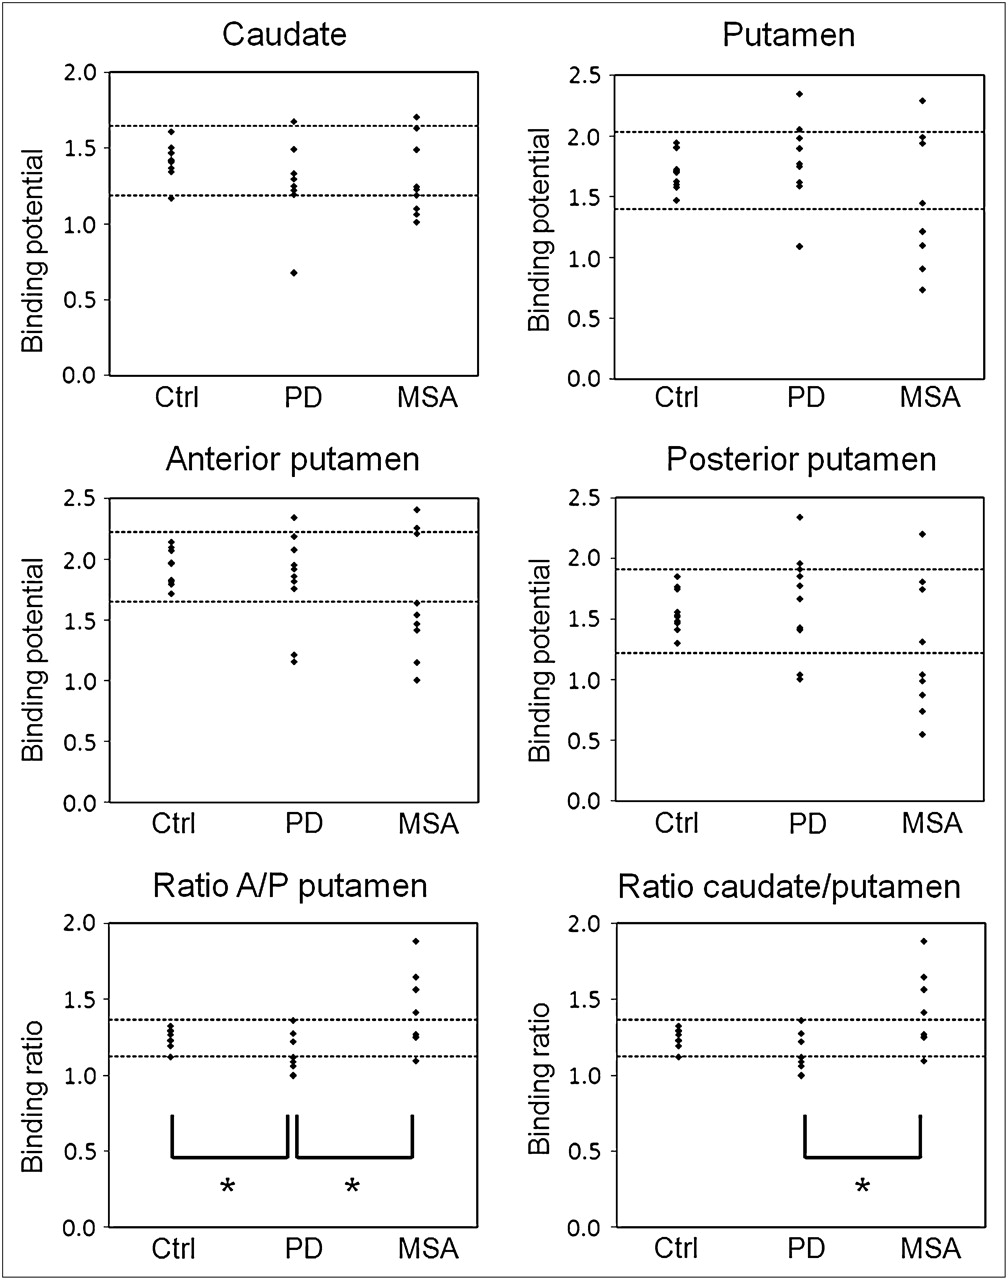
Figure 3 shows the individual data plots for 11C-raclopride BP in the caudate, putamen, and anterior and posterior putamen and 11C-raclopride anterior–to–posterior putamen and caudate-to-putamen BP ratios. The 3 subject groups showed substantial overlap for all 11C-raclopride BP indices. ANOVA with post hoc Tukey's test showed significant differences between PD and MSA only for the ratio indices: the anterior–to–posterior putamen BP ratio was 1.13 ± 0.11 in PD versus 1.44 ± 0.25 in MSA (P = 0.001), and the caudate-to-putamen BP ratio was 0.70 ± 0.07 in PD versus 0.98 ± 0.22 in MSA (P = 0.0008).

Binding indices derived from 11C-raclopride BP images. Horizontal dashed lines indicate normal limits, defined as mean ± 2 SD of control values. Asterisks indicate statistically significant differences (1-way ANOVA followed by post hoc Tukey test, P < 0.01). Ctrl = control.
We next performed discriminant analysis using the anterior–to–posterior putamen and caudate-to-putamen BP ratio data only. With and without cross-validation, 65.5% (19/29) of the grouped cases were correctly classified (Supplemental Table 1; supplemental materials are available online only at http://jnm.snmjournals.org). In particular, 4 of 9 MSA-P cases were misclassified (2 as normal and 2 as PD).
When we considered the clinically more realistic situation in which only patients with parkinsonism (MSA or PD) were included but not healthy controls, discriminant analysis resulted in 84.2% (16/19) correct classification with and without cross-validation (Supplemental Table 2).
R1 Indices Alone
Next, discriminant analysis was performed using 11C-raclopride R1 information alone. For input, we considered only those regions with significant 1-way ANOVA differences in R1: bilateral cerebellum, bilateral pons, thalamus, left insula, bilateral parahippocampal gyrus, and posterior putamen and anterior–to–posterior putamen R1 ratio. These discriminant R1 indices showed substantial overlap between the 3 subject groups, as illustrated for some of these indices in Figure 4. Discriminant analysis based on R1 imaging alone enabled discrimination of 62.1% (18/29) of cases (with cross-validation).

Box plots of most discriminating R1 regions: cerebellum (A), pons (B), putamen (C), and anterior–to–posterior putamen ratio (D). Means are denoted by square marker, individual data points by triangular markers. Box shows mean ± 1 SE and bars mean ± 2 SDs. Ctrl = control.
Combination of BP and R1 Indices
Finally, we performed discriminant analysis based on combined 11C-raclopride BP and R1 information, using the same BP and R1 indices as in the separate discriminant analyses. This led to the correct classification of 79.3% of cross-validation cases (93.1% without cross-validation) (Table 2). When only MSA and PD patients were included, imaging correctly classified 100% (19/19) of cross-validated PD and MSA-P cases (Table 3). Supplemental Figure 1 shows the canonical discriminant cluster plot for the 3-group classification.
Predicted Group Membership Table for Discriminant Analysis Based on BP and R1 (All Groups)
Predicted Group Membership Table for Discriminant Analysis Based on BP and R1 (only PD and MSA)
DISCUSSION
In the present study, we analyzed the value of 11C-raclopride PET in the differential diagnosis of MSA-P and PD. Three studies have previously investigated the ability of 11C-raclopride PET to discriminate between MSA-P and PD (5,7,9). However, a major difference between the present study and the 3 previous reports is that we included both BP and regional influx of 11C-raclopride in the analysis, whereas the previous studies analyzed 11C-raclopride BP only. We show that combined analysis of striatal BP and regional influx of 11C-raclopride considerably increases the ability of 11C-raclopride PET to discriminate between PD and MSA-P.
When we limited our analysis to striatal 11C-raclopride BP, we found that anteroposterior BP gradients were the most discriminating parameters: the caudate–to–putamen and anterior–to–posterior putamen BP ratios were significantly higher in MSA-P than in PD. This preferential loss of D2R binding in the putamen, especially the posterior putamen, in MSA-P is consistent with previous studies (5,9,16). However, even these anteroposterior BP gradients showed substantial overlap between the PD and MSA-P groups. Similar overlap between MSA and PD has been noted in several previous D2R imaging studies (6,9,11–13,15), and this limits the differential diagnostic usefulness of 11C-raclopride BP analysis in individual patients. On the other hand, analysis of regional 11C-raclopride influx revealed significant differences between the PD and MSA groups in several brain areas. For example, R1 values in the bilateral pons, bilateral cerebellum, and posterior putamen were significantly lower in the MSA-P group than in the PD group, consistent with previous perfusion and metabolic imaging studies (7,9,22–24). However, we again observed extensive overlap between the MSA-P and the PD populations, even for the regions with the most significant R1 differences. Importantly, combined analysis of striatal BP and regional R1 indices of 11C-raclopride resulted in improved separation of MSA-P and PD patients and correctly classified all patients. This combined analysis did not require any additional costs or create extra burden for the patient, because both types of information were extracted from a single 11C-raclopride PET scan.
Although similar to the increases in 18F-FDG studies, the relative increases in 11C-raclopride influx observed in PD versus controls and MSA patients, especially in the striatum, do not necessarily represent a surrogate marker of altered neuronal activity and may be influenced by the choice of normalization region, as demonstrated recently by Borghammer et al. (25,26).
Previous 11C-raclopride PET studies included only patients who already had a clinically well-established diagnosis of PD or MSA-P at the time of the scan (7,9). Consequently, 11C-raclopride PET in these previous studies was performed in relatively advanced disease stages, after an average disease duration of approximately 5 y or more (7,9). In the present study, patients were scanned at earlier disease stages, after an average disease duration of only approximately 3 y. In most of our subjects, the clinical diagnosis was still uncertain at the time of PET and became established only after prolonged subsequent follow-up. Thus, we believe our study design more closely matches the clinically relevant situation in which clinicians are in need of a technical investigation to assist them in the differential diagnosis of patients with an unclear, relatively early-stage parkinsonian syndrome.
Our study had several methodologic limitations. First, there was no pathologic confirmation of the clinical diagnosis. Still, the clinical diagnosis was made after extended follow-up in strict accordance with validated diagnostic criteria that were shown to have a PPV of more than 90% for the pathologic diagnosis (3,18). Second, the partly retrospective nature of the study made it impossible to have all subjects examined clinically by the same investigator. Thus, there may have been interrater differences in the way the clinical findings were reported. A third limitation of the study is related to the use of levodopa. Patients were asked to omit their morning dose of levodopa on the day of the scan. However, because of the partly retrospective design of the study, it was difficult to ascertain in retrospect whether all patients had followed this request. The administration of 250 mg of oral levodopa to PD patients has been shown to result in a slight (∼10%) reduction of striatal 11C-raclopride BP during the subsequent “on” state (27). However, it seems unlikely that possible inadvertent intake of levodopa by some of our patients would have influenced the results, as we did not find correlations between regular morning levodopa dose and 11C-raclopride BP either by SPM or VOI analysis (data not shown). Another limitation was that we used relative 11C-raclopride influx R1, rather than a conventional perfusion or metabolism marker, as an indirect measure of neuronal function. To our knowledge, there is no existing study that has directly compared these influx values with regional perfusion imaging for 11C-raclopride. However, the regional pattern of significant changes in 11C-raclopride R1 closely matched that observed in other perfusion studies and implies striatum, pons, and cerebellum as the most significant discriminators between MSA and PD (22,28). Finally, the number of patients in our study was relatively small. However, we cross-validated our discriminant function using the statistical leave-one-out technique, thus increasing the probability that our predictive model would perform accurately in an independent set of patients. Such cross-validation techniques have not been used in any previous D2R imaging studies. It would be of interest to determine how many patients could already be classified correctly as PD or MSA purely based on visual inspection of 11C-raclopride images. Although we did not perform a formal interobserver reading study on these data, it can be seen in Figure 3 that only about 5 of 10 MSA cases, compared with controls, had an appreciably lower BP in the (especially posterior) putamen. Figure 3 and the R1 images in Figure 4 indicate that the PD cases showed marked overlap with controls and MSA cases in the different regions, making it unlikely that PD, MSA, and control cases could be discriminated by visual inspection alone. Thus, statistical discriminant analysis substantially improves the accuracy of diagnostic classification.
We are aware that only a limited number of nuclear medicine centers have the ability to produce 11C-raclopride, and therefore overall accessibility to this technique may be limited. On the other hand, for the differential diagnosis between MSA and PD it may be worthwhile to centralize this specialized methodology to tertiary care centers to obtain maximal diagnostic accuracy. Alternatively, a combination of dual perfusion imaging (e.g., using 99mTc-ethyl cysteinate dimer or hexamethylpropyleneamine oxime SPECT) and dopamine receptor imaging (e.g., by 123I-IBZM or 123I-epidepride SPECT) may be able to provide similar information with more widespread clinical penetration.
Despite these limitations, our results suggest that combined analysis of striatal BP and regional influx of 11C-raclopride is superior to traditional methods of striatal 11C-raclopride binding analysis for early discrimination between PD and MSA-P. Recently, revised criteria have been proposed for the diagnosis of MSA (29). One of the differences from the original consensus criteria for MSA (2) is that the revised criteria include neuroimaging features for the diagnostic category of possible MSA (5,29). Our study suggests that the classification accuracy of our method for early-stage MSA-P and PD is similar to that reported for diffusion-weighted MRI of the striatum (12) and higher than that of transcranial ultrasound of the substantia nigra (4,30) or imaging of cardiac sympathetic innervation (5). Future research should be conducted to prospectively confirm the predictive accuracy of our 11C-raclopride PET analysis method in a new cohort of patients with early-stage, clinically uncertain parkinsonian syndromes.
Furthermore, this study underlines that it is imperative to evaluate D2R imaging quantitatively in this differential diagnosis and that visual assessment is unsatisfactory (31).
CONCLUSION
Discriminant analysis combining striatal 11C-raclopride binding with striatal gradient analysis and regional 11C-raclopride influx distinguishes MSA and PD patients with high accuracy and outperforms more conventional methods of 11C-raclopride PET analysis.
Acknowledgments
We thank the staff of the PET radiopharmacy for their expertise. Koen Van Laere and Wim Vandenberghe are senior clinical investigators of the Fund for Scientific Research, Flanders, Belgium (FWO).
Footnotes
-
COPYRIGHT © 2010 by the Society of Nuclear Medicine, Inc.
References
- Received for publication September 2, 2009.
- Accepted for publication January 11, 2010.


Jump to section
Related Articles
Cited By...
- Atypical Parkinsonian Syndromes: Structural, Functional, and Molecular Imaging Features
- Dynamic 18F-FPCIT PET: Quantification of Parkinson Disease Metabolic Networks and Nigrostriatal Dopaminergic Dysfunction in a Single Imaging Session
- Assessment of Striatal Dopamine D2/D3 Receptor Availability with PET and 18F-Desmethoxyfallypride: Comparison of Imaging Protocols Suited for Clinical Routine
- Dual-Biomarker Imaging of Regional Cerebral Amyloid Load and Neuronal Activity in Dementia with PET and 11C-Labeled Pittsburgh Compound B