


Abstract
PET is used to image active inflammatory processes by targeting the translocator protein (TSPO). In vitro, second-generation TSPO radioligands, such as PBR111, have been shown to bind to human tissue samples with either high affinity (high-affinity binders, HABs), low affinity (low-affinity binders, LABs), or an intermediate, mixed affinity (mixed-affinity binders, MABs). We previously explained these differences in affinity in human tissue via the rs6971 polymorphism in the TSPO gene and predicted that the specific signal from PET ligands in vivo would vary accordingly. In silico modeling predicted that 18F-PBR111 would have a moderate to high specific-to-nonspecific ratio in the normal human brain. To test these predictions, we present here the analysis and modeling of 18F-PBR111 data in healthy humans. Methods: Twenty-one subjects (9 HABs, 8 MABs, and 4 LABs), 28–62 y old, genotyped for the rs6971 polymorphism, underwent 120-min PET scans with arterial sampling after a bolus injection of 18F-PBR111. Compartmental models and Logan graphical methods enabled estimation of the total volume of distribution (VT) in regions of interest (ROIs). To evaluate the specific signal, we developed 2 methods to estimate the nondisplaceable volume of distribution (VND): the first assumed that the in vitro affinity ratio of 18F-PBR111 in HABs relative to LABs (4-fold) is preserved in vivo; the second modeled the difference in the HAB and MAB signals in the context of an occupancy plot. Results: A 2-tissue-compartment model described the data well, and a significant difference was found between the VT of HABs, MABs, and LABs across all ROIs examined (P < 0.05). We also found a significant correlation between VT and age for both HABs and MABs in most ROIs. The average VND estimated by the 2 methods was 1.18 ± 0.35 (method I: VND = 0.93, method II: VND = 1.42), implying that the 18F-PBR111 BPND was 2.78 ± 0.46 in HABs, 1.48 ± 0.28 in MABs, and 0.51 ± 0.17 in LABs and that the in vivo affinity ratio was similar to that measured in vitro. Conclusion: 18F-PBR111 shows a high specific signal in the healthy human brain in vivo. A large component of the variability in the signal across subjects is explained by genetic variation and age, indicating that 18F-PBR111 can be used for the quantitative assessment of TSPO expression.
The inflammatory response within the brain and spinal cord is mediated by microglia, the resident immunocompetent cells of the central nervous system. Microglia become activated after mild to severe neuronal damage resulting from traumatic, inflammatory, degenerative, or neoplastic disease (1) and have therefore been used as an index of neuroinflammatory processes in imaging studies. A method to quantify microglial activation would prove of utility as a diagnostic tool or a pharmacodynamic marker in drug development.
PET has the unique ability to quantify microglial density in the human brain noninvasively by targeting the 18-kDa translocator protein (TSPO), formerly known as the peripheral benzodiazepine receptor (PBR). The TSPO is a nuclear encoded mitochondrial protein, present in high density in macrophages and microglia and elevated in a variety of neuroinflammatory brain diseases, such as Alzheimer disease, multiple sclerosis, stroke, and Huntington disease (2–5). PK11195 ([1-(2-chlorophenyl)-N-methyl-N-(1-methylpropyl)-3-isoquinoline carboxamide]), a selective antagonist for the TSPO, has been labeled with 11C and used as a PET radioligand for more than 15 y to image neuroinflammation (6). However, the low brain extraction and poor signal-to-noise ratio of 11C-(R)-PK11195 images have led to the search for improved TSPO PET imaging agents.
In the past 5 y, a substantial number (>50) of second-generation TSPO ligands have been proposed, including 18F-PBR111, 11C-PBR28, 18F-FEPPA (18F-N-2-(2-fluoroethoxy)benzyl)-N-(4-phenoxypyridin-3-yl)acetamide), and 11C-DPA713 (11C-N,N-diethyl-2-[2-(4-methoxyphenyl)-5,7-dimethyl-pyrazolo[1,5-a]pyrimidin-3-yl]-acetamide) (7–10). Although these ligands were claimed to have increased delivery across the blood–brain barrier or a higher signal-to-noise ratio than 11C-(R)-PK11195, initial human studies have demonstrated considerable variability in their binding across subjects, including the presence of the so-called nonbinders, healthy subjects who demonstrated very little if any binding of 11C-PBR28 (8). We have previously demonstrated in vitro, in human tissue samples, that all second-generation ligands tested bind TSPO with either high affinity (high-affinity binders, HABs), or low affinity (low-affinity binders, LABs), and that some subjects have a mix of high- and low-affinity binding sites (mixed-affinity binders, MABs) (11,12). This finding has retrospectively explained the “nonbinders” phenomenon, as the affinity of 11C-PBR28 to LABs was only 188 nM (11) and thus no specific binding in these subjects would be expected. The presence of MABs in the population also explained the variability in the PET signal across healthy volunteers, as these subjects may be expected to have significantly lower-affinity binding of the second-generation ligands, from HAB. We went on to demonstrate that these different binding patterns in humans are fully explained by the rs6971 polymorphism in the TSPO gene (13). The frequencies of this polymorphism vary across ethnic groups, with Caucasians having the highest frequency for LABs (HAB:MAB:LAB = 49:42:9) compared with African Americans (56:38:6) and Han Chinese and Japanese (94:6:0.001). Our hypothesis that the rs6971 polymorphism explained the large between-subject variability seen with second-generation TSPO PET ligands was consistent with early imaging data from our group (14) and with data showing differences between HAB and MAB binding for TSPO ligands, 18F-FEPPA, and 11C-PBR28 (9,15).
We previously evaluated 18F-PBR111 in vivo in the nonhuman primate brain, which demonstrated high delivery, fast kinetics, and high signal-to-noise ratio (BPND ∼ 4), based on the blockade of the 18F-PBR111 binding with unlabeled PK11195 (7 mg/kg intravenously) (16). Advances in our in silico biomathematic model predicting the in vivo performance of radioligands in humans (17) enabled us to account for the influence of genetic polymorphisms in the target protein. Our model predicted that 18F-PBR111 would show moderate to high specific binding in the healthy human brain across genetic groups (18). Evidence of the ubiquitous expression of TSPO throughout the brain (19) and the global reduction in 18F-PBR111 binding after the administration of unlabeled PK11195 in the nonhuman primate (16) indicated that any reference region approach will be confounded by a contribution from specific binding.
Here, the quantification of 18F-PBR111 from an initial study in healthy human volunteers is presented, including full kinetic modeling and analysis. We developed mathematic methods that enable estimation of the nondisplaceable volume of distribution (VND) of 18F-PBR111, which then allows calculation of the binding potential (ratio of specific volume of distribution to VND) in the population (20). We tested the hypothesis that in vivo, the 18F-PBR111 signal is dependent on the rs6971 polymorphism in the TSPO gene, and we evaluated the effects of age on binding in the human brain.
MATERIALS AND METHODS
Human Subjects
Data were acquired as part of 2 PET studies conducted at Imanova Centre for Imaging Sciences, London. In total, 21 healthy volunteers, aged between 28 and 62 y (mean ± SD, 51 ± 10 y; 14 women and 7 men) and having an average body weight of 77.2 ± 22.4 kg, were included. The studies were approved by the Essex 1 Research Ethics Committee and the Administration of Radioactive Substances Advisory Committee. All subjects gave written informed consent, and their eligibility was confirmed via full medical history, physical and neurologic examinations, routine blood tests, urine analysis, and electrocardiography. The presence of any medical or neurologic illness was an exclusion criterion.
All subjects were genotyped for the rs6971 polymorphism (9 HABs, 8 MABs, and 4 LABs) and underwent a high-resolution T1 MR imaging scan in a Tim Trio 3T scanner and an 18F-PBR111 PET scan in a Biograph 6 PET/CT scanner (Siemens Healthcare) with Truepoint gantry.
All structural MR images were inspected by an experienced clinical neuroradiologist for unexpected findings of clinical significance or features that might confound PET coregistration or quantitative analysis. In 4 cases (2 HABs and 2 MABs), focal, nonspecific alterations in the signal intensity in the white matter were noted and subjects were referred for further investigations. None of these subjects had past or present neurologic symptoms, and their physical and neurologic examination was unremarkable. Data analyses were repeated after exclusion of these subjects.
Radiopharmaceutical Preparation
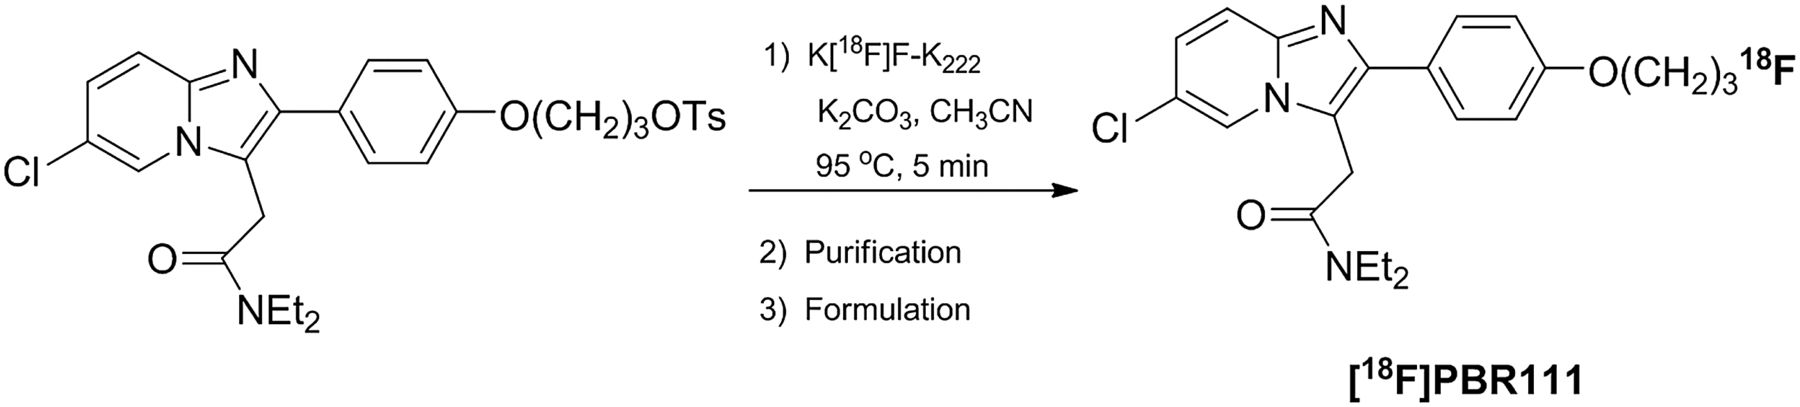
18F-PBR111 was labeled with 18F by a 1-step tosyloxy-for-fluorine nucleophilic aliphatic substitution, followed by purification by semipreparative high-performance liquid chromatography (HPLC) and reformulation (Fig. 1).
Radiosynthesis of 18F-PBR111.
Synthesis of 18F-PBR111 was previously described (21). A fully automated procedure was developed in-house using an Explora GN module (Siemens Healthcare) coupled with a semipreparative HPLC system. No-carrier-added 18F-fluoride was concentrated on a QMA cartridge (Graver Technologies) and eluted with K2CO3/K222 in H2O/CH3CN into the reaction vessel. It was consequently dried by performing 2 successive azeotropic evaporations. The tosyloxy precursor (5–10 mg in 1 mL of CH3CN) was added to the dry residue, and fluorination was performed at 95°C for 5 min. The crude reaction mixture was then diluted with water (3 mL) and loaded onto the HPLC system for purification on an Eclipse XDB C18 column (5 μm, 250 × 9.4 mm; Agilent) with 50 mM ammonium formate buffer (pH 4)/CH3CN (55:45, v/v) at 9.5 mL/min. The fraction containing 18F-PBR111 was collected in water (20 mL) and loaded onto an activated Sep-Pak Classic C18 cartridge (Waters) for reformulation in 10% ethanol/saline. Finally, a sterile filtration (0.2-μm sterile filter) was performed to deliver the final dose as a sterile and pyrogen-free solution.
Typically, the total 18F-PBR111 synthesis procedure, including HPLC purification and Sep-Pak–based formulation, is accomplished in less than 60 min. 18F-PBR111, 3.57 ± 0.89 GBq (>97% radiochemically pure, n = 21), was obtained starting from 10 GBq of 18F-fluoride with a specific radioactivity of 258.99 ± 157.38 GBq/μmol.
PET Imaging
18F-PBR111 was injected as an intravenous bolus over approximately 20 s at the start of a 120-min 3-dimensional-mode dynamic PET acquisition. Injected activities ranged from 142.9 to 182.0 MBq (165.7 ± 8.5 MBq, n = 21), and the injected mass ranged from 0.14 to 8.66 μg (1.22 ± 2.18 μg). PET data were reconstructed using filtered backprojection with corrections for attenuation and scatter (based on a low-dose CT acquisition). Dynamic data were binned into 29 frames (durations: 8 × 15 s, 3 × 1 min, 5 × 2 min, 5 × 5 min, 8 × 10 min). Arterial blood data were sampled via the radial artery to enable generation of an arterial plasma input function. A continuous sampling system (ABSS Allogg) was used to measure whole-blood activity each second for the first 15 min of each scan. Discrete blood samples were manually withdrawn at 5, 10, 15, 20, 25, 30, 40, 50, 60, 70, 80, 90, 100, 110, and 120 min after scan start to facilitate measurement of whole-blood and plasma activity. Samples taken at 5, 10, 15, 20, 30, 50, 70, 90, and 120 min were also analyzed using HPLC to determine the fraction of parent radioactivity in arterial plasma. The first 3 discrete blood samples were used to calibrate the continuous blood data, and then the continuous and discrete datasets were used to form a whole-blood activity curve covering the duration of the scan. Discrete plasma samples were divided by the corresponding whole-blood samples to form plasma-over-blood data. A constant plasma-over-blood model was fitted. This plasma-over-blood value was then multiplied by the whole-blood curve to generate a total plasma curve. Parent fraction data were fitted to a sigmoid model,  , where t is time and a, b, and c are fitted parameters. The resulting fitted parent fraction profile was multiplied by the total plasma curve and then smoothed after the peak using a triexponential fit to derive the required parent plasma input function. For each scan, a time delay was fitted and applied to the input function to account for any temporal delay between blood sample measurement and the tomographic measurements of the tissue data. Free fraction in plasma (fP) was measured through ultrafiltration (Amicon Ultra regenerated cellulose; molecular weight cutoff, 30 kDa [Millex]) in triplicate using Tris buffer (0.1 M, pH 7.4) to determine and enable correction for nonspecific binding. Filters were pretreated with 5% polysorbate 80 to reduce nonspecific binding to the filter membrane (22).
Image Analysis
Dynamic PET data were corrected for motion via frame-to-frame image registration and aligned with the individual’s structural T1-weighted MR image using SPM5 (Wellcome Trust Center for Neuroimaging, http://www.fil.ion.ucl.ac.uk/spm) with a mutual-information cost function.
The CIC neuroanatomic atlas (23) was nonlinearly deformed into the individual’s space, via mapping of T1-weighted MR imaging data, to obtain a personalized anatomic parcellation of regions of interest (ROIs). Attention focused on regions of moderate- and high-affinity binding based on previous literature (24)—brain stem, thalamus, hippocampus, global cortical regions, and cerebellum—and on representative low-affinity binding regions such as caudate. Because of defluorination of the metabolite from 18F-PBR111 (25), ROIs for the frontal, parietal, occipital, and temporal cortex and the cerebellum were eroded to avoid spill-in from uptake outside the brain (26). Each ROI was then applied to the dynamic PET data to derive regional time–activity curves.
Kinetic Analysis
One- and 2-tissue-compartment (1TC and 2TC, respectively) models using the metabolite-corrected plasma input function were applied to the dynamic PET data using a fixed blood volume correction of 5%. For each ROI examined, the total volume of distribution (VT) was estimated from the rate constants as described previously (27). The Logan graphical method (28), using a plasma input, 5% fixed blood volume, and linear start time at 35 min, was also applied to estimate the VT of each ROI and was further applied at the voxel level to produce a parametric VT map for each subject. In addition to VT, VT/fp was obtained in order to consider correction for plasma protein binding effects across subjects (15). VT and VT/fp were compared with the averaged standardized uptake value from 90 to 120 min (SUV90_120 min). Model fitting and parameter estimation were performed using software implemented in Matlab R2008b (The MathWorks, Inc.).
To investigate the scanning duration required for reproducible estimates of VT, time stability analysis was performed by analyzing scan durations ranging from 30 to 120 min in 10-min increments.
Quantification of Specific Binding Signal
VT is the sum of the specific volume of distribution and VND, which is a sum of free and nonspecifically bound tracer. In the absence of a suitable reference region, devoid of TSPO, it is not straightforward to estimate VND and calculate the nondisplaceable binding potential (BPND). We developed 2 methods to estimate VND: method I assumes that the in vitro affinity ratio between HABs and LABs is preserved in vivo, and method II models the difference in the HAB and MAB signals in the context of an occupancy plot (29).
Method I
Assuming that VND is the same across subjects and that MABs express equal amounts of the high- and low-affinity binding sites (11), it follows that
 Eq. 1
Eq. 1 where
where  ,
,  ,
,  ,
,  , and
, and  are the total volumes of distribution and binding potentials across ROIs for HABs, MABs, and LABs, respectively. If the affinity ratio between high- and low-affinity binding sites
  is known and assuming the densities of the high- and low-affinity binding sites are equal,
 Eq. 2
Eq. 2
Substituting Equation 2 into Equation 1 yields Eq. 3
Eq. 3
The in vitro affinity ratio between high- and low-affinity binding sites for 18F-PBR111 has been previously estimated in vitro as  = 4.0 (12). Thus, VND and
  for each ROI can be estimated by directly fitting the
  ,
,  , and
, and  data obtained across different ROIs to Equation 3.
Method II
Inspired by prior work estimating drug occupancy using graphical methods (29,30), we can also estimate the VND by modeling the difference in the HAB and MAB signals without needing to make any assumptions about the affinity ratio between high- and low-affinity binding sites. This allows derivation of the following equation, Eq. 4where
  under the assumption that MABs express 50% of each of the high- and low-affinity binding sites.
  ,
,  ,
,  , and
, and  are the TSPO density and equilibrium dissociation constant for HABs and LABs, respectively. Thus, by plotting
  against
  and performing a linear regression,
  can be estimated as the x-intercept.
Statistical Analysis
The Akaike information criterion (AIC) was used to evaluate the goodness of fit of the compartmental models (31). The identifiability (%) of the rate constants, expressed as the SE of their estimated values, was calculated from the diagonal of the covariance matrix (32). Identifiability (%) of VT was calculated from the covariance matrix using the generalized form of the error propagation equation (33), where correlations among rate constants were considered. The Pearson correlation coefficient was used to estimate the relationship between VT and age within each genetic group. Both 2-sample t testing and analysis of covariance were used to evaluate the difference between the genetic groups, with analysis of covariance correcting for age.
RESULTS
Plasma Analysis
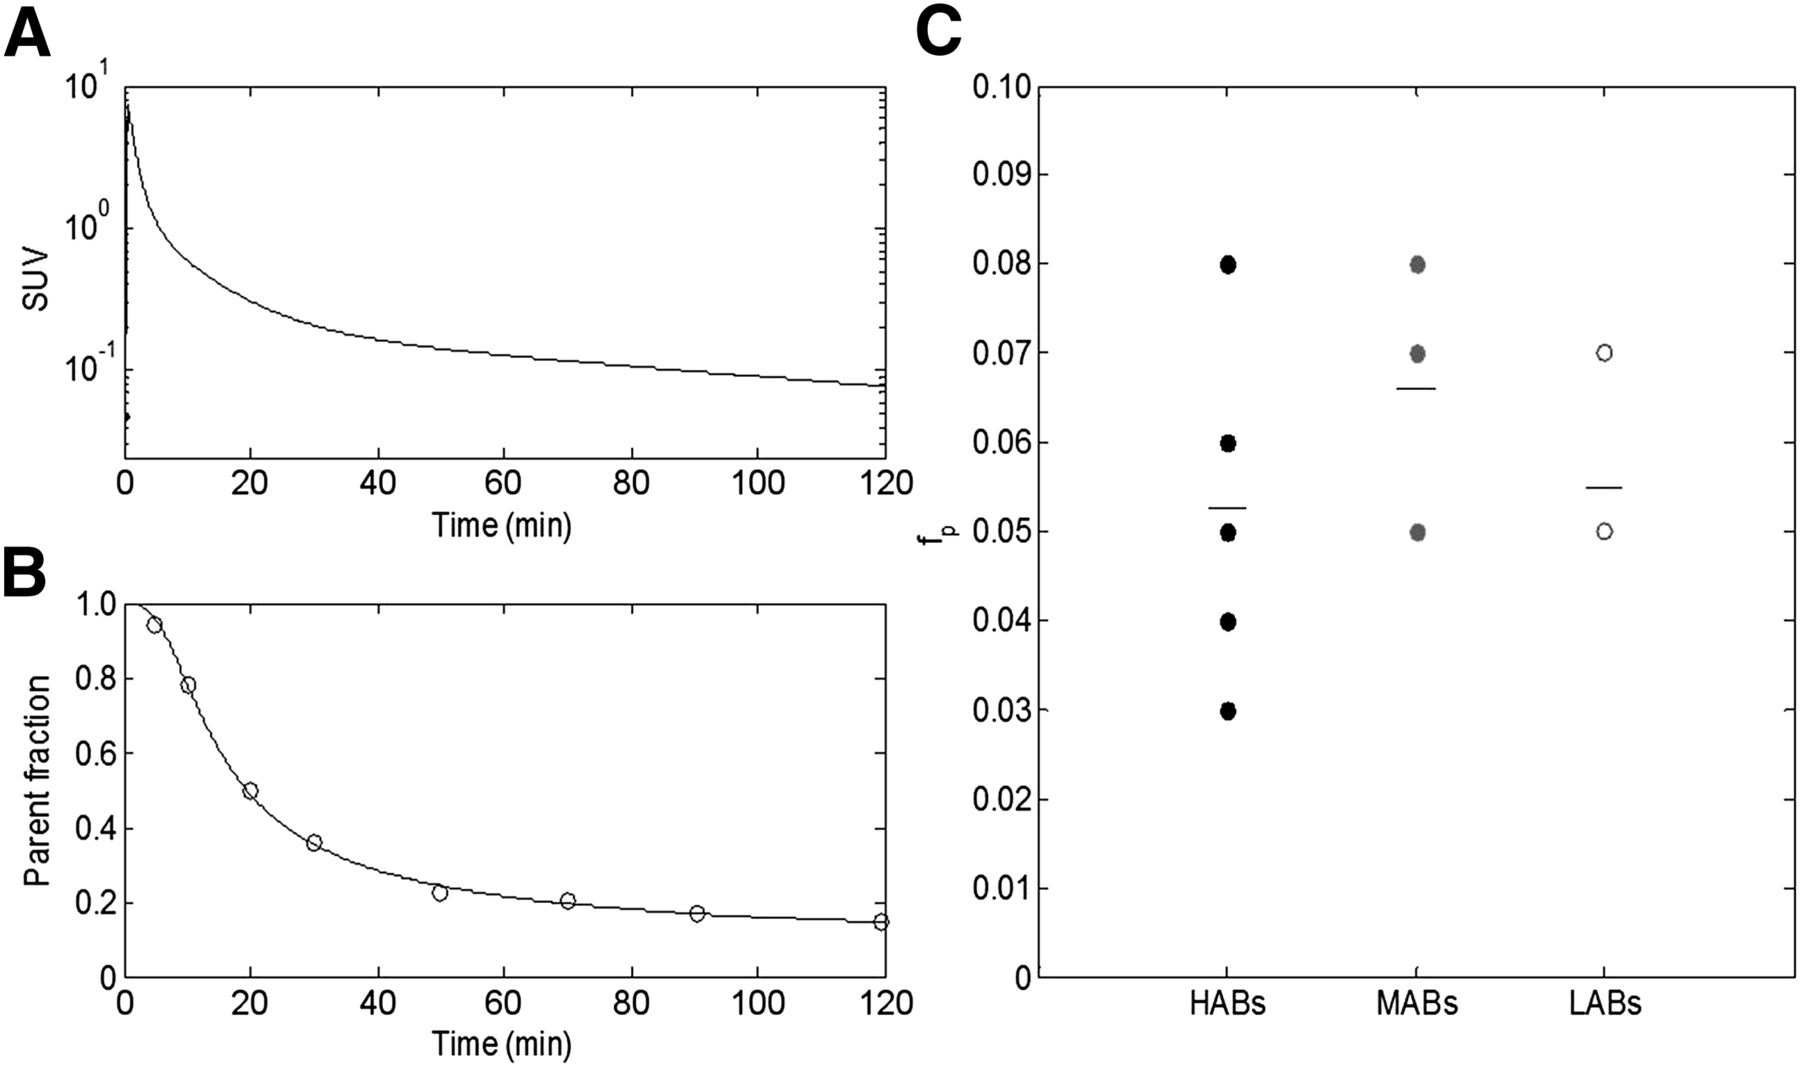
In plasma, there was a peak in the concentration of 18F-PBR111 at about 1 min followed by a rapid decrease, which was well described by a triexponential model (Fig. 2A). One metabolite appeared quickly after parent administration. The parent compound accounted for about 40% of the total concentration in plasma at 30 min, and the parent fraction further reduced and reached between 9.3% and 36.4% (20.1% ± 8.7%) at 120 min (Fig. 2B). The metabolite has been previously identified as a 3-18F-fluoropropionic acid, which is more polar than the parent compound. Bone uptake was observed with 18F-PBR111, consistent with defluorination reported for this metabolite in the literature (25). The metabolite profile did not vary across genetic groups. fp was measured for 8 HABs (0.05 ± 0.02), 6 MABs (0.07 ± 0.02), and 4 LABs (0.06 ± 0.01). No significant difference was found in fp across the different genetic groups (Fig. 2C).

Blood measurements. (A) Parent plasma concentration of HAB, fitted with triexponential model after peak. (B) Parent fraction of HAB, fitted with sigmoid parent fraction model. (C) fp for different genetic groups: HABs, MABs, and LABs, with mean estimate for each group. No significant difference was found across groups.
Kinetic Analysis
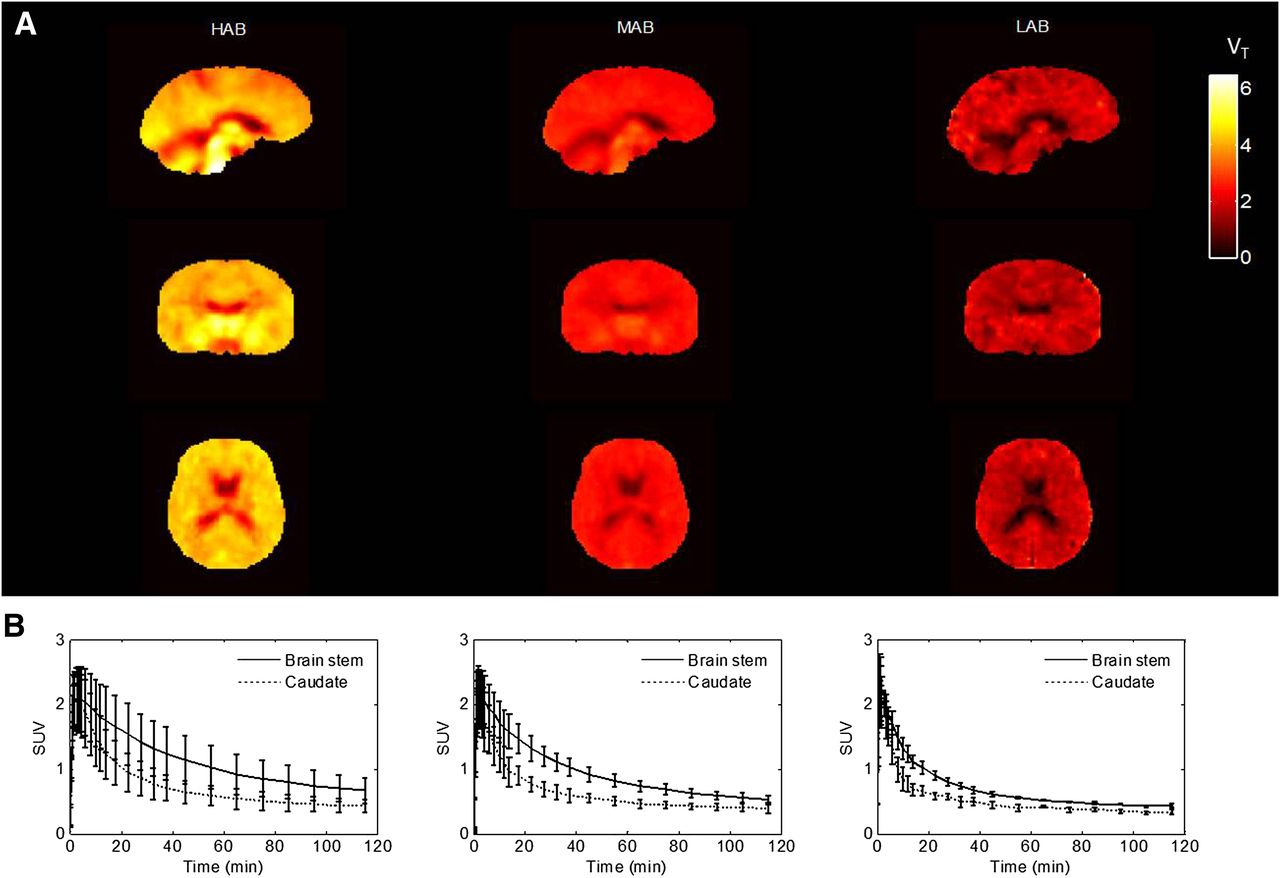
After injection, the tracer readily entered the brain and showed widespread distribution, with slightly higher signal in the thalamus, brain stem, and hippocampus, followed by other cortical regions and the cerebellum, and was lowest in the striatum, consistent with previous findings with 11C-PBR28 (24). The concentration of the ligand in tissue peaked at around 2 min for all subjects and washed out with different elimination rates corresponding to the different genetic groups (Fig. 3). In HABs, the concentration in a high-affinity binding region such as brain stem decreased to 50% of the peak at 60 min, whereas in MABs and LABs the washout was faster and the concentration decreased to 50% of the peak at 40 and 20 min, respectively.

VT parametric maps and averaged time–activity curves across genetic groups. (A) Spatially normalized average VT parametric maps for each group. (B) Average time–activity curves in brain stem and caudate for each group. Error bar is SD at each frame.
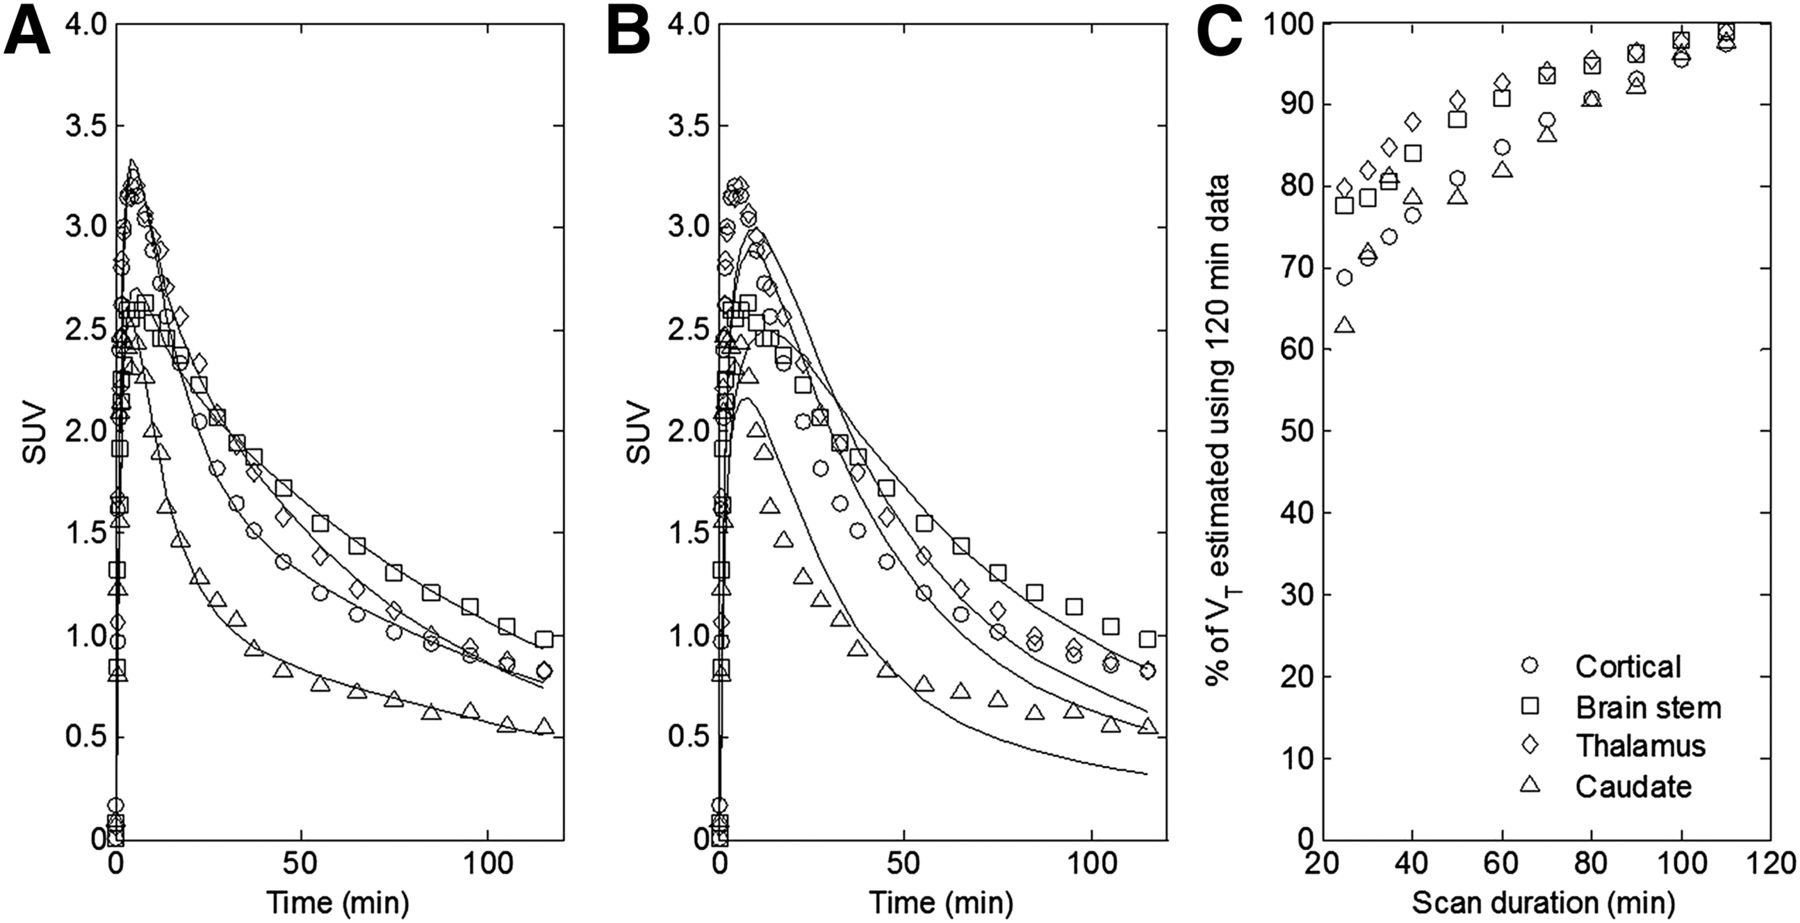
2TC and 1TC fits to the time–activity curves across ROIs in a representative HAB subject are shown in Figures 4A and 4B, respectively. The 2TC described the kinetics well and provided a better fit than the 1TC in all regions (AIC1TC = −4.08 ± 20.90 and AIC2TC = −51.13 ± 25.52). Rate constants estimated from the 2TC model are listed in Table 1. The 2TC demonstrated good identifiability of the rate constants and VT (covariance < 5%). The Logan graphical method was also used to estimate the VT in each ROI and at the voxel level to produce parametric maps. The ROI-based VT from 1TC, 2TC, and Logan for each genetic group are listed for comparison in Table 2. VT estimates from the 2TC and Logan were in good agreement with VT_logan = 0.91VT_2TC + 0.19 (r2 = 0.98). Based on better goodness of fit and good identifiability, the 2TC was selected as the model to use for further ROI analysis.

Kinetic model fits to HAB time–activity curves and time-stability analysis. (A) Unconstrained 2TC model fit to time–activity curves. (B) Unconstrained 1TC model fit to time–activity curves. (C) VT time-stability assessment for unconstrained 2TC model.
Rate Constant Estimates from 2TC Analysis
VT Estimates from 1TC, 2TC, and Logan Analysis
The time stability analysis of the 2TC model demonstrated an increase in VT extending beyond the 120-min scan duration used in our studies (Fig. 4C). This effect was present in all brain regions and for all genetic groups. A scan duration of 60 min would lead to 10%–20% underestimation of VT in comparison to a value obtained from the full 120-min acquisition.
Genetic Influence on In Vivo Binding Signal
Figure 5 compares the SUV90_120 min, VT, and VT/fp values in gray matter–masked ROIs across different genetic groups. Although a difference was observed among groups for all 3 parameters, SUV90_120 min did not reach significance whereas significant differences were found for VT among all groups (HABs vs. MABs: P < 0.038; HABs vs. LABs: P < 0.011; and MABs vs. LABs: P < 0.032). Accounting for plasma free fraction (VT/fp) did not reduce the variability between subjects. The VT/fp of HABs was significantly different from that of MABs and LABs across all regions, but significant differences between MABs and LABs were found in only a few regions such as the hippocampus and brain stem. Thus, only VT is considered in the following analyses. The average absolute difference in VT between HABs and MABs is 1.54 ± 0.23, which is similar to the average absolute difference observed between MABs and LABs (1.14 ± 0.17). This finding is consistent with the hypothesis that MABs express half the high-affinity sites and half the low-affinity sites, in which case  .
.
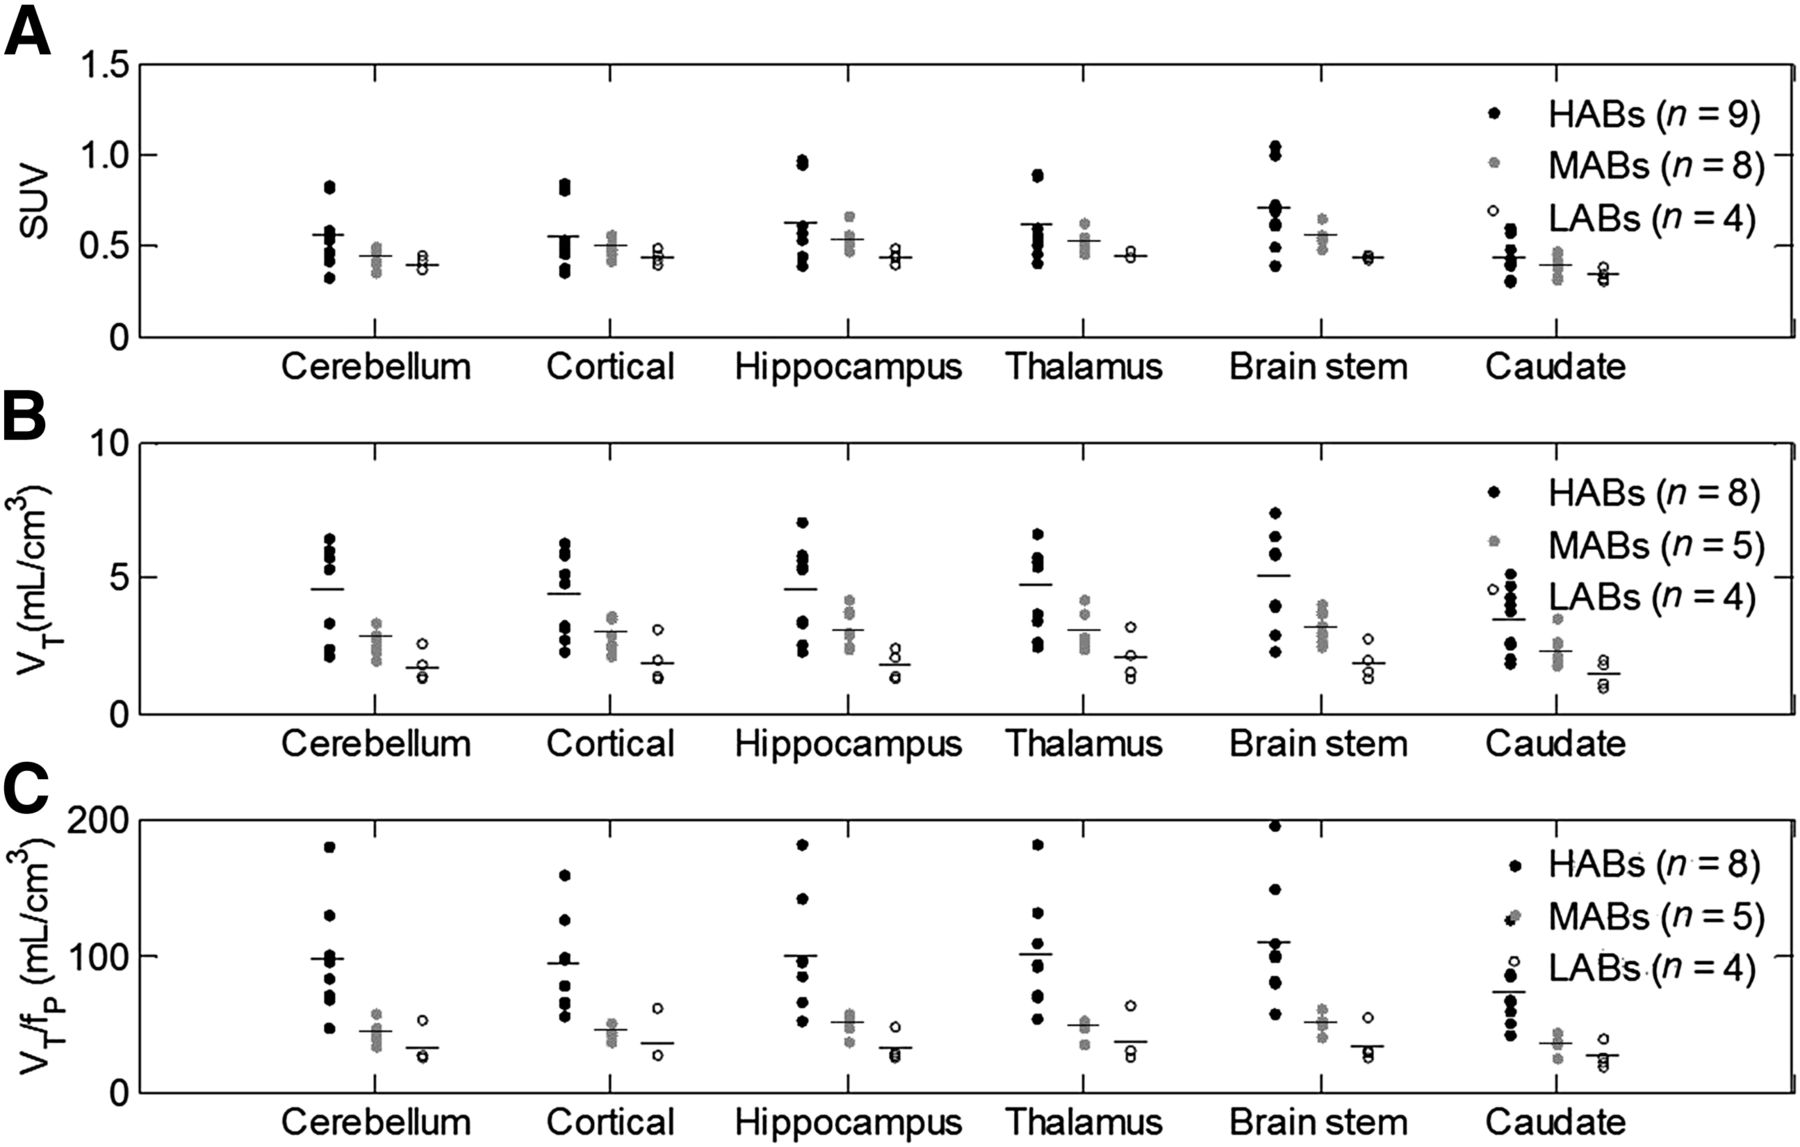
Comparison of SUV90_120 min, VT, and VT/fp values across genetic groups. Significant difference was found with VT between groups. (HABs vs. MABs: P < 0.038; HABs vs. LABs: P < 0.011; and MABs vs. LABs: P < 0.032).
An averaged spatially normalized VT parametric map for each genetic group was produced by warping each individual’s VT parametric map to the Montreal Neurological Institute space (http://www.bic.mni.mcgill.ca) and then averaging them within each group (Fig. 3). A global difference in VT was demonstrated across the different genetic groups consistent with the results from the ROI analyses.
Relationship with Age
Within each genetic group, there was still substantial variability in VT, especially in HABs. We found a significant correlation between age and VT in all ROIs for HABs and in most ROIs for MABs. The linear regression slope in HABs (slope = 0.09) was about 2-fold higher than the slope estimated for MABs (0.04) (Supplemental Table 1; supplemental materials are available at http://jnm.snmjournals.org), consistent with the expectation of increased age effects in subjects with higher specific binding (Fig. 6). Results in LABs were not included here because of the small sample size (n = 4) and limited age range (44–56 y old). When analysis of covariance was used to correct for the age effect within each binding class, the SEM in HABs was reduced by 40% (Supplemental Table 2).
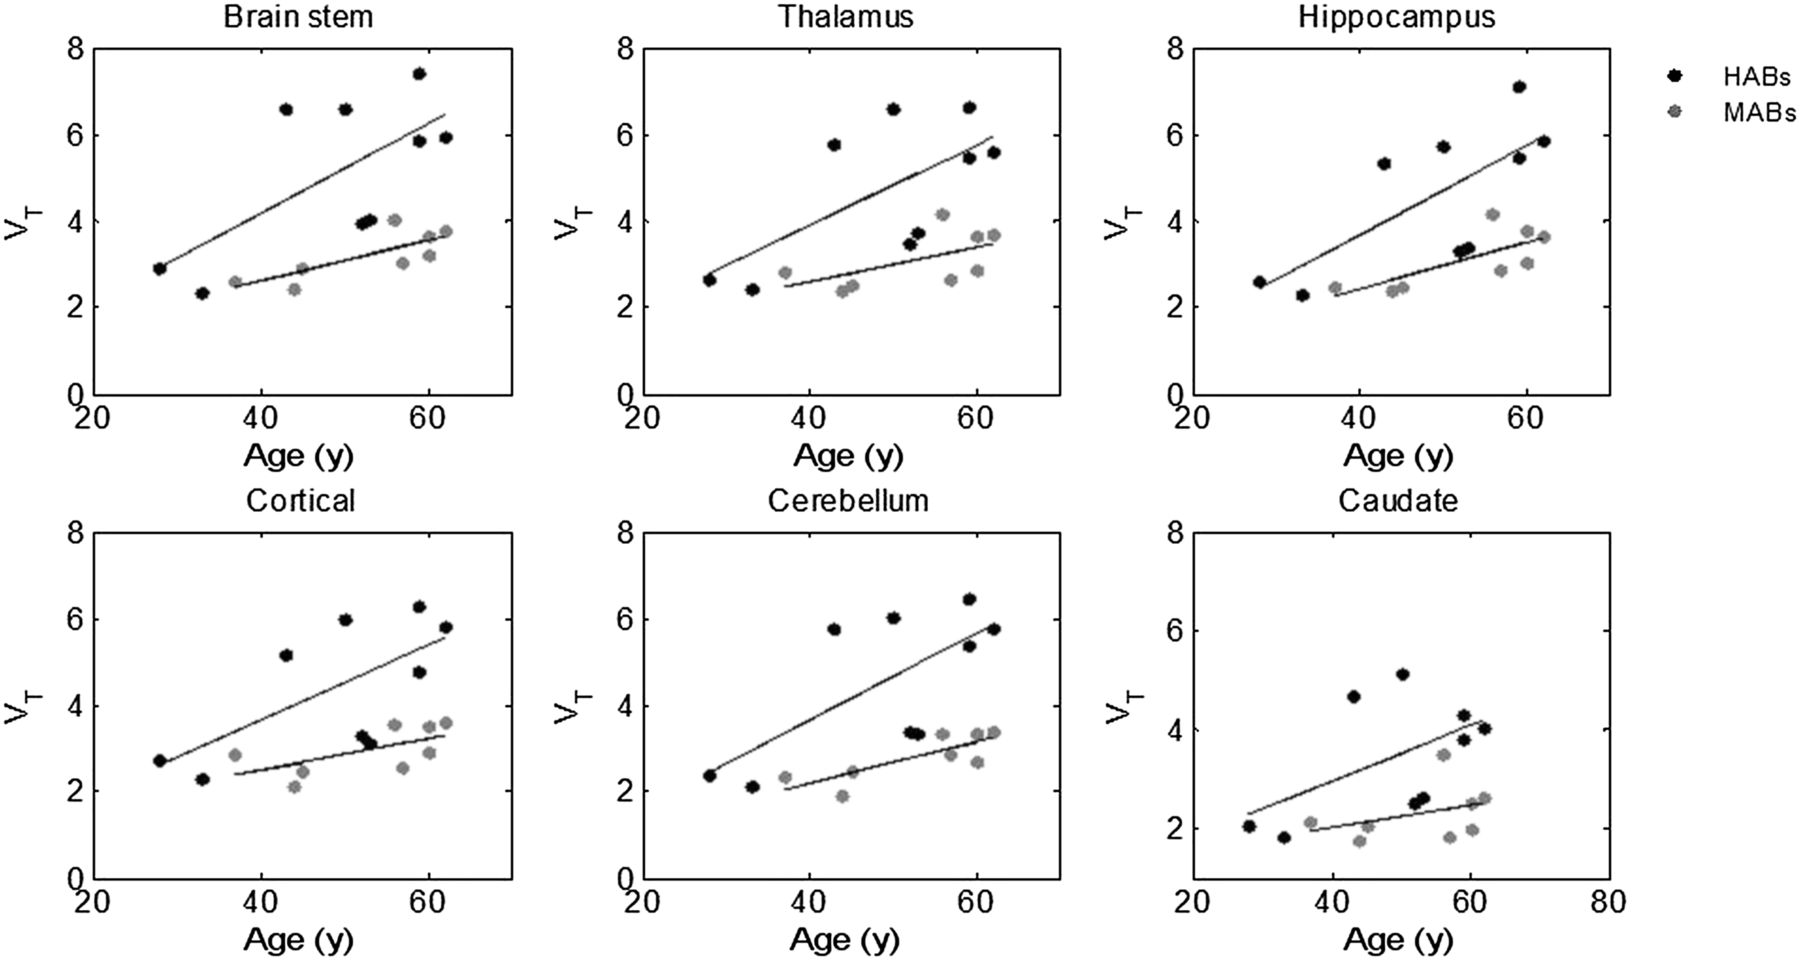
Correlation between VT and age in HABs and MABs.
Specific TSPO Binding Signal
By fitting the average VT of HABs, MABs, and LABs to Equation 3 all at once across all regions under the assumption that nonspecific binding was the same in all subjects, we estimated a VND of 0.93 (Fig. 7A). VND was also estimated by the graphical plot (method II, Eq. 4), without making any assumptions about the in vivo affinity ratio between high- and low-affinity binding sites, as the x-intercept value of 1.42 (Fig. 7B). Based on the consistency of the 2 methods, we obtained an average estimate of 1.18 for VND, which enabled calculation of 18F-PBR111 BPND in the normal human brain: 2.78 ± 0.46 in HABs, 1.48 ± 0.28 in MABs, and 0.51 ± 0.17 in LABs in the ROIs examined. Data analyses were repeated after exclusion of the 4 subjects with nonspecific findings in the white matter, and the results remained unaltered.
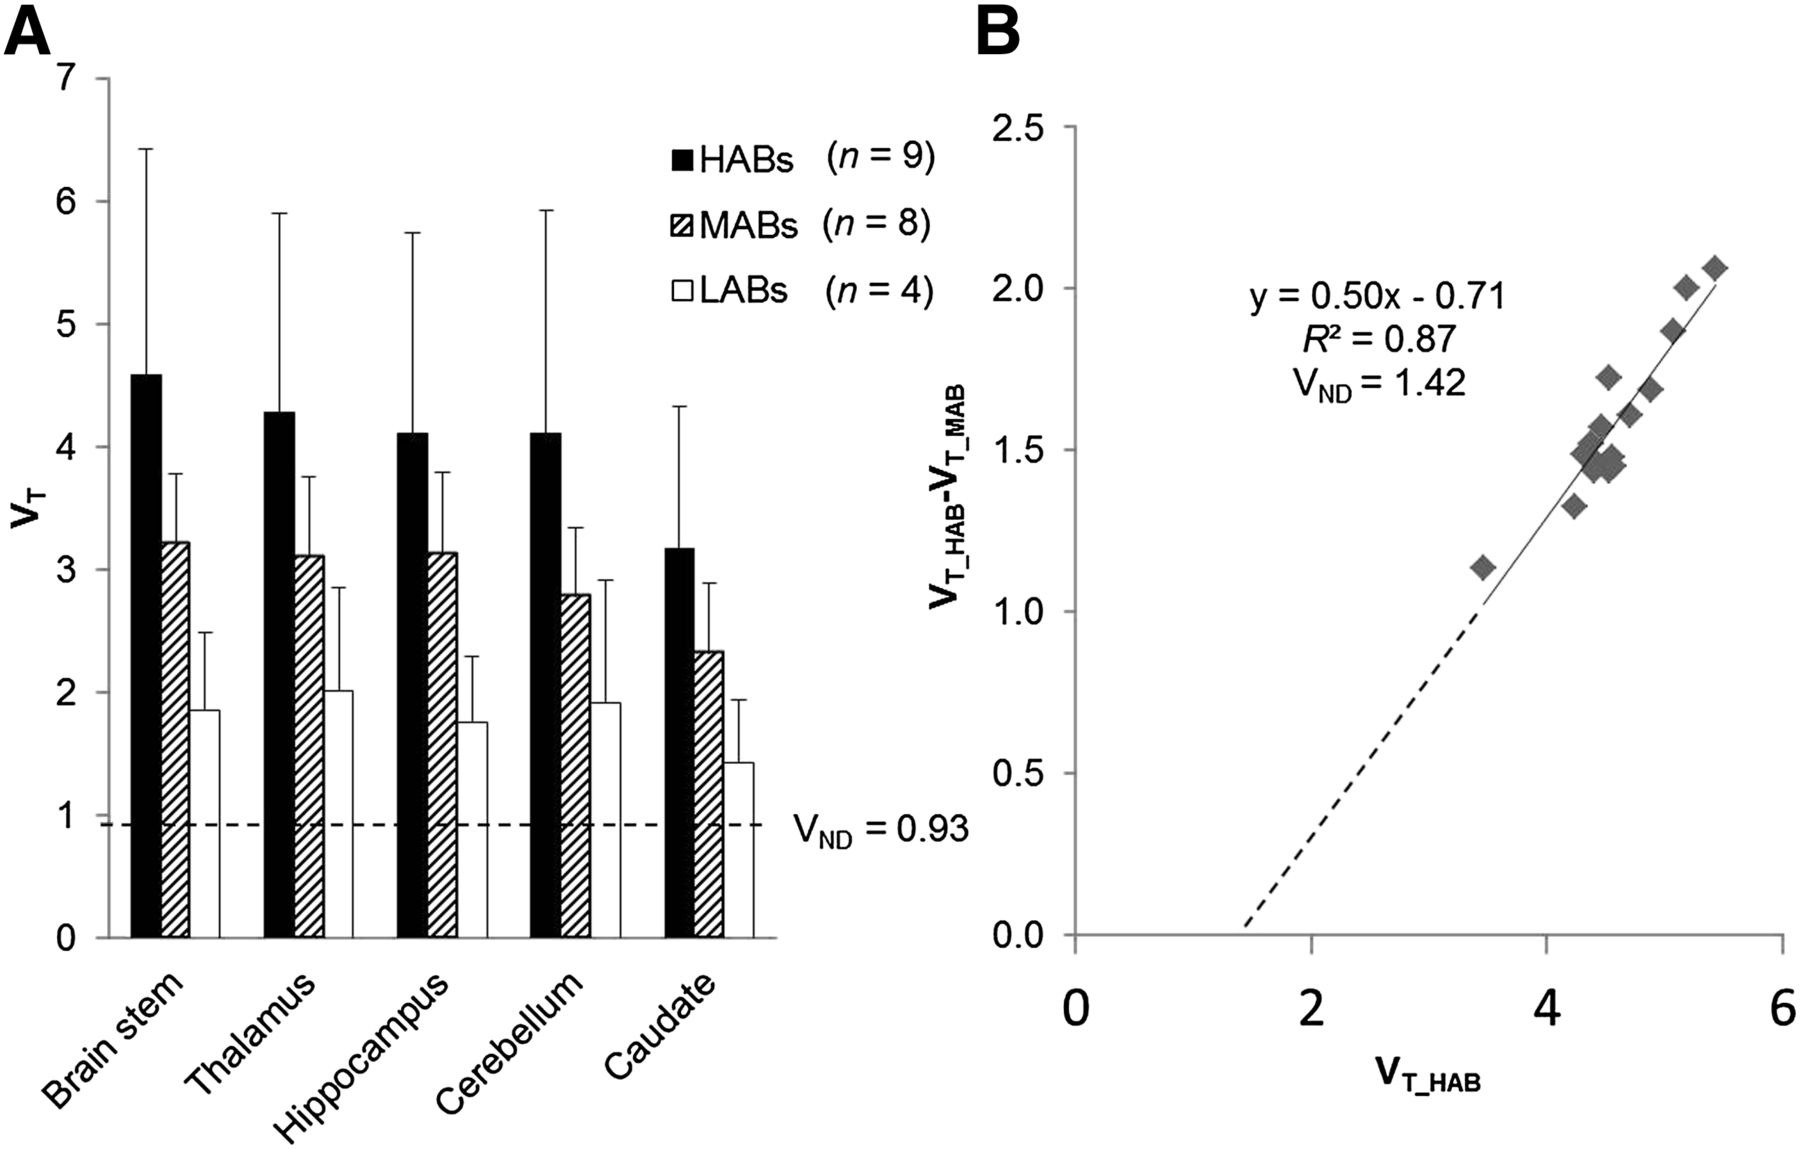
Estimation of VND and BPND of 18F-PBR111. (A) Method I, assuming in vitro affinity ratio is preserved in vivo. (B) Method II, graphical plot with x-intercept representing VND.
DISCUSSION
This paper has considered quantification of 18F-PBR111 in the healthy human brain. We previously identified a strong effect of the rs6971 polymorphism in the TSPO gene on the binding affinity of PBR111 to TSPO in human tissue in vitro (12). Here, we compared the binding of 18F-PBR111 in vivo in these genetic groups, using 3 outcome measures, namely SUV90_120 min, VT, and VT/fp. Significant differences were observed between HABs, MABs, and LABs with VT and VT/fp, which are predicted by the genetic status of the subjects. In our data, fp did not differ across genetic groups in the healthy subjects and the variability between subjects in VT was not reduced after correction for the free fraction in plasma. Therefore, VT estimated from an unconstrained 2TC model was chosen as an appropriate measure to quantify the total binding of TSPO, although the relevance of fP correction should be evaluated for individual pathologic groups. Differences in SUV90–120 min were observed between genetic groups similar to the kinetics-based analysis methods, although the differences did not reach significance. This may indicate that static scans in a clinical setting would be viable, but more samples will be required to test this possibility fully.
Within each genetic group, there was still variability in VT across subjects, especially in HABs. We found that this variability can be partly explained by a correlation between age and binding. By using analysis of covariance to correct for the effect of age, the SEM VT for HABs was reduced by 40%. Thus, age effect should be considered carefully in TSPO study design either by recruiting subjects within a narrow age range or by applying an appropriate correction for age-related changes. Although the relationship between VT and age across the full age range is unlikely to be linear, a linear regression was used as a first-order approximation. We found the slope of HABs to be about 2-fold higher than that seen for MABs, as is consistent with the previously measured affinity ratio between high- and low-specificity binding sites in vitro. We also considered the effect of the variation of injected mass on the VT values. However, no significant correlation was found between these 2 measures.
In silico models based on in vitro and nonhuman primate data predicted a significant specific binding component for 18F-PBR111 in the healthy human brain (18). To evaluate the specific binding signal directly, we developed 2 new methods to estimate the VND, with the first assuming that the in vitro affinity ratio is preserved in vivo and the second modeling the difference in the HAB and MAB signals in the context of an occupancy plot. Both methods provided a similar estimate for VND (method I: VND = 0.93, method II: VND = 1.42). An average VND value of around 1.18 implies that the in vivo affinity was similar to that measured in vivo and leads to binding potential estimates ranging from 2.03 to 3.45 in HABs, 1.03 to 1.82 in MABs, and 0.25 to 0.76 in LABs. This moderate to high specific binding signal given by the ligand across the whole brain is consistent with the ubiquitous expression of TSPO throughout the brain and demonstrates that no obvious reference region exists for 18F-PBR111.
The 2TC model fits the time–activity curves well except for a slight underestimation of the tail. This observation agrees with the interpretation of the time stability analysis that shows VT to increase with scan duration. This increase could be due to some small irreversible component, with one possibility being that radiometabolite is getting into the brain. A similar observation has been made with other second-generation TSPO tracers, such as 11C-PBR28, 11C-DPA713, and 18F-PBR06 in humans (10,24,34). Because the increase in VT of 18F-PBR111 was global, as with other tracers, the scan can likely be shortened to 60 min, allowing for a consistent underestimation of less than 20%. However, when different groups are compared, analysis should always be performed with the data from the same scan durations, and the degree of underestimation in different clinical populations needs to be evaluated.
Compared with other TSPO tracers that have been evaluated in humans, such as 11C-(R)-PK11195 and 11C-PBR28, 18F-PBR111 showed similar uptake. To demonstrate the specific binding of 18F-PBR111, we analyzed both the in silico/in vitro and the in vivo data. Previously, we successfully developed and validated a biomathematic model that predicts the in vivo performance of radiotracers directly from in silico/in vitro data, that is, molecular volume, lipophilicity, affinity, free fractions, and target density (18). Further incorporation of genetic polymorphism status allowed the model to predict that 18F-PBR111 should have higher BPND (∼0.74 and 0.44 in HABs and MABs) than 11C-(R)-PK11195 (∼0.2) properties (18). In vivo, 18F-PBR111 also demonstrated a higher BPND of about 0.51–2.78 based on the estimated VND of 1.18 as compared with the binding potential of 11C-(R)-PK11195, which has been estimated previously relative to cortical gray matter as 0.1–0.5 in healthy brains using a SuperPK method (35). Because 11C-(R)-PK11195 does not bind to TSPO with different affinities and no blocking data are available, it is not clear whether the binding potential estimated for 11C-(R)-PK11195 is biased by a specific signal in the reference regions used. However, overall, the in vivo findings are consistent with the in silico biomathematic predictions.
CONCLUSION
18F-PBR111 PET showed a measurable and quantifiable specific signal in the healthy human brain for TSPO. The intersubject variability in the PET signal for healthy volunteers can be attributed to the genetic variation at the rs6971 locus and subject age. With these effect accounted for, the ligand can be used for the quantitative assessment of TSPO expression related to neuroinflammatory processes in the brain. The 18F label provides an advantage for its use in future clinical trials, but quantification currently requires arterial input methods, which limit its use to centers with adequate infrastructure and expertise. In addition, there is an element of defluorination present, and care should be taken when regions close to bone are evaluated (e.g., cortical gray matter).
DISCLOSURE
The costs of publication of this article were defrayed in part by the payment of page charges. Therefore, and solely to indicate this fact, this article is hereby marked “advertisement” in accordance with 18 USC section 1734. This work was financially supported by grant from Medical Research Council (G0900891). No other potential conflict of interest relevant to this article was reported.
Acknowledgments
We acknowledge Yvonne Lewis, Awet Tewolde, Rahul Dimber, Michelle Cunneen, James Anscombe, and Graham Searle for collecting and analyzing data, and Andrea Thiele, Thomas Dyrks, and Ron Weiner for providing previous data on 18F-PBR111.
Footnotes
Published online Sep. 26, 2013.
- © 2013 by the Society of Nuclear Medicine and Molecular Imaging, Inc.
REFERENCES
- Received for publication February 1, 2013.
- Accepted for publication May 24, 2013.


Jump to section
Related Articles
Cited By...
- Differential mitochondrial protein interaction profile between human translocator protein and its A147T polymorphism variant
- Quantification of Macrophage-Driven Inflammation During Myocardial Infarction with 18F-LW223, a Novel TSPO Radiotracer with Binding Independent of the rs6971 Human Polymorphism
- 18F-PBR111 PET Imaging in Healthy Controls and Schizophrenia: Test-Retest Reproducibility and Quantification of Neuroinflammation
- 11C-PBR28 and 18F-PBR111 Detect White Matter Inflammatory Heterogeneity in Multiple Sclerosis
- 11C-ER176, a Radioligand for 18-kDa Translocator Protein, Has Adequate Sensitivity to Robustly Image All Three Affinity Genotypes in Human Brain
- Evidence of Brain Inflammation in Patients with Human T-Lymphotropic Virus Type 1-Associated Myelopathy (HAM): A Pilot, Multimodal Imaging Study Using 11C-PBR28 PET, MR T1-Weighted, and Diffusion-Weighted Imaging
- Imaging Microglial Activation with TSPO PET: Lighting Up Neurologic Diseases?
- TSPO: kaleidoscopic 18-kDa amid biochemical pharmacology, control and targeting of mitochondria
- Optimized Quantification of Translocator Protein Radioligand 18F-DPA-714 Uptake in the Brain of Genotyped Healthy Volunteers
- In Vivo Quantification of Cerebral Translocator Protein Binding in Humans Using 6-Chloro-2-(4'-123I-Iodophenyl)-3-(N,N-Diethyl)-Imidazo[1,2-a]Pyridine-3-Acetamide SPECT
- In Vivo Assessment of Brain White Matter Inflammation in Multiple Sclerosis with 18F-PBR111 PET