


Abstract
Activated microglia express the translocator protein (TSPO) on the outer mitochondrial membrane. 18F-PBR111 is a second-generation PET ligand that specifically binds the TSPO, allowing in vivo visualization and quantification of neuroinflammation. The aim of this study was to evaluate whether the test–retest variability of 18F-PBR111 in healthy controls is acceptable to detect a psychosis-associated neuroinflammatory signal in schizophrenia. Methods: Dynamic 90-min 18F-PBR111 scans were obtained in 17 healthy male controls (HCs) and 11 male schizophrenia patients (SPs) during a psychotic episode. Prior genotyping for the rs6917 polymorphism distinguished high-affinity binders (HABs) and mixed-affinity binders (MABs). Total volume of distribution (VT) was determined from 2-tissue-compartment modeling with vascular trapping and a metabolite-corrected plasma input function. A subgroup of HCs (n = 12; 4 HABs and 8 MABs) was scanned twice to assess absolute test–retest variability and intraclass correlation coefficients of the regional VT values. Differences in TSPO binding between HC and SP were assessed using mixed model analysis adjusting for age, genotype, and age*cohort. The effect of using different scan durations (VT-60 min versus VT-90 min) was determined based on Pearson r. Data were mean ± SD. Results: Mean absolute variability in VT ranged from 16% ± 14% (19% ± 20% HAB; 15% ± 11% MAB) in the cortical gray matter to 22% ± 15% (23% ± 15% HAB; 22% ± 16% MAB) in the hippocampus. Intraclass correlation coefficients were consistently between 0.64 and 0.82 for all tested regions. TSPO binding in SP compared with HC depended on age (cohort*age: P < 0.05) and was increased by +14% ± 4% over the regions. There was a significant effect of genotype on TSPO binding, and VT of HABs was 31% ± 8% (HC: 17% ± 5%, SP: 61% ± 14%) higher than MABs. Across all clinical groups, VT-60 min and VT-90 min were strongly correlated (r > 0.7, P < 0.0001). Conclusion: 18F-PBR111 can be used for monitoring of TSPO binding, as shown by medium test–retest variability and reliability of VT in HCs. Microglial activation is present in SPs depending on age and needs to be adjusted for genotype.
Microglia act as macrophagelike cells within the central nervous system and form the first-line defense against invading pathogens. In their resting state, microglia maintain homeostasis of local tissue environments and produce antiinflammatory and neurotrophic factors essential for sustaining neural function (1). In response to central nervous system injury, infection, or neurodegeneration, microglia change from a resting to an activated phenotype. Immune activation of microglia is associated with an upregulation of the 18-kDa translocator protein (TSPO), predominantly found on their outer mitochondrial membranes and formerly known as the peripheral benzodiazepine receptor (PBR). High densities of the TSPO are expressed in various neurologic and psychiatric disorders (2).
PET with radioligands targeting the TSPO can detect patterns of neuroinflammation in vivo. Monitoring activated microglia is of great interest to assess disease severity and progression (3) as well as therapeutic efficacy of antiinflammatory drugs. Several recent lines of evidence support that neuroinflammation plays an important role in schizophrenia (4,5). For the past decades, the first-generation radiotracer 11C-PK11195 has been widely used as a biomarker but suffered from low brain extraction and thus poor signal-to-noise ratio (6–8). In recent years, several second-generation TSPO tracers were applied such as 11C-PBR28 (9,10), 11C-DPA713 (11), 18F-FEPPA (12,13), and 11C-DAA1106 (14); however, these yielded inconsistent results. This was most likely due to the use of various TSPO tracers, patient heterogeneity, methodologic considerations, and the contribution of distinct TSPO mechanisms to the total PET signal (e.g., impaired cell metabolism, microglia, astrocytes, transcriptional events) (15). Another source of bias may arise from tracer binding to the vascular wall (i.e., endothelium and smooth muscle cells of the tunica medium). In this respect, Rizzo et al. (16) recently proposed a pharmacokinetic model with a vascular trapping compartment. An additional complicating factor for second-generation radioligands is their susceptibility to the rs6971 polymorphism, responsible for differences in binding affinity (17). Hence prior genotyping of the target subjects into low-affinity binders, high-affinity binders (HABs), or mixed-affinity binders (MAB) became required.
In the present study, we examined whether test–retest variability of TSPO binding with 18F-PBR111 in genotyped healthy controls enables detection of a disease-related signal in genotyped schizophrenia patients with a psychotic episode. The radiometabolic profile of 18F-PBR111 as well as the inclusion of a vascular trapping component in the pharmacokinetic compartment model were investigated based on dynamic PET data with arterial sampling. Minimal scan duration needed for stable binding measures was determined as well.
MATERIALS AND METHODS
Subjects
Thirty-one male subjects (age, 30 ± 7 y) were enrolled in the study, including 14 patients with schizophrenia during a psychotic episode and 17 healthy controls. Healthy controls underwent a 90-min dynamic 18F-PBR111 PET scan at 2 separate occasions (test–retest), 23 ± 10 wk apart and at the same time of day. Patients were dynamically scanned at 2 occasions (i.e., during a psychotic episode and in remission); however, the present study reports only data from the psychotic episode. All subjects underwent structural MRI within 6 mo after PET. Prior genotyping of subjects for the rs6971 polymorphism within the TSPO gene distinguished HABs and MABs, whereas low-affinity binders were excluded. The demographics are summarized in Table 1. In the healthy control (HC) group, the test or retest data of 5 subjects had to be excluded because of technical issues during elaborate radiometabolite analysis (n = 3) or head movement artifacts during 90-min PET imaging (n = 2), leaving 12 HCs (4 HABs and 8 MABs) for test–retest analysis. In the schizophrenia patient (SP) group, 3 patients had to be excluded because of technical issues during the first 5 min of continuous arterial blood sampling (n = 1) or head movement artifacts during 90-min PET imaging (n = 2), leaving 11 SPs (6 HABs and 5 MABs) for analysis. PET scans were considered as motion-affected if the coregistration between CT and at least 2 subsequent motion-corrected PET frames showed significant mismatch (>1 mm translation), resulting in atypical increases or decreases of the time–activity curve during the equilibrium phase.
Age, Injection Parameters, and Scan Interval Stratified by Genetic Groups, Including All Subjects
Unmedicated patients with schizophrenia (DSM-5 (18) #295.4–9, 298.8–9; aged 18–50 y inclusive) were admitted to the University Psychiatric Hospital Campus Duffel and the Psychiatric Hospital Multiversum (campus Boechout and Mortsel) with a psychotic episode (first-episode psychosis or acute relapse), as defined by a total score of 14 or greater on the positive scale of the Positive and Negative Syndrome Scale (PANSS) interview combined with a score of at least 5 on 1 item or a score of 4 on 2 of the “psychotic” PANSS items P2, P3, P5, or G9. Antipsychotic therapy was initiated on admission based on clinical needs, but no use of benzodiazepines was allowed for 3 times their half-life before PET scanning (8). Main exclusion criteria were the use of nonsteroidal antiinflammatory drugs, paracetamol, systemic corticosteroids, or immunosuppressant or immunostimulating drugs within 21 d of participation; a personal history of autoimmune disorders or other chronic or acute physical illness associated with abnormal immune changes within 2 wk before the study; positive test for abuse of drugs or alcohol at screening, except cannabis; and a score of more than 6 on the Calgary Depression Scale for Schizophrenia. The cohort of healthy controls was recruited among hospital staff, university students, relatives, and colleagues within the same area. They had no personal or family history of psychotic or bipolar disorders.
Approval for the study was obtained from the Committee for Medical Ethics of the University Hospital Antwerp (13/37/348; CT.gov no. NCT02009826) and of all participating hospitals (GGZ Broeders van Liefde; vzw Emmaüs). All participants provided informed consent.
Data Acquisition
A 3-dimensional T1-weighted magnetization-prepared rapid gradient echo scan was obtained on a Siemens Magnetom Aera 1.5T MRI scanner with 1-mm isotropic voxels. PET data were acquired using a Siemens Biograph mCT time-of-flight PET scanner and recorded over 90 min after an intravenous bolus injection of 192 ± 19 MBq with a specific radioactivity of 91 ± 31 GBq/μmol. The images were reconstructed using a 3-dimensional iterative algorithm (TrueX ultraHD-PET), with 4 iterations and 24 subsets, into 26 frames (8 × 15, 3 × 60, 5 × 120, 5 × 300, 5 × 600 s) followed by a gaussian filter of 2 mm in full width at half maximum on a 200 × 200 × 74 mm matrix with a 2 × 2 × 3 mm voxel size.
Simultaneously with the dynamic 18F-PBR111 PET acquisition, continuous arterial blood sampling was performed by a coincidence detector system (Twilite; Swisstrace) to measure radioactivity in the blood. Additionally, arterial blood samples (3 mL each) were manually collected at 5, 10, 15, 20, 25, 30, 40, 50, 60, 70, 80, and 90 min after injection and centrifuged for 5 min at 4°C (4,500g) to collect the plasma. Total radioactivity in the whole blood and plasma samples (300 μL each) was measured in a cross-calibrated automated γ-counter (Wizard2 2480; Perkin Elmer). Next, the plasma (100 μL) was mixed with 200 μL of water, 10 μL of natrium fluoride (NaF, 1 mg/mL), and 10 μL of nonradioactive PBR111 reference standard (0.5 mg/mL) and loaded onto an Oasis HLB Sep-Pak cartridge (Waters Corp.) conditioned with methanol (1 mL) and water (5 mL). Sequentially, the cartridge was washed with water (1 mL), acetonitrile (ACN)/water (20/80, 1 mL), and acetonitrile (1 mL) for elution of the polar radiometabolites, semiapolar radiometabolites, and intact 18F-PBR111, respectively. All fractions were collected into separate counting tubes. The radioactivity of each fraction was measured with the γ-counter.
Data Analysis
Automatic brain segmentation of the anatomic MR images was performed using PMOD (version 3.6; PMOD Technologies Ltd.) for each subject. Delineated regions of interest included the cortical lobes and cingulate cortex (cortical gray matter [GM]), whole white matter (cortical WM), cerebellum, brain stem, thalamus, basal ganglia, amygdala, and hippocampus. Interframe motion correction of all dynamic PET images was performed via normalized mutual information registration with mid frames (5–15 min) as a reference. The motion-corrected 18F-PBR111 data were coregistered onto the MR images to extract regional time–activity curves. Region-based partial-volume correction using a gaussian kernel with a full width at half maximum of 5.1 × 5.1 × 5.1 mm was performed to correct the regional time–activity curves (19).
The time-course of the whole-blood activity was created from a 3-exponential fit to the first 5 min of the calibrated whole-blood activity concentration as continuously recorded by the Twilite, whereas the remaining part of the curve was estimated by interpolating the 12 discrete blood measurements. The blood function was then multiplied by a linear fit to the plasma–to–whole-blood ratio time course and a Watabe fit to the parent fraction time course to derive the metabolite-corrected plasma input function. All blood data processing was performed in PMOD, version 3.6.
Pharmacokinetic Analysis
For pharmacokinetic model selection, both the 2-tissue compartment model (2TCM) and the 2TCM with an additional irreversible vascular trapping component (2TCM-1K) were applied to the dynamic data (16). A delay between the coincidence detector system and the PET measurements was estimated from a coupled fit across the cerebral lobes. Additional regional fit parameters included a blood volume fraction and an endothelial binding rate constant (Kb, 1/min) for the 2TCM-1K. The fitting weights of the individual data points were set to the inverse of the variance of the PET measurement error. Total volume of distribution VT was determined from the model fit for each region (VT = K1/k2[1 + k3/k4], with K1 [mL/min/mL] and k2 [1/min] the tracer transport rates from plasma to tissue and back, and k3 [1/min] and k4 [1/min] the tracer transport rates from the nondisplaceable to the specific binding compartment and back, respectively).
Time Stability
To investigate the minimal scan duration required for reproducible 18F-PBR111 binding outcomes, VT was calculated in a subgroup of 10 HCs from 0–40 min to 0–90 min, with 10-min increments. The Pearson correlation coefficient r was calculated to examine the relationship between regional VT-90 min and VT-60 min across all subjects.
Voxel-Wise Analysis
Voxelwise estimates of VT were derived with a spectral analysis iterative filter (SAIF) implemented in PMOD (version 3.8) (20). To validate the use of SAIF for voxelwise modeling, regions of interest were applied to the parametric VT images, and regional means were correlated with the regionwise VT estimates from 2TCM-1K (uncorrected).
Statistical Analysis
Differences in the time evolution of parent and metabolite fractions, plasma-to-blood ratios, and input functions between the clinical groups were investigated using linear mixed models in JMP Pro (version 12; SAS Institute Inc., USA).
The absolute test–retest variability of regional 18F-PBR111 uptake in HCs was calculated as the absolute difference in regional VT between their first and second scan, relative to the mean of the 2 values (i.e., test/retest (%) = 100 × absolute {(VT-scan1 – VT-scan2)/(0.5(VT-scan1+VT-scan2))}. The between-subject variability was expressed using the coefficient of variation. A 2-way mixed-model reliability analysis for absolute agreement was performed in JMP for calculation of the intraclass correlation coefficient (ICC). Genotype, length of test–retest scan interval, and specific tracer activity were entered as fixed effects in the model to estimate their effect on the reproducibility of test–retest results.
A linear mixed-model analysis, with regional VT values as the dependent variables, cohort and genotype as fixed factors, age as a covariate, and subject number as random effect, was performed in JMP for each region separately. Interaction effects (cohort*age, cohort*genotype, age*genotype) were evaluated as well. All data was presented as mean ± SD, unless otherwise stated.
RESULTS
Subjects
Injection parameters were similar between test and retest scans (P = 0.25, paired Student t test), and between MABs and HABs as well as HC and SP (P > 0.05, unpaired Student t test) (Table 1).
Metabolism of 18F-PBR111
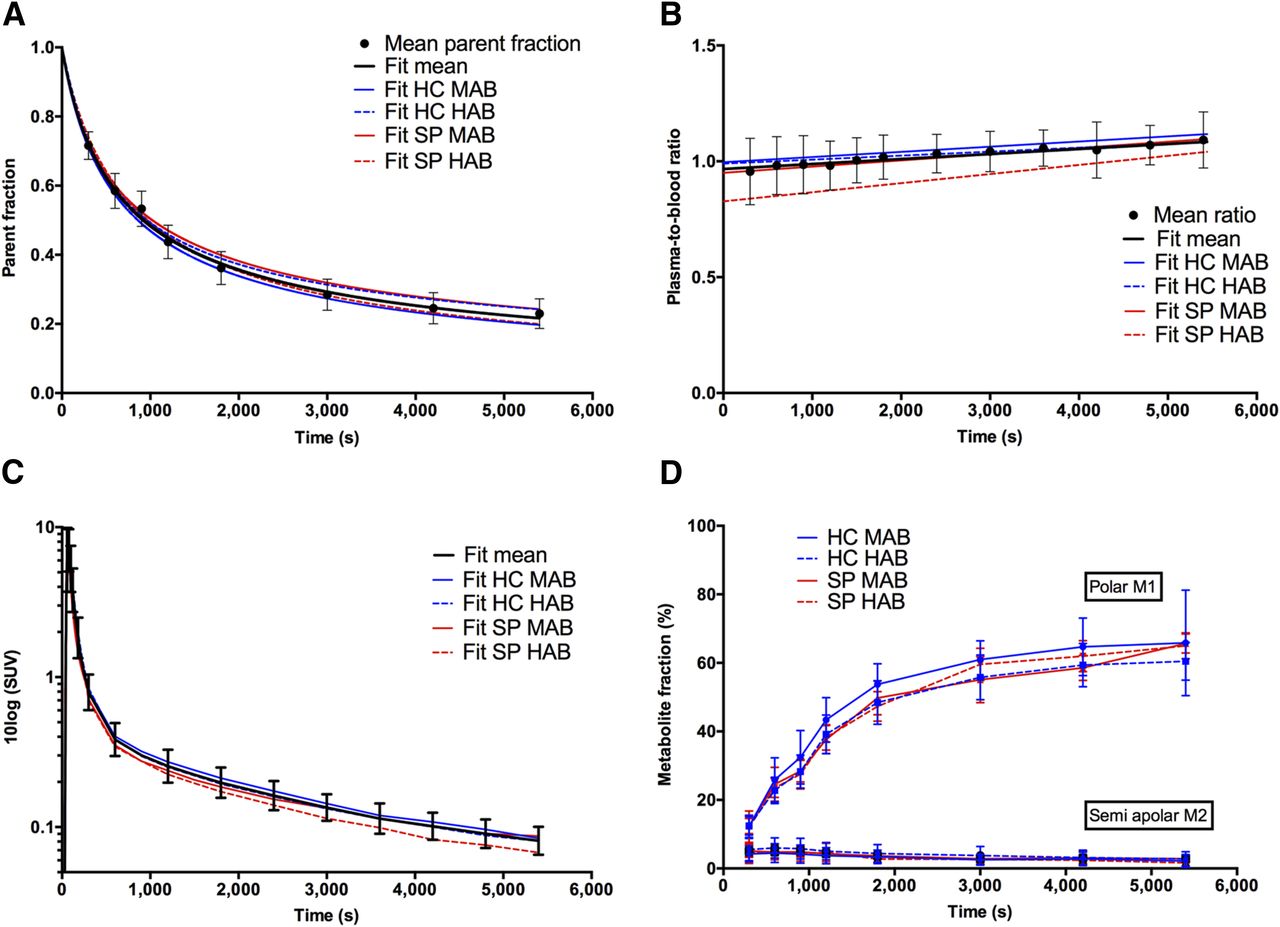
18F-PBR111 showed fast metabolism in arterial plasma, with 36% ± 5% of parent remaining at 30 min and 23% ± 4% at 90 min after injection (Fig. 1A). The time course of the plasma–to–whole-blood ratio showed a linear increase and was significantly lower in SP compared with HC (P = 0.01; Fig. 1B). Post hoc Tukey’s honestly significant difference testing for multiple comparisons revealed that the time course in SP HAB was significantly lower than HC MAB (P = 0.020) and HC HAB (P = 0.047), and that SP MAB was lower than HC MAB (P = 0.047). The cohort*time interaction revealed that there was a significantly steeper increase in SP than HC (P = 0.003). The resulting metabolite-corrected plasma input functions are depicted in Figure 1C. Shortly after parent administration, polar and (to a lesser extent) semiapolar radiometabolites appeared in the plasma (Fig. 1D).

(A) Amount of unchanged 18F-PBR111 (i.e., mean parent fraction ± SD, solid circles) at different time points after injection for all subjects investigated; black solid line represents Watabe curve fit. Colored lines represent Watabe curve fits to group-averaged parent fractions. (B) Plasma–to–whole-blood ratios fitted with linear function. (C) Metabolite-corrected plasma input functions. (D) Plasma metabolite fractions. M1 and M2 = radiometabolite 1 and 2, respectively.
Pharmacokinetic Analysis
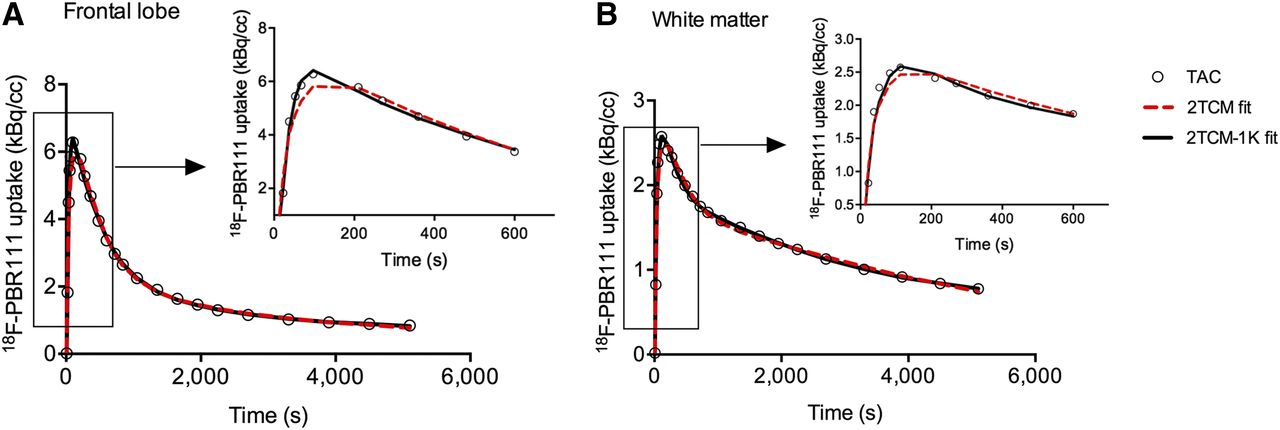
Regional time–activity curves for the frontal lobe, hippocampus, and cortical WM are shown in Supplemental Figure 1 (supplemental materials are available at http://jnm.snmjournals.org). All brain regions required the 2TCM-1K to adequately describe the time–activity curves, as reflected by the lowest Akaike information criteria scores (140 ± 9) and the improved fits to the initial parts of the time–activity curves (Fig. 2). Significantly higher Akaike information criteria scores were recorded for the 2TCM fits across all regions (159 ± 10, P < 0.01 via 2-way ANOVA for each region and model with Sidak’s multiple-comparisons test), although these were not significantly higher in the hippocampus (P = 0.8). The 2TCM consistently overestimated VT compared with those from the 2TCM-1K (+63% ± 30%). Nevertheless, there was moderate to strong correlation (Pearson r: 0.60–0.93, P < 0.01) between both VT estimates (Supplemental Table 1). Blood volume fraction in tissue was significantly different between the 2 kinetic models (P ≤ 0.01) and was 0.08 ± 0.02 for 2TCM and 0.06 ± 0.02 for 2TCM-1K. The endothelial binding rate constant Kb from the 2TCM-1K was significantly increased in SP HAB compared with the other groups in all regions (except amygdala, hippocampus, and thalamus), and ranged from 0.17 ± 0.22 in the amygdala to 0.49 ± 0.19 in cortical WM.

Example of model fits (2TCM: red dotted line; 2TCM-1K: black solid line) to measured time–activity curves (circles) of frontal cortex (A) and cortical WM (B) for representative MAB subject. Zoom of initial phase of time–activity curve (0–10 min) is presented, highlighting improved fit by 2TCM-1K.
Time Stability Analysis
In the larger cortical GM regions, percentage normalized VT (i.e., VT/VT-90 min) plateaued between 60 and 90 min and decreased for scan lengths shorter than 60 min (Supplemental Fig. 2). Truncating the scan data from 0–90 to 0–40 min consistently increased the SE. Correlation analysis including all subjects showed that VT-60 min was similar to VT-90 min in all brain areas (Pearson r ranging from 0.68 in the hippocampus to 0.99 in cortical GM, P < 0.0001). The difference in VT-60 min compared with VT-90 min was highest in the cortical WM (-11% ± 9%) and hippocampus (-5% ± 21%), whereas for all other brain regions the difference ranged between −0.3% ± 3% (cortical GM) and −4% ± 10% (brain stem).
Test–Retest Variability and Reliability in HCs
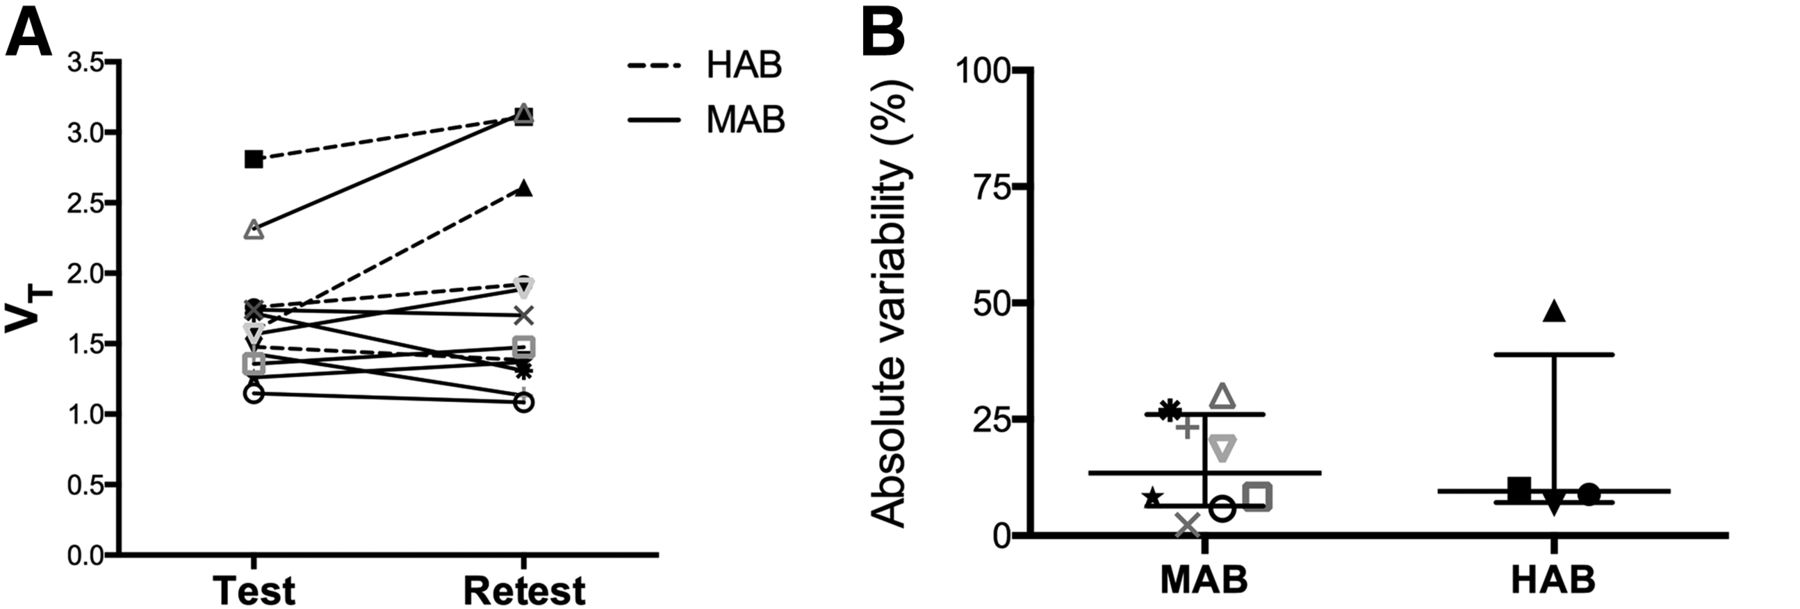
Cortical GM VT and absolute test–retest variability are presented in Figure 3 for both binding affinities. VT did not significantly differ between the test and retest scans (Table 2). The absolute test–retest variability was similar across brain regions and ranged from 16% ± 14% (19% ± 20% HAB; 15% ± 11% MAB) in the cortical GM to 22% ± 15% (23% ± 15% HAB; 22% ± 16% MAB) in the hippocampus (Table 2). The ICC values were moderate to strong across all regions and ranged from 0.64 in cortical WM to 0.82 in the amygdala (Table 2). There was no significant effect of binding affinity, length of test–retest scan interval, or specific activity of the tracer on reproducibility of VT.

VT values (A) and absolute test–retest variability (B) in cortical GM of HCs with different binding affinity.
Mean (±SD) Regional VT, Coefficient of Variation, Absolute Test–Retest Variability (±SD), and ICC in HCs
Patients with Schizophrenia versus HCs
There was a statistically significant interaction between the effects of cohort and age on VT for all regions (ranging from F(1,35) = 4.53, P = 0.043 in WM to F(1,35) = 9.80, P = 0.005 in amygdala) (Table 3). The effect of genotype was significant in most of the brain regions (Table 3), and the unadjusted VT of HABs was 31% ± 8% (HC: 17% ± 5%, SP: 61% ± 14%) higher than MABs over the different regions. The average increase in tracer uptake in SP compared with HC adjusted for the other variables in the model ranged from +7% in the cortical WM to +19.6% in the hippocampus (Table 3). Post hoc Tukey’s honestly significant difference testing for multiple comparisons, adjusted for age effects, revealed that there was a trend of significant increase in SP HAB compared with HC MAB (+55.4% [P = 0.06] in the hippocampus, +64.8% [P = 0.07] in the amygdala and +55.3% [P = 0.08] in the brain stem; +49% ± 4% over all regions); differences in uptake between the other groups were nonsignificant (Fig. 4). Group-averaged parametric maps of (not age-adjusted) VT are presented in Figure 5, confirming our regional-based results. There was significant correlation between VT of the 2TCM-1K and SAIF graphical analysis (r = 0.86 for hippocampus, r > 0.97 for other regions, P < 0.0001), and SAIF represented a constant overestimation by +7% ± 2% over the regions.
Regional VT in HC and SP

Regional VT ± SE in HC MAB (n = 18), HC HAB (n = 11), SP MAB (n = 5), and SP HAB (n = 6). HC values include test and retest scans, when available. No significant effects were detected across groups (post hoc Tukey’s honestly significant difference test, adjusted for age effects [mean age: 28.58 y]).

Group-averaged spatially normalized 18F-PBR111 VT images (not age-adjusted) obtained via SAIF graphical analysis for clinical groups.
DISCUSSION
Metabolite analysis revealed that 18F-PBR111 rapidly decreased over time with formation of both polar and semiapolar radiometabolites in the arterial plasma. The polar radiometabolite has been identified previously as 18F-fluoropropionic acid (21). According to other studies, none of the radiometabolites entered the brain within 60 min after injection (21,22). Parent and metabolite profiles did not vary across the clinical groups. The plasma–to–whole-blood ratio was significantly lower in SP than HC and showed faster increase over time. These results might be related to a potential higher expression of TSPO on blood cells (23) and faster redistribution of intact tracer and its radiometabolites to the plasma in SP.
Pharmacokinetic analysis showed that the 18F-PBR111 kinetics could be best described by 2TCM-1K. Voxelwise quantification using SAIF confirmed the presence of vascular trapping (20). A previous study on 18F-PBR111 quantification in healthy humans by Guo et al. (17) reported an underestimation of the tail of the regional time–activity curves by 2TCM, which they attributed to either radiometabolites slowly entering the brain or binding of TSPO to endothelial cells. It appears from our study that 2TCM-1K significantly improved the fits to the initial phase of the time–activity curve while weighting already accounted for the tail data points, in line with recent TSPO PET studies (9,16). Rizzo et al. (16), however, reported a poor correlation with VT estimates from 2TCM, as opposed to the relatively strong correlations we found. With regard to reproducibility, VT from 2TCM showed comparable test–retest variability to 2TCM-1K but markedly lower reliability, that is, lower ICCs (data not shown). Validation of the 2TCM-1K model and evidence of endothelial TSPO is further supported by high correlations between Kb and TSPO messenger RNA expression (16,24), as well as by a recent pharmacologic blocking study (25) reporting that TSPO positive vessels accounted for 30% of the vascular network in cortical and white matter.
Future 18F-PBR111 studies may reduce scan duration to 60 min. However, caution is warranted in the cortical WM, hippocampus, and brain stem, as, respectively 60%, 50%, and 30% of subjects (n = 40) showed more than 10% variation compared with VT-90 min. The study by Guo et al. (17) demonstrated that regional VT continued to increase for scan durations up to 120 min, resulting in 10%–20% underestimation of VT-60 min compared with VT-120 min. Discrepancies from our study are likely of a methodologic nature, as we applied 2TCM-1K instead of 2TCM and assigned increased weights to the tail data points of the time–activity curves.
18F-PBR111 can be used for monitoring of TSPO binding in both large and small brain regions, as shown by medium test–retest variability (16%–22%) and reliability (ICC: 0.64–0.82) of VT in HCs compared with other TSPO tracers. The 18F-PBR111 binding reproducibility in cortical GM versus 11C-PBR28 was similar (variability: 16% ± 14% vs. 18 ± 13%; ICC: 0.76 vs. 0.92) and outperformed 11C-PBR28 in cortical WM (variability: 20% ± 8% vs. 48% ± 40%; ICC: 0.64 vs. 0.32) (26). Regional test–retest variability did not differ between HABs and MABs. In comparison to first-generation radioligands including 11C-(R)-PK11195 (ICC ranging from negative to 0.57, BPND variability up to 33% (27)), markedly better ICCs as well as lower absolute test–retest variability in the small regions were found.
In SP compared with HC, VT was elevated in cortical gray matter regions and to a lesser extent in white matter regions, for which the difference between both diagnostic groups increased with age. Moreover, a substantial effect of genotype was detected especially in the SP group. However, the age-adjusted (mean age: 28.58 y) increase in SP HAB did not reach the level of significance. Future studies should consider the test–retest reliability (measured as on average 0.75 in our study) as an a priori when calculating sample sizes, to compensate for the loss of power related to decreased reliability (28). For instance, in case one wishes to longitudinally monitor disease progression or treatment effects, the actual statistical power for paired-sample dependent t tests at 2-tailed α = 0.05 for a large effect size (d = 0.8) with a sample size of 15 decreases from 0.82 to 0.61 when reliability is lowered to 0.75. Similarly, whereas sample sizes in our study are in line with those in previous PET studies using the second-generation radiotracers and adjusting for genotype (9,11,12), effect sizes are most likely underestimated because of the decreased reliability, and it is likely that the number of SP HAB patients was therefore too small to reach significant differences at group level. This problem, together with various TSPO tracers and methodologic differences, most likely underlies the inconsistent results across TSPO PET studies in schizophrenia, reporting both increased (7–9) and decreased (10,29) as well as unchanged (11–14) TSPO levels compared with controls. Finally, as a heterogeneous disease, variable patient cohorts in terms of clinical determinants such as symptom severity, duration of illness, and the effects of antipsychotic treatment represent another major cause of variability (15).
CONCLUSION
18F-PBR111 VT can be used for monitoring of TSPO binding if one considers its medium test–retest variability while compensating for the reduced reliability by increasing the sample size. In this way, regional and whole-brain microglial activation can be detected in SPs during a psychotic episode depending on age and after adjustment for genotype. Finally, we have shown that a kinetic model accounting for endothelial TSPO binding improves the quantification of 18F-PBR111 PET data.
DISCLOSURE
Financial support for this study was provided in part by IWT Flanders and Janssen Research and Development, a division of Janssen Pharmaceutica N.V. No other potential conflict of interest relevant to this article was reported.
Acknowledgments
We are thankful to Caroline Berghmans, Annemie Van Eetveldt, Philippe Joye, and Marleen Cauchie for support with the processing of blood samples and PET acquisitions. We are additionally thankful to Andrew Katsifis for useful discussions on the metabolite assay, and to Ella Roelant for statistical assistance.
Footnotes
Published online Jan. 11, 2018.
- © 2018 by the Society of Nuclear Medicine and Molecular Imaging.
REFERENCES
- Received for publication October 5, 2017.
- Accepted for publication December 13, 2017.


Jump to section
Related Articles
Cited By...
- No citing articles found.