


Abstract
HTLV-1–associated myelopathy (HAM; HTLV-1 is human T-lymphotropic virus type 1) is a chronic debilitating neuroinflammatory disease with a predilection for the thoracic cord. Tissue damage is attributed to the cellular immune response to HTLV-1–infected lymphocytes. The brains of HTLV-1–infected patients, with and without HAM but no clinical evidence of brain involvement, were examined using a specific 18-kDa translocator protein ligand, 11C-PBR28, and T1-weighted and diffusion-weighted MRI. Methods: Five subjects with HAM and 2 HTLV-1 asymptomatic carriers were studied. All underwent clinical neurologic assessment including cognitive function and objective measures of gait, quantification of HTLV-1 proviral load in peripheral blood mononuclear cells, and human leukocyte antigen–antigen D related expression on circulating CD8+ lymphocytes. 11C-PBR28 PET and MRI were performed on the same day. 11C-PBR28 PET total volume of distribution and distribution volume ratio (DVR) were estimated using 2-tissue-compartment modeling. MRI data were processed using tools from the FMRIB Software Library to estimate mean diffusivity (MD) and gray matter (GM) fraction changes. The results were compared with data from age-matched healthy volunteers. Results: Across the whole brain, the total volume of distribution for the subjects with HAM (5.44 ± 0.84) was significantly greater than that of asymptomatic carriers (3.44 ± 0.80). The DVR of the thalamus in patients with severe and moderate HAM was higher than that in the healthy volunteers, suggesting increased translocator protein binding (z > 4.72). Subjects with more severe myelopathy and with high DR expression on CD8+ lymphocytes had increased DVR and MD (near-significant correlation found for the right thalamus MD: P = 0.06). On the T1-weighted MRI scans, the GM fraction of the brain stem was reduced in all HTLV-1–infected patients compared with controls (P < 0.001), whereas the thalamus GM fraction was decreased in patients with HAM and correlated with the disease severity. There was no correlation between neurocognitive function and these markers of central nervous system inflammation. Conclusion: This pilot study suggests that some patients with HAM have asymptomatic inflammation in the brain, which can be detected and monitored by 11C-PBR28 PET together with structural and diffusion-weighted MRI.
The human T-lymphotropic virus type 1 (HTLV-1) is an exogenous human retrovirus that infects at least 10 million people worldwide (1). HTLV-1 is the etiologic agent of a progressive neurologic disease, HTLV-1–associated myelopathy (HAM) (2). HAM overtly affects 2%–4% of HTLV-1–infected persons at some point during this life-long infection (3,4), while subclinical disease is also reported (5). HAM is characterized clinically by several or all of the following: progressive spastic paraparesis, lumbar pain frequently radiating to legs, urinary symptoms, constipation, and impotence (6). The neuroinflammation has a predilection for the thoracic cord, but cases of generalized encephalitis and subtler neurocognitive change have been reported (7).
Neuroinflammation causes elevated expression of the 18-kDa translocator protein (TSPO), formerly known as the peripheral benzodiazepine receptor (PBR), within macrophages and microglia. TSPO has been used as a PET target for investigation of disease involving microglial activation or macrophage recruitment. Recently, second-generation tracers have been developed to target TSPO (8,9). Human tissue binds to these tracers with either high affinity, low affinity, or a mixture of the 2, determined by the rs6971 polymorphism in the TSPO gene (10). 11C-PBR28, a second-generation tracer with promising characteristics, has been investigated as a marker of neuroinflammation in diseases such as cerebral infarction, multiple sclerosis, Alzheimer disease, and depression (11–14). MR diffusion-weighted imaging (DWI) can provide a measure of tissue integrity, being able to detect change in tissue that appears normal on conventional MR imaging.
We hypothesized that evidence of inflammation in the brain of patients with HTLV-1 could be detected by these imaging modalities, despite the absence of overt clinical abnormality above the spinal cord.
MATERIALS AND METHODS
The study was conducted at St Mary’s Hospital, London, and Imanova Centre for Imaging Sciences, London. The study was approved by the National Research Ethics Service (reference 11/SC/0130) and the Administration of Radioactive Substances Advisory Committee, and all subjects gave written informed consent. Seven HTLV-1–infected subjects, 5 with HAM and 2 asymptomatic carriers (ACs) and all determined to be high-affinity binders, participated. All underwent a T1-weighted (T1w) MR scan, MR DWI, and a 11C-PBR28 PET scan. Data for 1 subject with HAM (subject 3) were not evaluable because of intolerance of the scanning process, and 1 subject (subject 1) managed only the first 55 of the intended 90-min PET data acquisition (Table 1). Both subjects remained in the study, completing all other evaluations.
Demographics, Neurology, HTLV-1 Virology, and Immunology
Structural MR images were inspected for unexpected findings of clinical significance or features that might confound PET coregistration or quantitative analysis. The neuroimaging analysis team were single-blind to the clinical findings at the time of analysis.
Subjects underwent routine clinical assessment including a 10-min timed walk, 6-min walking test, timed up and go, modified Ashworth’s spasticity score, and 11-point visual analog pain score. Additionally, neurocognitive function was assessed by validated psychometric tests including National Adult Reading Test, Hospital Anxiety and Depression Scale, Rapid Visual Information processing, and Choice reaction time. Concurrent peripheral blood mononuclear cell (PBMC) proviral load and T-lymphocyte data were utilized, but cerebral spinal fluid (CSF) data were from the most recent lumbar puncture. Patients on potentially disease-modifying therapy were excluded.
Historic 11C-PBR28 PET data for 8 age-matched healthy volunteers (2 women; mean age ± SD, 55.6 ± 6.1 y; all high-affinity binders) acquired at the same center with the same scanner and imaging protocol were used for comparison with the patients. Three of these 8 control subjects also had DWI and were therefore used in the MRI analysis, together with historical DWI (and T1w scans) from a further 3 healthy volunteers (n = 6; mean age ± SD, 47.5 ± 3.9 y).
PET Imaging and MR Imaging
11C-PBR28 (340.16 ± 13.60 MBq) was injected as an intravenous bolus over approximately 20 s at the start of 90-min 3-dimensional-mode dynamic PET acquisition. PET data were reconstructed using filtered backprojection with corrections for attenuation and scatter (based on a low-dose CT acquisition). Dynamic data were binned into 26 frames (durations, 8 × 15 s, 3 × 1 min, 5 × 2 min, 5 × 5 min, and 5 × 10 min). Arterial blood was sampled via the radial artery to enable generation of an arterial plasma input function. Blood samples taken at 5, 10, 20, 30, 50, 70, and 90 min were also analyzed using high-performance liquid chromatography to determine the fraction of parent radioactivity in arterial plasma. The generation of the metabolite-corrected plasma input function has been detailed previously (15).
Each subject underwent MR scanning on a Siemens 3T Verio with a 32-channel phased-array head coil. A 1-mm isotropic whole-brain structural 3-dimensional T1w magnetization prepared rapid gradient-echo (16) was acquired using the ADNI-GO parameters (17) with a parallel imaging factor of 2 in 5 m:09 s. In addition, a 2-mm isotropic 12-diffusion direction DWI scan (b = 0 and 1,000 s/mm2) covered 49 contiguous 2-mm slices of the brain.
PET Image Analysis
Dynamic PET data were corrected for motion via frame-to-frame image registration and aligned with the individual’s structural T1 MR image using SPM5 (Wellcome Trust Center for Neuroimaging, http://www.fil.ion.ucl.ac.uk/spm) with a mutual information cost function. Probability maps of brain gray and white matter were generated from the T1w image data after segmentation using SPM5. The CIC neuroanatomical atlas (18) was nonlinearly deformed into the individual’s space, via T1 MRI data mapping, to obtain a personalized anatomic parcellation of regions of interest (ROIs). Attention focused on regions of different levels of binding such as the thalamus, hippocampus, amygdala, cerebellum, caudate, and brain stem (including the medulla, pons, and mid brain). Each ROI was then applied to the dynamic PET data to derive regional time–activity curves.
PET Kinetic Analysis
A 2-tissue-compartment model, using the metabolite-corrected plasma input function, was applied to the regional PET time–activity data using a fixed blood volume correction of 5%. For each ROI examined, the total volume of distribution (VT) was estimated from the rate constants as described previously (19). The Logan graphical method (20) using a plasma input, 5% fixed blood volume, and a linear start time at 35 min was also applied to estimate the VT at the voxel level to produce a parametric VT map for each subject. In addition to VT, the distribution volume ratio (DVR, a VT ratio between a target ROI and a pseudo reference region, in this case, cortical gray matter [GM]) was also obtained for each ROI to increase sensitivity to identifying local differences across subjects. Time stability of regional VT was studied across all subjects. On the basis of this analysis, the VT estimated from the 55-min data of subject 1 was corrected for the bias induced from a shorter scan duration to be consistent with the other subjects. Model fitting and parameter estimation was performed using software implemented in Matlab R2008b (The MathWorks Inc.).
MR Image Analysis
MRI data processing used tools from the FMRIB Software Library (FSL; v4.1.9): FSL-VBM (21) to generate Jacobian-modulated, smooth (σ = 3 mm) GM volumes in the MNI152 standard space for exploration of voxelwise differences in GM volume (between HAM patients and controls), and functions from FMRIB’s Diffusion Toolbox (FDT) (22) to generate motion-corrected, coregistered MD maps for ROI analysis in each subject’s native image space. For the voxelwise statistics and inference in voxel-based morphometry (VBM), design files were generated with age as a nuisance variable, and randomize (permutation testing) was run with threshold-free cluster enhancement. The CIC neuroanatomic atlas (18) was applied to the modulated GM maps (in MNI152 standard space) to derive the mean GM volume per voxel in each aforementioned target ROI.
Statistical Analysis
With the exception of the VBM analysis, the patients were evaluated individually because of the small sample size. z scores of the regional VT, DVR, and GM measures were generated for each patient compared with healthy controls as well as ROI MD measures for all subjects. Correlations between these in vivo imaging measures and the laboratory and clinical assessments were investigated.
RESULTS
Demographics and Clinical Assessment
Five women and 2 men, aged 48–66 y (median, 57 y), participated in the study. Two women with HAM were Caucasian; the remaining subjects were Afro-Caribbean. Patients with HAM had been symptomatic for 2–19 y (median, 8 y), with a range of severity from severe and progressing to mild and stable as summarized in Table 1. All patients, including the 2 ACs, had a proviral load greater than 1 HTLV-1 DNA copy per 100 PBMCs. CSF data in the patients with HAM were available, revealing no or mild increases in CSF protein and lymphocyte counts but a uniformly high CSF–to–PBMC HTLV-1 proviral load ratio (median, 3.7; range, 1.4–4.7). Neurocognitive assessment (Supplemental Table 1; supplemental materials are available at http://jnm.snmjournals.org) did not reveal any consistent findings.
Estimation of VT and DVR
The regional VT values for individual patients and controls are shown in Figure 1. Global differences between patients were observed across the whole brain. Patient 2 with severe HAM (HAMs2) and patient 5 with moderate HAM (HAMmo) showed the highest TSPO binding, followed by patient 1 (severe HAM [HAMs1]) and patient 4 (mild HAM [HAMmi]). The VT values of all HAM subjects were higher than for the AC with high proviral load, across the whole brain. When compared with the uninfected controls, HAMs2 and HAMmo showed significantly higher TSPO binding in the brain stem and thalamus, with a z score greater than 1.94 (Table 2). There was no significant difference in metabolite profile, parent plasma input function (Supplemental Fig. 1), or plasma-free fraction between the groups (controls, 2.37% ± 1.79%; HAM patients, 1.83% ± 0.73%; ACs, 0.95% ± 0.14%). Controls, HAMs, and ACs showed similar time stability of VT, which is also consistent with little difference in the influence of radiometabolites (Supplemental Fig. 2).

Comparison of regional VT (left) and DVR (right) of 11C-PBR28 in HTLV1 subjects compared with healthy volunteers. Error bar is 1 SD. Amy = amygdala; Asym1 = patient 6, asymptomatic; Asym2 = patient 7, asymptomatic; Br.Stem = brain stem; Cau = caudate; Cereb = cerebellum; HAMs1 = patient 1, severe HAM; HAMs2 = patient 2, severe HAM; HAMmi = patient 4, mild HAM; HAMmo = patient 5, moderate HAM; Hip = hippocampus; mid = mid brain; Tha = thalamus.
PET Regional VT Data Analysis: z Scores of Individual Patient Regional VT Values Compared with Healthy Volunteers
Among the HAM subjects, HAMs1 showed lower binding than HAMs2 and HAMmo, possibly because of underestimation of the global VT value, as this subject was only scanned for 55 min. Because the VT of 11C-PBR28 has been reported to increase with scan duration (15), we corrected the VT by a scaling factor estimated from the whole population including both patients and controls (VT increased by 16% from 55 to 90 min; Supplemental Fig. 2). However, our data suggest that the increase in magnitude due to reduced scan duration is greater in patients with high binding than in controls; therefore, the performed correction is conservative and the true VT value for this subject potentially higher. When cortical GM was considered as a pseudo reference region to normalize the total volume distribution and increase sensitivity to evaluating regional differences, the DVRs of all subjects with severe and moderate HAM were significantly higher than the controls, in the thalamus, with z scores greater than 4 (Table 3).
PET Regional DVR Data Analysis: z Scores of Individual Patient Regional DVR Values Compared with Healthy Volunteers
The spatially normalized VT parametric maps are shown in Figure 2. Compared with the healthy uninfected volunteers, regional increase of TSPO binding in the thalamus and brain stem is demonstrated in the patients with severe and moderate HAM but not in the HTLV-1 AC.

Spatially normalized VT parametric maps of individual HTLV-1 carriers and population-averaged healthy controls. Asym1 = patient 6, asymptomatic; Asym2 = patient 7, asymptomatic; Avg = average; HAMs1 = patient 1, severe HAM; HAMs2 = patient 2, severe HAM; HAMmi = patient 4, mild HAM; HAMmo = patient 5, moderate HAM.
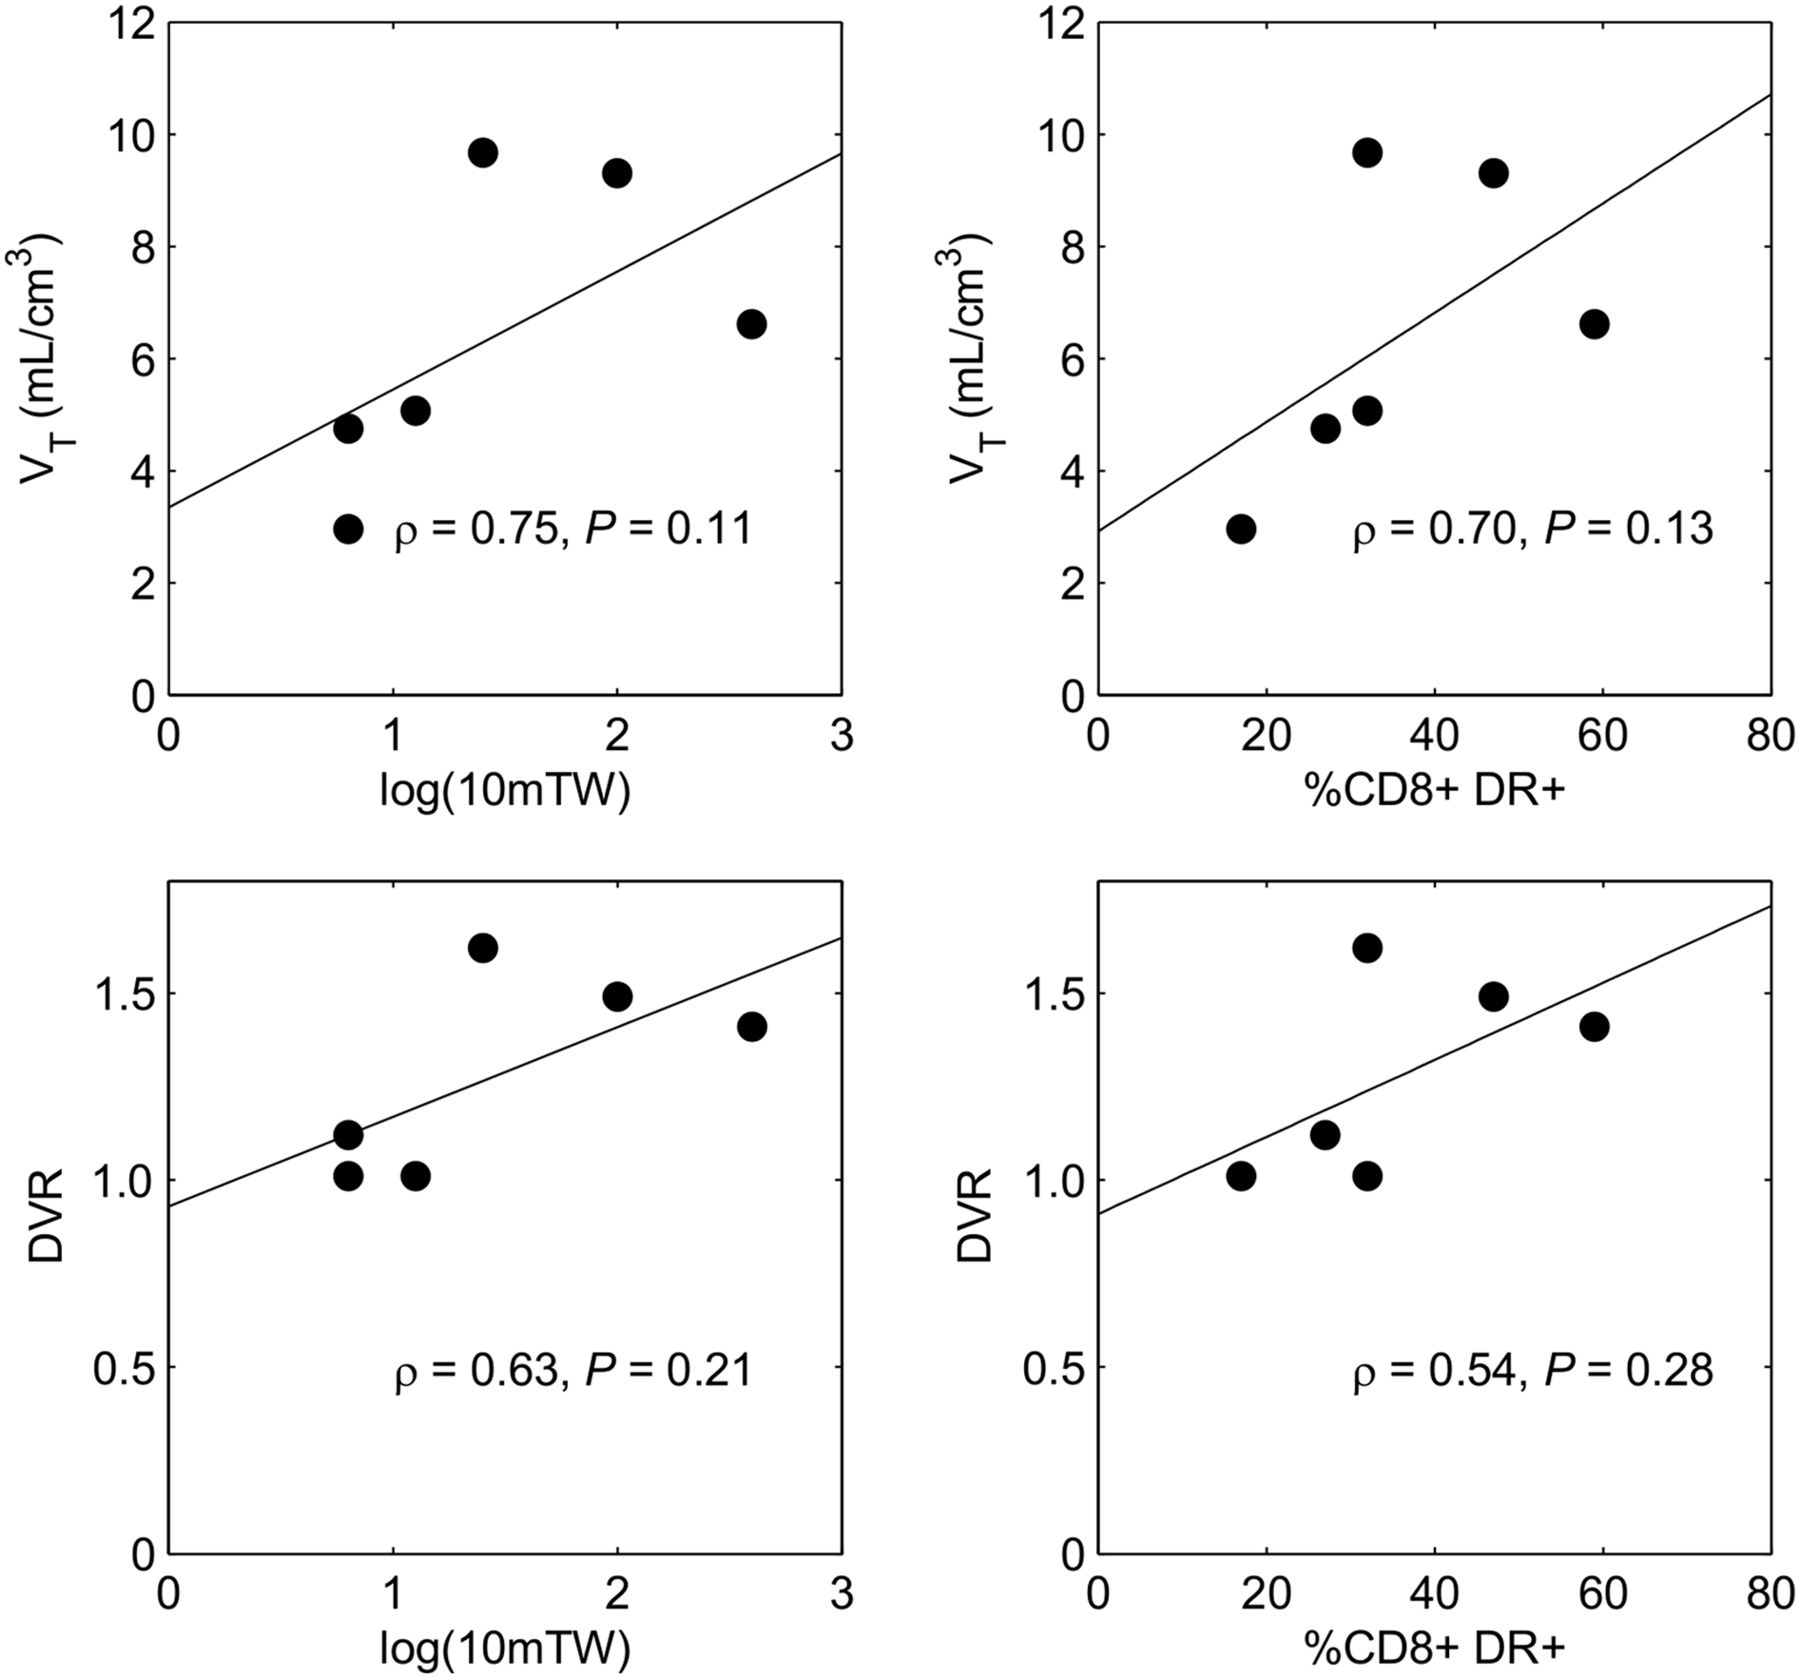
On the basis of evidence of increased TSPO binding in the thalamus of patients with severe and moderate HAM, we studied the correlation between the TSPO signal in this region with peripheral blood CD8+DR+ cell counts and with 10-m walk time. There is a trend for a positive correlation between the PET outcome measures (VT and DVR) and the 2 laboratory and clinical measures, although this did not reach significance because of the small sample size (Fig. 3). This regional difference in the thalamus as shown in DVR in addition to the global change in VT in HAM patients compared with controls suggest that the increased TSPO binding seen here was not driven by the possible changes in radioligand binding in the periphery due to increased activated lymphocytes. TSPO binding did not correlate with any domain of the neurocognitive function tests.

Spearman rank correlation analysis of in vivo thalamus PET outcome measures in HTLV-1–infected subjects with laboratory and clinical assessments. Top (left to right): correlation between VT and 10-m walk time in log scale and CD8+DR+ cell counts. Bottom (left to right): correlation between DVR and 10-m walk time in log scale and CD8+DR+ cell counts. TW = timed walk.
MRI Results
The VBM (1-p)–corrected P value images (Fig. 4) revealed little overall difference in GM topography between HTLV-1–infected patients and healthy uninfected controls, mostly limited to the brain stem and the left hippocampus. The regional analysis of GM fraction (Fig. 5) clearly shows that HTLV-1 patients have decreased GM volume in these brain stem and hippocampus regions compared with the healthy volunteers. Individual patient z scores for each regional GM fraction are presented in Supplemental Table 2. Interestingly, the ROI analysis on the modulated GM maps also showed strong positive correlations between clinical scores and HAM severity in the thalamus (left > right) (Fig. 6, top). Additionally, the thalamus shows a marked increase in MD in the HAM-severe patients compared with the controls, and a positive correlation with HAM severity and CD8/human leukocyte antigen–antigen D related (HLA-DR) (Fig. 6, bottom).

VBM analysis: small clusters of altered GM topography in HTLV-1–infected patients compared with controls.
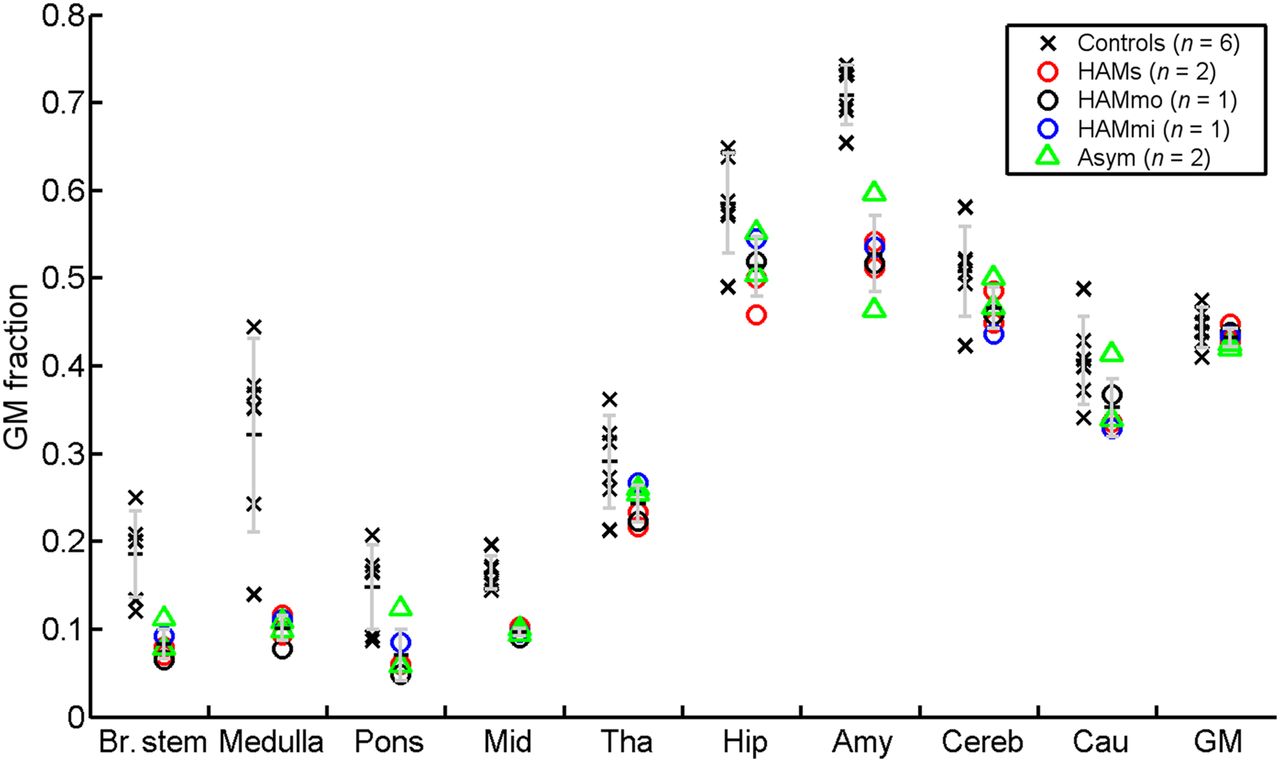
Regional GM fractions in HTLV-1 patients compared with healthy volunteers. Error bar is 1 SD.
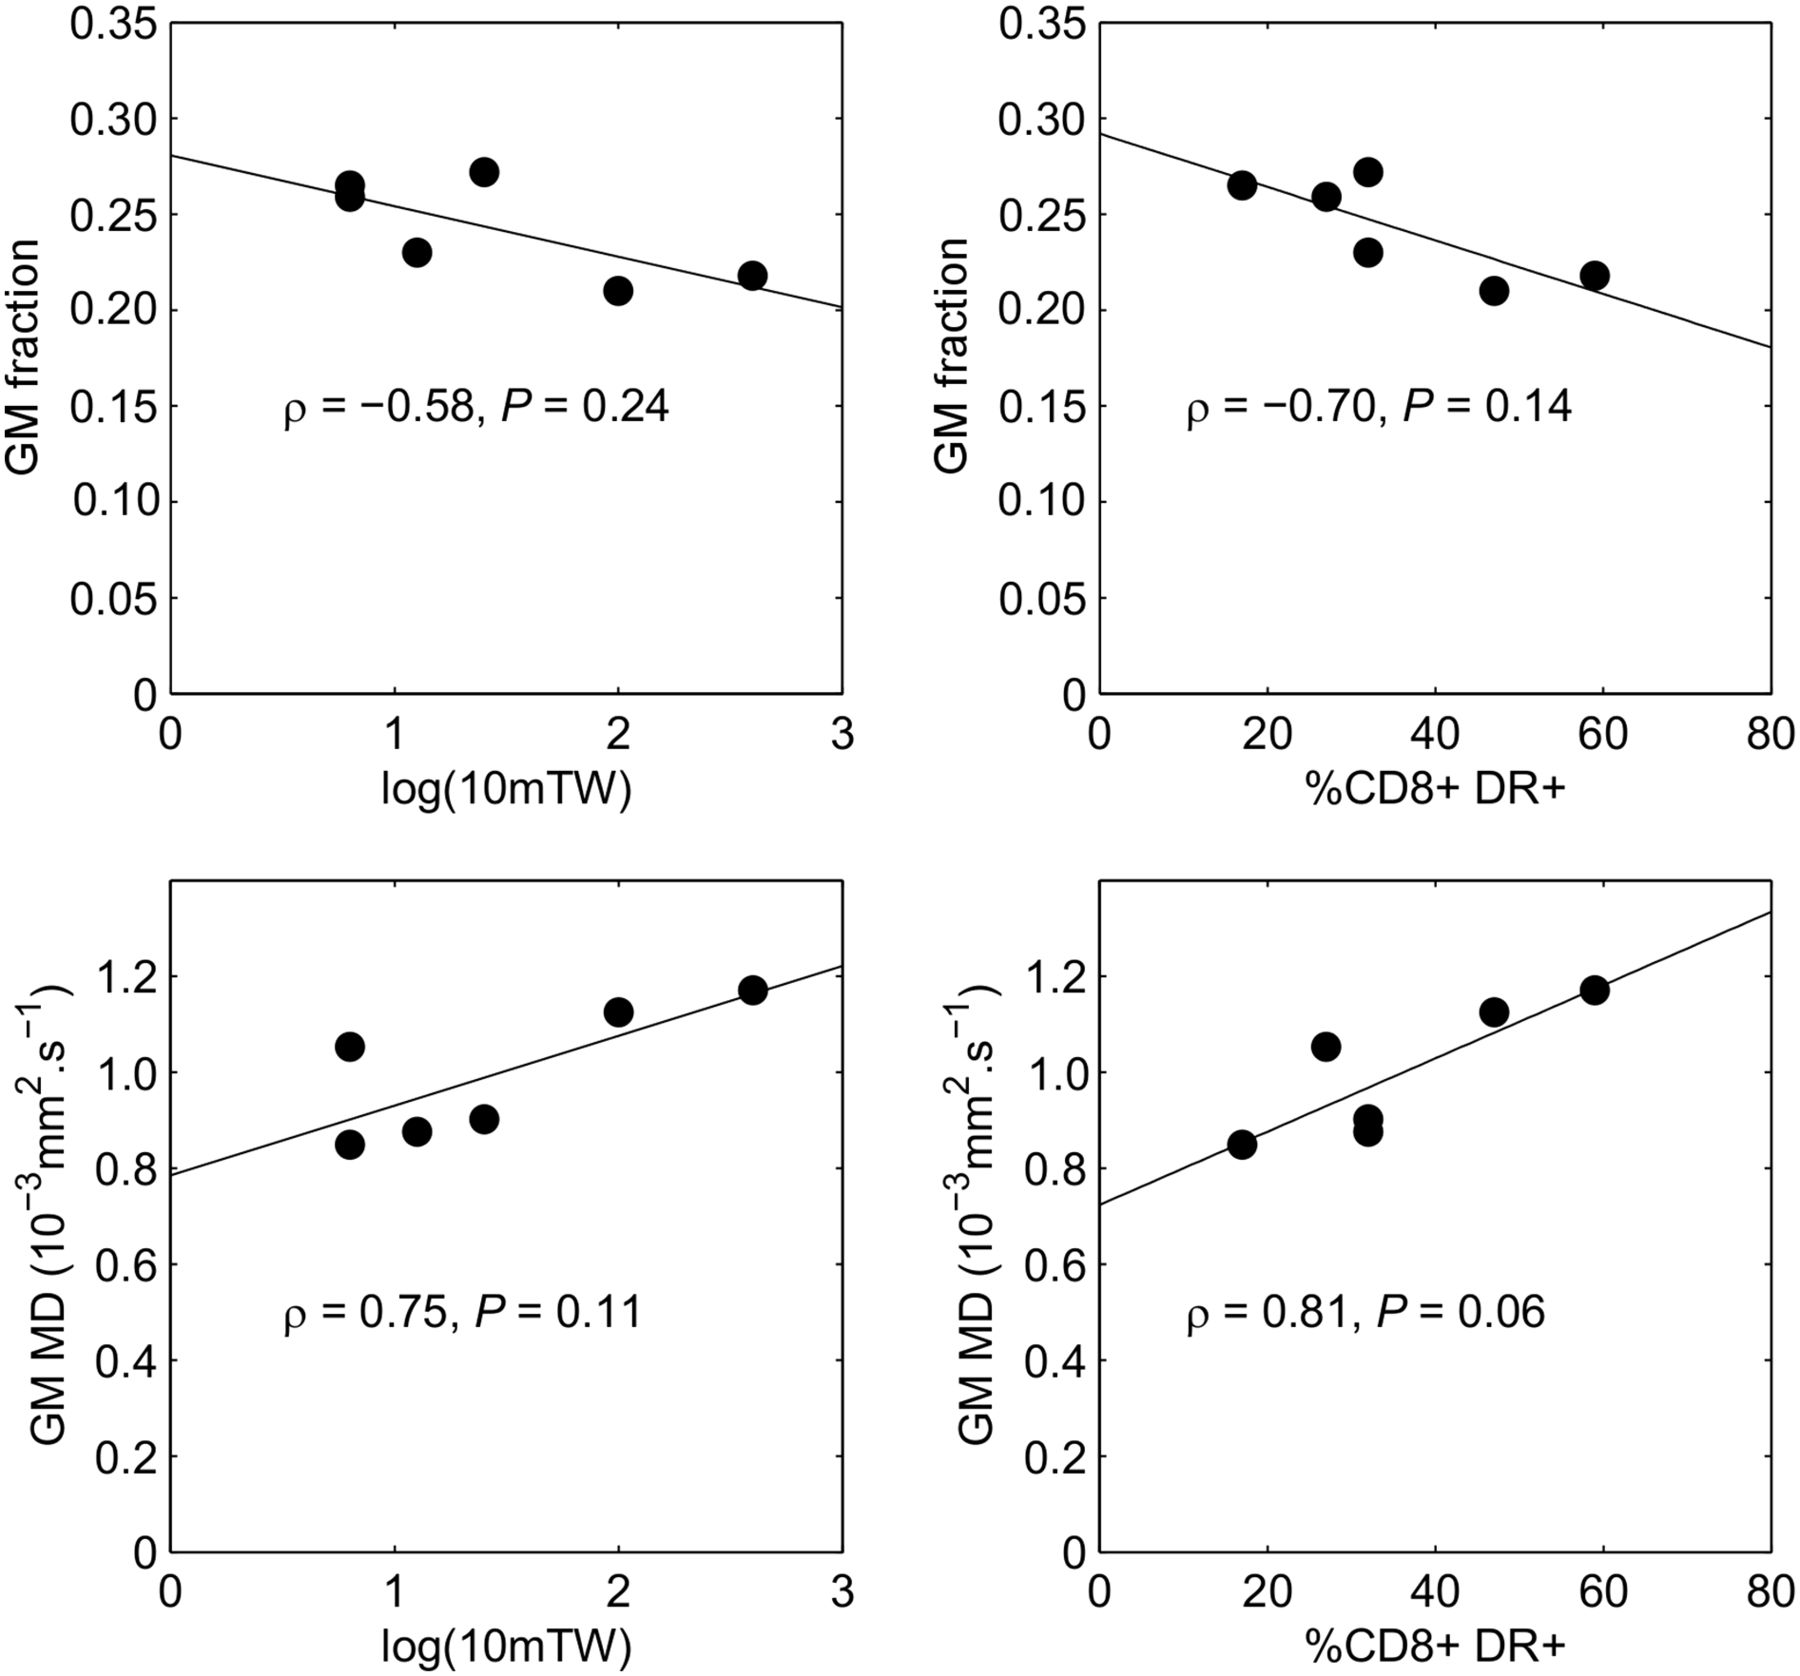
Correlations of left thalamus GM fraction (top) and right thalamus MD (bottom) with (left to right) clinical (10-m timed walk) and laboratory (% circulating CD8+ lymphocytes expressing HLA-DR) scores.
DISCUSSION
In this 11C-PBR28 study, TSPO binding showed a global difference across the whole brain with regard to the VT values. HAM subjects with severe disease showed highest binding followed by those with moderate and mild disease in decreasing order. Furthermore, there was a specific increase in TSPO binding in the thalamus and brain stem in subjects with severe and moderate disease compared with AC, whereas the binding in AC was similar to the HTLV-uninfected controls. This increase in binding, which suggests increased microglial activation, correlated with a marker of T-cell activation (%CD8 cells expressing HLA-DR) and a marker of disease severity (10-m walk time). In our cohort, we have found the percentage of circulating activated CD8+ lymphocytes (HLA-DR+) to be significantly higher in patients with HAM (47%), than in AC (28% P = 0.00001), than in healthy HTLV-1–uninfected controls (20%, P < 0.01 AC vs. controls) and perceive this to be evidence of ongoing inflammation in the periphery (Taylor, unpublished data, 2014). Although the correlation between the VT, DVR, and these laboratory and clinical measures was not significant because of the small sample size, the positive trend suggests that brain inflammation is related with severity of HAM, which has not been documented before.
VBM, which allows investigation of focal differences in brain anatomy, shows loss of GM in subjects with HAM, with strong positive correlations between clinical scores and HAM severity in the thalamus (left > right). MD, a marker of inflammation, is increased in the thalamus in HAM-severe patients compared with the controls (right > left) and shows a near-significant (P = 0.06) positive correlation with HAM severity and %CD8+DR+. Thus, the PET imaging evidence of brain inflammation, mostly in the region of the thalamus, is supported by the MR findings. Previous MRI studies have shown abnormal signals of white matter in the cerebrum, which were associated with inflammation, but these were usually small and not seen in all patients with HAM (23). In contrast, our MR analysis supported by 11C-PBR28 PET imaging shows, in subjects with moderate to severe HAM, evidence of current brain inflammation despite up to 19 y of disease. Although the detection of subclinical inflammation in the brain stem, as a continuum of the inflammatory process in the spinal cord, might not be unexpected, we speculate that both this and the thalamic focus may have an etiology similar to the microglial activation seen along the corticothalamic tracts and in the thalamus, with PL11195 PET imaging, months to years after traumatic brain injury (24).
HTLV-1 does not infect neurons, and the pathogenesis of HAM is currently attributed to bystander tissue damage consequent on the cellular immune response to infected lymphocytes that enter the central nervous system (CNS) (25). Factors associated with disease include high proviral load in PBMCs and CSF lymphocytes and genetics, especially HLA genotype (26,27). Shared HTLV-1 integration sites in CSF lymphocyte and PBMCs of patients with HAM (28) suggest that HTLV-1–infected lymphocytes migrate from the periphery into the CNS. A high frequency of HTLV-1–specific CD4 T-lymphocytes is seen in patients with high HTLV-1 proviral load (29), and expression of HTLV-1 in the CNS is thought to result in a local immune response.
The myelopathic symptoms with sparing of the upper limbs are indicative of inflammation in the thoracic spinal cord, and symptoms suggesting brain involvement are unusual in patients with HAM. This study shows evidence of an ongoing inflammatory process in selective regions of the brain despite the absence of overt clinical evidence of neurocognitive impairment or localizing neurology. Although unusual, increased TSPO binding without clinical symptoms has been observed in presymptomatic Huntington disease patients (30).
Postmortem studies in patients with HAM have shown grossly unremarkable brain except for diffuse thickening of the leptomeninges (31). Our finding of subclinical brain inflammation in patients with HAM is, however, consistent with the histologic study of Akizuki et al. (32), who found small numbers of infiltrating cells, mostly CD4+ and CD8+ lymphocytes and foamy macrophages in the mid brain, pons, medulla oblongata, cerebellum, and cerebral white matter. Inflammation involved both white matter and GM, but where affected white matter was preferentially degenerated. Furthermore, activated infiltrating macrophages and microglia expressing MRP14 and MRP8 have been demonstrated in HAM (33). In cases of longer duration, myelin and axon are equally degenerated and lost. Tissue is largely replaced by glial scar with foamy cells, microglial cells, and a small number of lymphocytes, mostly CD8+ (34). Our identification by VBM of reduced GM is consistent with this histologic evidence. In another study, perivascular inflammatory infiltration in the cerebrum was seen in deep white matter and in the marginal area of cortex and white matter. In addition to infiltrating cells, demyelination and axonal damage were seen in the lesions. The authors suggested that the HAM inflammatory process progressed in the whole CNS simultaneously (35). Preliminary in-house data suggest that the degree of brain inflammation seen with 11C-PBR28 in patients with HAM is much greater than that seen in dementia, multiple sclerosis, stroke, and depression. The CNS inflammation seen in patients with HAM was not seen in the ACs despite their similar high HTLV-1 proviral load in PBMCs. The additional inflammatory process triggers remain unknown. Genetic susceptibility associated with a less efficient adaptive immune response is implicated.
Once validated, these tools have great potential in the clinic: determination of ongoing inflammation, especially in long-standing disease, will allow targeted prescription of immune modulation while imaging pre- and posttherapeutic intervention will be useful in the assessment of novel therapies as well as to determine treatment efficacy for individual patients.
CONCLUSION
Evidence of inflammation in the brains of patients with more severe HAM were observed by 2 imaging modalities, and despite the small number of subjects there were correlations between clinical metrics and inflammation. This adds to the strength of the observation, notwithstanding the susceptibility to type 1 error of comparison of the clinical metrics with multiple regions. Further studies are needed to confirm and extend these findings, but the data suggest 11C-PBR28 PET, T1w MRI, and DWI are promising tools to detect and monitor active HAM and to directly investigate the efficacy of therapeutic targets on HTLV-1–associated neuroinflammation.
DISCLOSURE
The costs of publication of this article were defrayed in part by the payment of page charges. Therefore, and solely to indicate this fact, this article is hereby marked “advertisement” in accordance with 18 USC section 1734. Funding for this study was provided by National Institute for Health Research Biomedical Research Centre, Imperial College Healthcare NHS Trust, London. No other potential conflict of interest relevant to this article was reported.
Acknowledgments
The staff at National Centre for Human Retrovirology and Imanova Ltd provided valuable clinical support. GlaxoSmithKline kindly provided the healthy control data. We thank the patient volunteers for their continuing research support.
Footnotes
Published online Aug. 25, 2016.
- © 2016 by the Society of Nuclear Medicine and Molecular Imaging, Inc.
REFERENCES
- Received for publication March 3, 2016.
- Accepted for publication May 17, 2016.


