


Abstract
In addition to tumor size measurements with CT, there is a need for quantitative measurements of metabolic active volumes, possibly adding to tracer uptake measurements in oncologic response evaluation with PET. The aim of this study was to evaluate the metabolic volume test–retest variability in 18F-FDG and 3′-deoxy-3′-18F-fluorothymidine (18F-FLT) PET studies for various commonly used volumes of interest (VOIs) and the dependence of that variability on lesion size and relative radiotracer uptake. Methods: Twenty non–small cell lung cancer patients were scanned twice with 18F-FDG (n = 11) or 18F-FLT (n = 9). VOIs were defined on images reconstructed with normalization- and attenuation-weighted ordered-subset expectation maximization using 4 isocontours (A41%, A50%, and A70% thresholds, adapted for local background, and 50% threshold, uncorrected for background). Statistical analysis comprised intraclass correlation coefficients and Bland–Altman analysis. Results: In the 18F-FDG and 18F-FLT groups, 34 and 20 lesions, respectively, were analyzed. Median volumes at the A50% threshold were 3.31 and 2.19 mL (interquartile range, 1.91–8.90 and 1.52–7.27 mL) for 18F-FDG and 18F-FLT, respectively. Intraclass correlation coefficients were greater than 0.9, with the exception of the A70%-based metabolic volumes for 18F-FLT. For lesions greater than 4.2 mL, repeatability coefficients (RCs = 1.96 × SD) of the percentage difference ranged from 22% to 37% for 18F-FDG and from 39% to 73% for 18F-FLT, depending on the VOI method being used. Repeatability was better for larger tumors, but there was no dependence on absolute uptake (standardized uptake value). Conclusion: Results indicate that changes of greater than 37% for 18F-FDG and greater than 73% for 18F-FLT (1.96 × SD) for lesions with A50% metabolic volumes greater than 4.2 mL represent a biologic effect. For smaller lesions (A50% VOI < 4.2 mL), an absolute change of 1.0 and 0.9 mL for 18F-FDG and 18F-FLT, respectively, is biologically relevant. Considering the balance between the success rate of automatic tumor delineation and repeatability of metabolic volume, a 50% threshold with correction for local background activity (A50%) seems optimal among the VOI methods evaluated.
Response to therapy in cancer patients can be monitored with several methods. Traditionally, tumor size measurement with CT is the standard. At present, uptake of 18F-FDG is seen as an investigational tool, just as MRI methods and serum markers (1,2). Ideally, robust methodologies enable individual therapy guidance and evaluation of drug efficacy early in the development process.
The recently revised Response Evaluation Criteria in Solid Tumors indicated the potential for PET studies for monitoring disease progression, based on visual assessment (1), but also revealed that both widespread standardization and availability are still lacking. Wahl et al. pointed out the opportunities of PET in response evaluation with the capability of imaging metabolic activity (3). So far, most PET efforts in this context focused on measurements of tracer uptake. However, metabolic volume measurement might add relevant information because it represents the amount of tumor tissue that is tracer-avid and enables size or volume measurements of viable tumor (4,5). In this paper, we will use the term metabolic volume to indicate tumor volumes that are derived directly from the PET studies alone, whereas the term tumor size refers to CT-based size or volume assessments. In this paper and for the tracers used (18F-FDG and 3′-deoxy-3′-18F-fluorothymidine [18F-FLT]), the term metabolic volume may be justified because both tracers are trapped in tissue by metabolic (kinase) activity. Yet, this term should be used with care because volume assessment using PET with other tracers, such as those that bind to receptors or measure perfusion, should not be indicated by metabolic volume.
A major obstacle to the introduction of PET measures into response criteria such as Response Evaluation Criteria in Solid Tumors is the lack of evidence beyond proof of principle. Because of the relatively small sample size of most observational PET studies, meta-analysis would be beneficial but is hampered by methodologic heterogeneity, especially in acquisition, reconstruction, and data-analysis methods. Awareness that standardization of procedures is a key issue has only recently seemed to grow (6).
Repeatability (a function of biologic, technical, and observer variation) is an important feature of response-evaluation tools. Knowledge of normal variation helps to identify the relevant change in parameter value caused by an intervention.
The aim of this study was to evaluate the metabolic volume test–retest reproducibility of 4 frequently used semiautomatic 3-dimensional volume-of-interest (VOI) methodologies in 18F-FDG and 18F-FLT PET studies and the potential dependence of that variability on lesion size and relative uptake.
MATERIALS AND METHODS
Patients
Twenty patients with histology- or cytology-diagnosed non–small cell lung cancer (NSCLC) were included prospectively. All patients signed a written informed consent form in accordance with approval by the institutional review board.
PET
Patients were scanned twice within 7 d (mean, 1.7 d; median, 1 d) before any therapy—11 with 18F-FDG and 9 with 18F-FLT. Repeatability of 18F-FDG and 18F-FLT quantitative methods has been published elsewhere (7,8), and for full detail we refer to those publications. Scans were obtained on an ECAT EXACT HR+ scanner (Siemens/CTI). A 10- to 15-min transmission scan was followed by a 60-min emission scan in 2-dimensional mode (9). At the start of the dynamic 60-min emission scan, a bolus injection of 370 MBq of 18F-FLT or 18F-FDG in 5 mL of saline was administered through an injector (model H5GPE MCT Plus, 200 mL; Medrad International) at 0.8 mL/s, after which the line was flushed with 42 mL of saline (2.0 mL/s).
The last 15 min of the scan (the last 3 frames of the sinogram) were summed and used for VOI delineation. The images were reconstructed using normalization- and attenuation-weighted ordered-subset expectation maximization with 2 iterations and 16 subsets, followed by postsmoothing of the reconstructed images using a gaussian filter of 5 mm in full width at half maximum (FWHM), resulting in a spatial resolution of approximately 6.5 mm in FWHM near the center of the field of view.
Phantom Experiment: Volumetry
A phantom study using the NU2-2001 image-quality phantom of the National Electrical Manufacturers Association was performed to assess various VOI methods. The phantom background compartment was filled with an 18F-FDG solution (2 kBq/mL). Spheres were filled with an 18F-FDG solution, resulting in sphere-to-background ratios (SBRs) equal to 4.5 and 9 (thus, 2 experiments), covering lesion-to-nontumor ratios, as seen in patient studies. All phantom experiments were performed using the same scanner (HR+) and same reconstruction parameters as applied during patient studies.
In addition to this phantom experiment, a second experiment was performed using the same phantom to assess the repeatability of observed metabolic volumes. The background compartment was filled with an 18F-FDG solution (2 kBq/mL), and the spheres were filled so that an SBR of 9 was obtained. An identical experiment, with an SBR of 4.5 was performed. These phantoms were each scanned 6 times using the same scanner (HR+), procedure, and reconstruction parameters as applied during patient studies. For each of the 6 experiments, the phantoms were positioned at (slightly) different locations in the scanner. In this way, the axial slices and image matrix will cut through or sample the spheres differently during each study, thereby resembling the conditions met during clinical studies.
Image Analysis
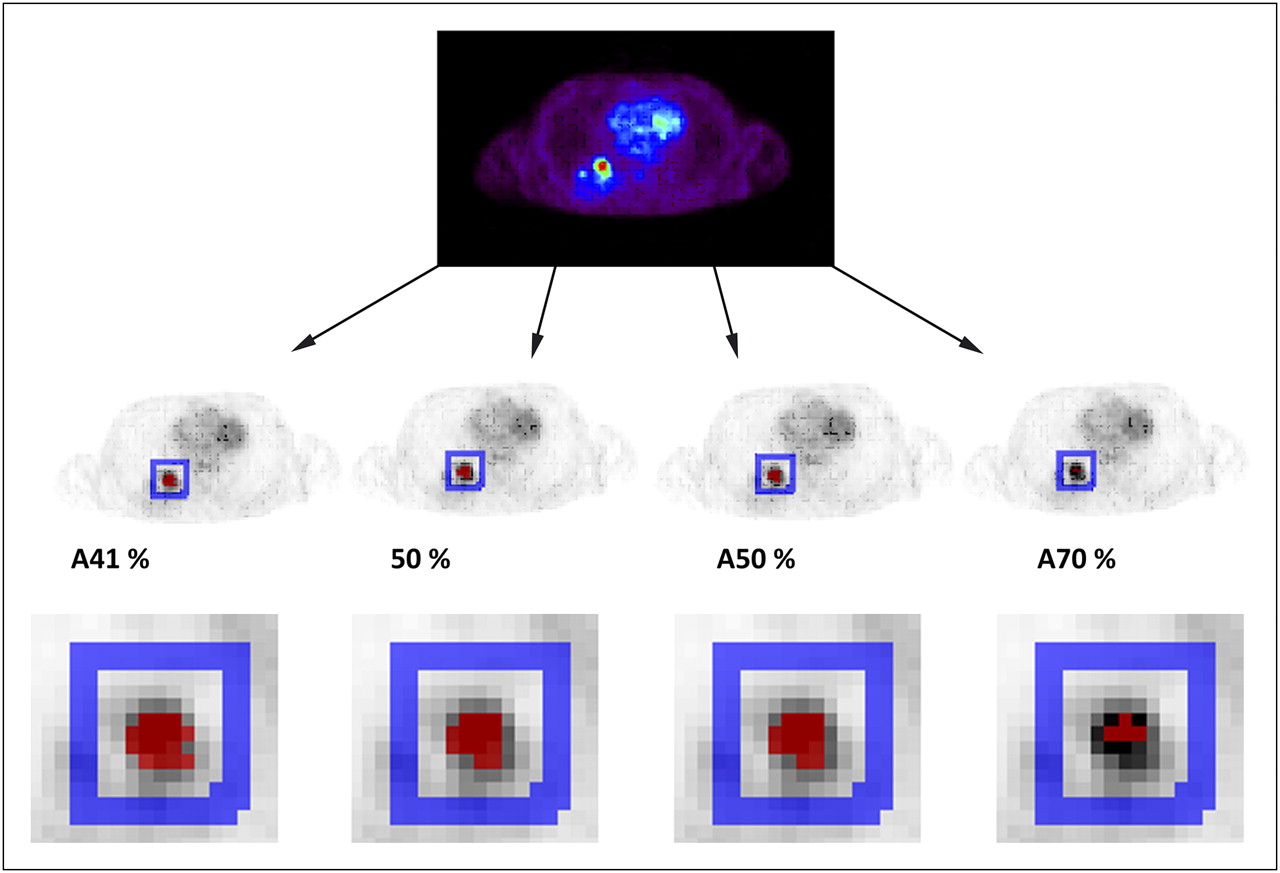
For VOI definition, a semiautomatic delineation tool was used, applying predefined thresholds of the maximum voxel value within the tumor (6,10). In this study, 4 predefined threshold VOIs consisting of 41%, 50%, and 70% of the maximum voxel value, with correction (adaption) for local background (A41%, A50%, and A70%, respectively), and a 50% uncorrected threshold VOI of the maximum voxel value (50%) were used to define the lesion volume. Rather than showing results for a single (optimal) threshold, we chose to use several VOIs to illustrate the effect of different VOI thresholds on volumetric accuracy, precision, and success rate. The 4 volumes (Fig. 1) were analyzed after a visual check, to ensure that nontumor tissue was not included. All evaluable lesions in the field of view that had adequate focal uptake and were thus delineable with the semiautomatic VOI tool for at least 1 of the studied VOI methods were included.

Typical example of 4 threshold-defined VOIs for 18F-FDG scan, for which red voxels represent resulting VOI and blue voxels local background, used for background correction.
For the phantom experiment, VOIs equal to those described for the patient study were used. Volume recovery coefficients were obtained by dividing the observed VOIs by the true phantom sphere volumes. Volume recovery coefficients were plotted as a function of true sphere volume and SBR. In addition, the repeatability of observed volumes seen during the second series of experiments will be reported.
Statistical Analysis
The repeatability of the measurements was estimated by calculating the mean and SD of the difference between test and retest values. In addition, the percentage difference was calculated as the absolute value of the difference between test and retest values, divided by the mean of both measurements. For both quantities, the repeatability coefficient (RC) was calculated as 1.96 × SD, as adopted by the British Standards Institution (11). Assuming that data are normally distributed with a mean of 0, in 95% of the cases the difference between the 2 measurements will be less than the RC. A t test was used to test the null hypothesis that the mean difference between test and retest metabolic volumes is 0. A rejection of this hypothesis would indicate that significant systematic bias and repeatability would not be assessable. To address the clinical question of repeatability across VOIs, both the absolute difference and the percentage difference were plotted against the mean of the test–retest value. The RCs for absolute and percentage differences were calculated for 2 subgroups of lesion VOIs of less and more than 4.2 mL. This volume threshold corresponds by approximation to a diameter of 2 cm (for spheric tumors). The threshold diameter of 2 cm equals about 3 times the spatial resolution of the PET images (FWHM, 6.5 mm near the center of the field of view) below which quantification, VOI definition, and detectability are hampered by partial-volume effects.
The impact of clustered observations (multiple pairs of measurements of different lesions on the same subject) was studied by means of mixed-effects models and, if necessary, corrected (12,13).
RESULTS
Phantom Studies
Figure 2 shows the volume recovery coefficients observed for the phantom studies. It was found that an A41% threshold most closely provided true sphere volume for spheres larger than 17 mm in diameter (or 2.6 mL), especially for an SBR of 4.5. Yet, for small spheres all methods, including the A41% threshold, seem not to provide reliable sphere volumes (and thus these points are missing in Fig. 2). When the SBR equaled 9, VOI A41% still provided the most accurate sphere volumes, although some bias up to −20% was observed. Use of higher threshold values (A50%–A70%) obviously results in smaller volume recovery coefficients. Yet, these higher thresholds are included in the patient studies because we hypothesized that relatively low thresholds may be more sensitive to lesion and nontumor uptake heterogeneity.
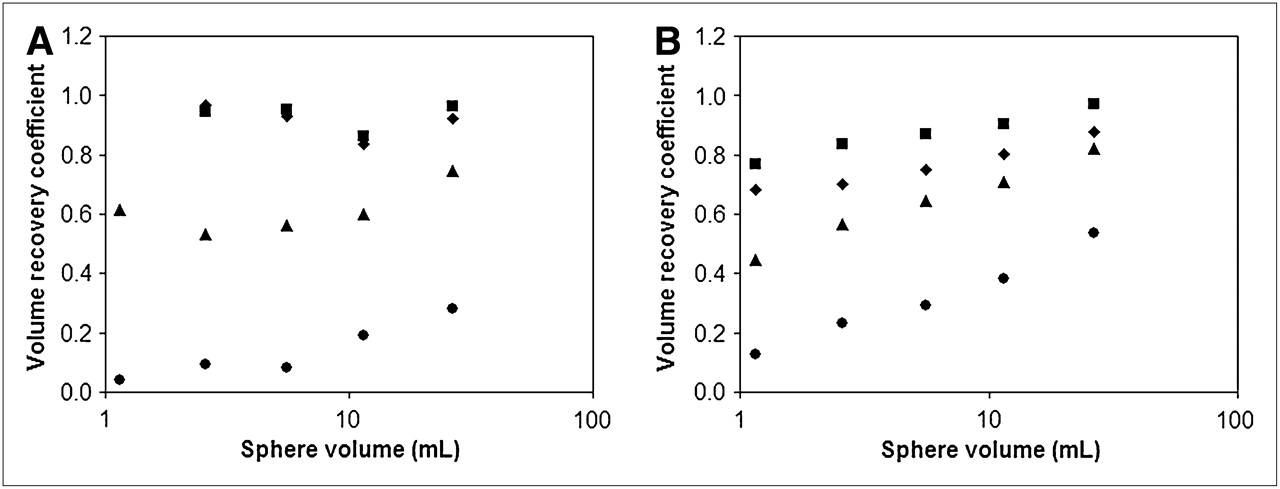
Plot of volume recovery coefficients per sphere volume in phantom study for different thresholds (same thresholds applied for patient study) with SBRs of 4.5 (A) and 9 (B). In both A and B, VOI A41%, 50%, A50%, and A70% (upper to lower datasets) are represented by ▪, ♦, ▴, and ○, respectively.
In Table 1, the coefficient of variation ([COV] %) of observed volumes is given for each of the VOI methods studied. In general, COV increases with smaller VOIs (or with higher VOI thresholds), for lower SBRs and smaller spheres. In Table 2, the SDs of observed volumes are shown. In this case, SD seems to decrease for smaller spheres, but a change of SD with higher-threshold VOI showed a less clear trend.
Percentage COV of Observed VOIs as Function of Actual Sphere Volume and VOI Method
SD of Observed VOIs as Function of Actual Sphere Volume and VOI Method
Patient Studies
The test–retest variabilities of four 3-dimensional VOI methods were analyzed in 20 NSCLC patients (16 men; age range, 45–78 y). Thirty-four lesions were identified in 11 patients scanned with 18F-FDG and 20 lesions in 9 patients scanned with 18F-FLT.
Table 3 shows the feasibility of successful VOI definition as a function of threshold: the A70% threshold was successfully identified for all lesions, whereas A41%, 50%, and A50% thresholds sometimes failed because of low tumor-to-background contrast. An A41% threshold identified 18 of 34 (53%) and 11 of 20 (55%) lesions for 18F-FDG and 18F-FLT, respectively. The 50% VOI identified 53% and 60% of the total lesions and A50% VOI identified 94% and 95%, respectively. Considering (equally weighted) balance between success rate and repeatability of tumor metabolic volume measurements, VOI A50% seems most optimal of the tested VOI methods. This VOI makes little concession on lesion detection (32/34 and 19/20 for 18F-FDG and 18F-FLT, respectively) and has sustainable or acceptable repeatability. Higher thresholds will underestimate true volume and have lower repeatability, similar to VOI A70%, whereas lowering the threshold will fail in success rate of lesion detectability, as seen for VOIs A41% and 50%.
Feasibility of VOI Definition and Spectrum of VOIs (mL)
The estimated median lesion diameter using the A50% threshold for 18F-FDG and 18F-FLT was 1.85 and 1.61 cm, respectively (interquartile range, 1.54–2.57 and 1.43–2.40, respectively). No statistical difference was observed between the metabolic volumes in the first and second scans for any VOI method.
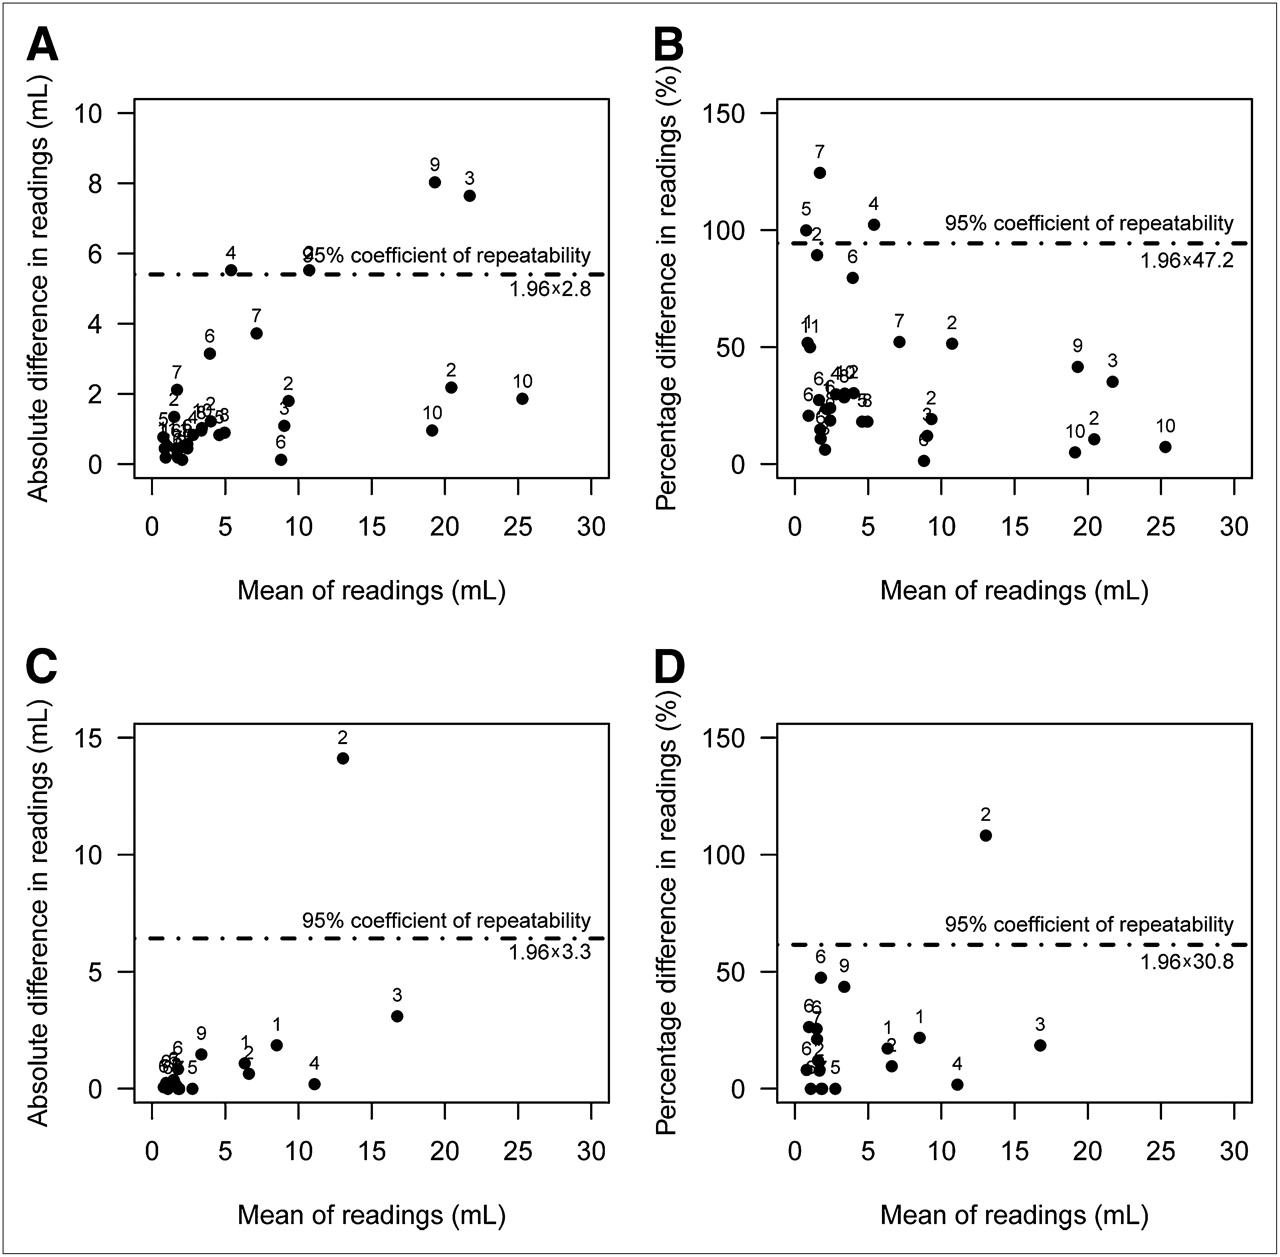
The absolute and percentage differences with RC are shown in Table 4 and plotted for 18F-FDG A50% and 18F-FLT A50% in Figure 3. RCs of the percentage differences ranged from 44% to 71% for 18F-FDG and 35% to 94% for 18F-FLT, depending on VOI used. For 18F-FDG A50%, for example, the range of percentage differences indicates that the measurement value would have to change more than 62% before one could be confident that the change represented more than measurement variation. There was a trend of increasing percentage RC with higher thresholds.

Plot of absolute difference between 2 scans against their mean for 18F-FDG (A) and 18F-FLT (C), respectively, and of percentage difference between scans against their mean for 18F-FDG (B) and 18F-FLT (D). Difference is proportional to SD of repeated measurements in each individual. The 95% RC is shown. Numbers near dots indicate patient number. One lesion of patient 7, with mean value of 96 for 18F-FDG, is not shown. Absolute difference for this particular lesion was 0.9 mL or 0.93%.
Absolute Mean, RC, and Percentage Difference with RC for 18F-FDG and 18F-FLT
From Figure 3, it is clear that the percentage difference was to some extent inversely related to VOI in the case of 18F-FDG PET, although this was not seen for 18F-FLT PET, for which it seems to be suitable to use both absolute and relative differences for all VOIs. The RCs for absolute and percentage difference were also calculated for subgroups of lesion VOIs of less and more than 4.2 mL. With 18F-FDG, for lesions with VOIs greater than 4.2 mL, the percentage RC was substantially lower than that for lesions with VOIs less than 4.2 mL, for all VOI methods. Similar trends were observed with 18F-FLT. Even though there were fewer 18F-FLT than 18F-FDG lesions, the data suggested that the improvement in RC was smaller for 18F-FLT than for 18F-FDG (Table 4). This is in line with Figure 3, indicating that percentage difference depended less on metabolic volume for 18F-FLT than for 18F-FDG. A possible explanation could be that for small lesions, partial-volume effects may be more pronounced and thus affect the overall accuracy and precision more for 18F-FDG than for 18F-FLT (e.g., because of the higher image contrasts usually seen for 18F-FDG). Yet this finding needs to be further explored. In the case of 18F-FDG studies, for lesions with VOIs less than 4.2 mL absolute RCs equaled 1.3, 1.4, 1.0, and 0.8 mL for the VOIs A41%, 50%, A50%, and A70%, respectively.
In the 18F-FLT group, 1 lesion showed heterogeneous uptake that differed largely between the 2 scans. A subanalysis excluding this 1 heterogeneous lesion (>4.2 mL) improved the metabolic volume reproducibility obtained with an A50% threshold from an RC of 73% to an RC of 16%.
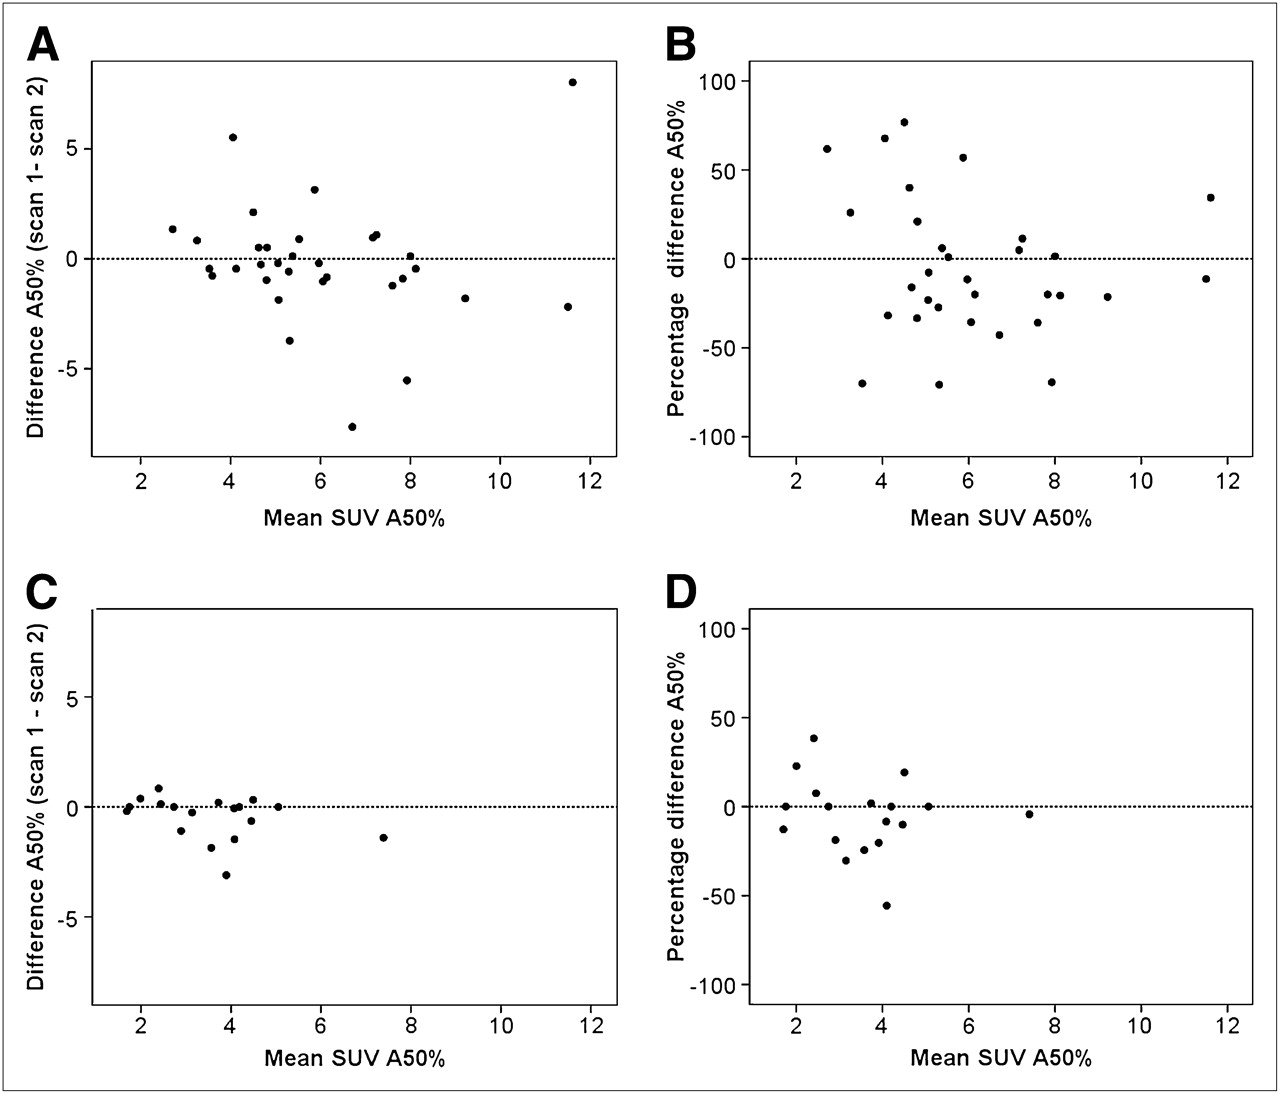
Metabolic volumes derived from VOIs that were based on a relative threshold of the maximum standardized uptake value (SUV) could depend on maximum SUV or mean SUV itself. However, no correlation between metabolic volume test–retest and maximum SUV test–retest variabilities was observed (R2 = 0.0002 and 0.13 for 18F-FDG and 18F-FLT data, respectively). Moreover, no clear correlation was found between absolute or relative metabolic active volume differences and SUV A50% (Fig. 4).

Difference in absolute volume measurement for 18F-FDG (A) and 18F-FLT (C), respectively, and percentage difference for 18F-FDG (B) and 18F-FLT (D) against mean SUV A50%.
Finally, testing for potential dependency of multiple lesions within patients (compared with treating them as independent observations) did not affect the result of any of the RCs at the level of 3 digits (data not shown).
DISCUSSION
For clinical implementation of any parameter of response assessment, test–retest repeatability has to be known. In this study, we explored 4 currently often-used VOI methodologies in lung cancer. From the array of VOI methods, we prefer semiautomatic delineation for reasons of consistency, lack of observer variability, and practical standpoints (8). Many sophisticated and sometimes complicated VOI methods are being developed, in part driven by the demand for radiotherapy planning. Results observed in the phantom studies closely corresponded to those found elsewhere—that is, for lung cancer (18F-FDG) PET studies a threshold close to 41%–50% has been reported to provide accurate tumor volumes (14). Obviously, higher thresholds and SBRs will provide smaller measured volumes, as seen both in the phantom and the patient studies.
Change in COV and SD of observed VOIs in the phantom study seem to follow the same trends as seen in the clinical studies. Higher-threshold VOIs provided smaller volumes and larger COVs, as was seen for both the 18F-FDG and the 18F-FLT studies. Moreover, COV seems to worsen for smaller spheres and for lower SBRs. Yet, COV results seemed to be better—that is, a lower COV—than those seen in clinical studies. A possible explanation could be that the uptake in the sphere and background is homogeneous, whereas this is clearly not the case in patient studies. Moreover, day-to-day physiologic variation in uptake may further have affected the clinical repeatabilities.
In the clinical studies, we identified high-percentage RCs for volumetric test–retest variability of all VOI methods when considering all lesions. For lesions greater than 4.2 mL (i.e., >2-cm diameter), a true metabolic volume effect may be identified if the metabolic volume obtained with an A50% threshold changes more than 37% for 18F-FDG and 73% for 18F-FLT. However, a volume change of 37% corresponded to a change in diameter from 2 to 1.7 cm—that is, a 15% reduction in diameter for spheric lesions. For metabolic volumes smaller than 4.2 mL, use of absolute rather than percentage difference may be considered. Figure 3 and the phantom data show that high-percentage differences are associated with small (average) metabolic volumes. For lesions less than 4.2 mL, an absolute change in metabolic volume (A50%) of 1.0 mL may reflect a true metabolic volume effect.
Figures 3A and 3C and the phantom data also suggest that the absolute difference between metabolic volumes of test and retest scans increases with (the mean) of the observed metabolic volumes. When more data are available, a (linear or even a nonlinear) relationship between test–retest variability and metabolic volume may be derived. An important issue for response assessment is whether to use absolute or relative (i.e., percentage) changes. Some studies suggest (3) the classification of a 30% and 0.8 SUV decrease as a partial response. Moreover, a minimal metabolic volume, lesion size, or SUV at baseline may need to be defined (i.e., when a tumor has minimal volume or uptake, there is not much that can change) to reliably measure response. A minimal metabolic volume threshold at, for example, 4.2 mL or 2-cm diameter, may also be required because small lesions are affected by partial-volume effects, influencing volume and SUV measurement precision.
Several issues mandate further exploration. First, we delineated VOIs over a summed image of 15 min, starting 45 min after injection. Delayed scanning, for example, up to 90 min, could give different results if metabolic volume is a function of the postinjection interval.
Second, we collected data using a PET system, and image characteristics may be different on modern PET/CT systems. These systems can be operated at higher resolutions and sensitivities, which could improve both metabolic volume accuracy and repeatability.
Third, the range of tumor-to-background ratios can differ for different tumor locations and types and radiotracers. For example, the spatial distribution of 18F-fluoromisonidazole may change considerably from day to day (15). Although metabolic volume test–retest variability for 2 different radiotracers has now been investigated, test–retest repeatability needs to be determined for each combination of radiotracer, tumor location, and type.
Fourth, the small number of lesions is a limitation of this pilot study. Unfortunately, several issues limit the collection of large datasets to date. First, the burden to patients and oncology and imaging departments usually limits the collection of test–retest studies to small sample sizes. Our observations, therefore, require external validation, especially because the number of observations was limited in some parts of the volume spectrum (e.g., the >4.2-mL group). We suggest that multicenter clinical trials incorporate baseline test–retest studies, not only to provide quality control but also to provide the additional data on precision of metabolic volume quantification required for further qualification of this potentially valuable biomarker. This would nicely fit in the current worldwide attempt to standardize quantitative PET procedures.
More work is also needed to optimize PET volume measurements. The effect of different image characteristics (image resolution and noise) and use of other VOI methods (e.g., gradient-based and iterative) on the accuracy and precision of metabolic volume assessments need to be evaluated. The performance of many VOI methods likely depends on or requires optimization of PET image acquisition. Therefore, it is also important to strive for standardized PET measurements (6,16).
Our VOI methods use a relative threshold of the maximum SUV and capture the metabolically most active part of the tumor only. This may be justified when PET is used to assess response to chemotherapy, assuming that the metabolically most active part of the tumor is the most relevant one. In the case of heterogeneous uptake, parts of the tumors will be missed (or oversegmented) using threshold-based methods. Figure 5 shows a lesion with variably heterogeneous uptake, resulting in different VOIs. Therefore, further development of VOI methods that account for radiotracer uptake heterogeneity, along with the development of methods that can describe or quantify intratumoral heterogeneous responses, is needed.

Test and retest image of heterogeneous lesion showing variation in uptake pattern resulting in highly different VOIs, implicating limitation of VOI methodology in (variation in uptake in) heterogeneous lesions. SUVmax = maximum SUV.
CONCLUSION
This study investigated the test–retest variability of metabolic volume for 2 different radiotracers. For lesions with a metabolic volume (A50%) greater than 4.2 mL, volumetric (3-dimensional) changes of more than 37% for 18F-FDG and more than 73% for 18F-FLT (1.96 × SD) seem necessary to represent a true effect. For smaller lesions (<4.2 mL), an absolute change of 1.0 and 0.9 mL is needed for 18F-FDG and 18F-FLT, respectively. For evaluating the tested VOIs in oncologic response monitoring, these test–retest boundaries should be taken into account. Considering the balance between success rate and repeatability of true tumor volume, using a VOI A50% threshold seems the most optimal and widely available or applicable of the tested VOI methods.
Acknowledgments
We thank the patients and their families for participating in this study. In addition, we acknowledge the staff of the Department of Nuclear Medicine and PET Research of the VU University Medical Centre, Amsterdam, The Netherlands, for their help with tracer production and data collection.
- © 2010 by Society of Nuclear Medicine
REFERENCES
- Received for publication March 15, 2010.
- Accepted for publication September 10, 2010.


Jump to section
Related Articles
Cited By...
- Feasibility of Ultra-Low-Activity 18F-FDG PET/CT Imaging Using a Long-Axial-Field-of-View PET/CT System
- Comparison of Multiple Segmentation Methods for Volumetric Delineation of Primary Prostate Cancer with Prostate-Specific Membrane Antigen-Targeted 18F-DCFPyL PET/CT
- The Impact of Semiautomatic Segmentation Methods on Metabolic Tumor Volume, Intensity, and Dissemination Radiomics in 18F-FDG PET Scans of Patients with Classical Hodgkin Lymphoma
- Interobserver Agreement on Automated Metabolic Tumor Volume Measurements of Deauville Score 4 and 5 Lesions at Interim 18F-FDG PET in Diffuse Large B-Cell Lymphoma
- Quantitative Test-Retest Measurement of 68Ga-PSMA-HBED-CC in Tumor and Normal Tissue
- Variability and Repeatability of Quantitative Uptake Metrics in 18F-FDG PET/CT of Non-Small Cell Lung Cancer: Impact of Segmentation Method, Uptake Interval, and Reconstruction Protocol
- Reproducibility and Repeatability of Semiquantitative 18F-Fluorodihydrotestosterone Uptake Metrics in Castration-Resistant Prostate Cancer Metastases: A Prospective Multicenter Study
- Repeatability of Quantitative Whole-Body 18F-FDG PET/CT Uptake Measures as Function of Uptake Interval and Lesion Selection in Non-Small Cell Lung Cancer Patients
- Repeatability of Quantitative 18F-Fluoromethylcholine PET/CT Studies in Prostate Cancer
- Prognostic Value of Pretherapeutic Tumor-to-Blood Standardized Uptake Ratio in Patients with Esophageal Carcinoma
- 18F-FDG or 3'-Deoxy-3'-18F-Fluorothymidine to Detect Transformation of Follicular Lymphoma
- Value of Metabolic Tumor Volume on Repeated 18F-FDG PET/CT for Early Prediction of Survival in Locally Advanced Non-Small Cell Lung Cancer Treated with Concurrent Chemoradiotherapy
- Using FDG-PET to Measure Early Treatment Response in Head and Neck Squamous Cell Carcinoma: Quantifying Intrinsic Variability in Order to Understand Treatment-Induced Change
- Tumor Microenvironment-Dependent 18F-FDG, 18F-Fluorothymidine, and 18F-Misonidazole Uptake: A Pilot Study in Mouse Models of Human Non-Small Cell Lung Cancer
- Reproducibility of Tumor Uptake Heterogeneity Characterization Through Textural Feature Analysis in 18F-FDG PET
- Effects of Image Characteristics on Performance of Tumor Delineation Methods: A Test-Retest Assessment