


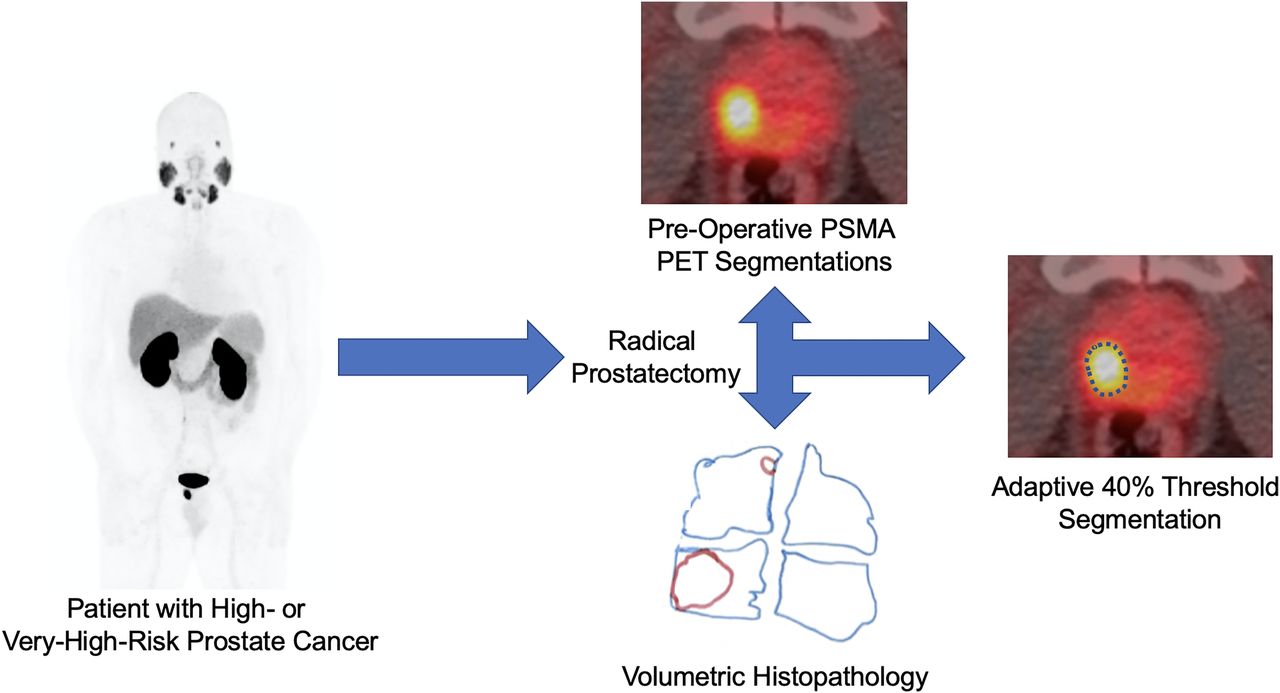
Visual Abstract

Abstract
This study aimed to assess the accuracy of intraprostatic tumor volume measurements on prostate-specific membrane antigen–targeted 18F-DCFPyL PET/CT made with various segmentation methods. An accurate understanding of tumor volumes versus segmentation techniques is critical for therapy planning, such as radiation dose volume determination and response assessment. Methods: Twenty-five men with clinically localized, high-risk prostate cancer were imaged with 18F-DCFPyL PET/CT before radical prostatectomy. The tumor volumes and tumor-to-prostate ratios (TPRs) of dominant intraprostatic foci of uptake were determined using semiautomatic segmentation (applying SUVmax percentage [SUV%] thresholds of SUV30%–SUV70%), adaptive segmentation (using adaptive segmentation percentage [A%] thresholds of A30%–A70%), and manual contouring. The histopathologic tumor volume (TV-Histo) served as the reference standard. The significance of differences between TV-Histo and PET-based tumor volume were assessed using the paired-sample Wilcoxon signed-rank test. The Spearman correlation coefficient was used to establish the strength of the association between TV-Histo and PET-derived tumor volume. Results: Median TV-Histo was 2.03 cm3 (interquartile ratio [IQR], 1.16–3.36 cm3), and median TPR was 10.16%. The adaptive method with an A40% threshold most closely determined the tumor volume, with a median difference of +0.19 (IQR, −0.71 to +2.01) and a median relative difference of +7.6%. The paired-sample Wilcoxon test showed no significant difference in PET-derived tumor volume and TV-Histo using A40%, A50%, SUV40%, and SUV50% threshold segmentation algorithms (P > 0.05). For both threshold-based segmentation methods, use of higher thresholds (e.g., SUV60% or SUV70% and A50%–A70%) resulted in underestimation of tumor volumes, and use of lower thresholds (e.g., SUV30% or SUV40% and A30%) resulted in overestimation of tumor volumes relative to TV-Histo and TPR. Manual segmentation overestimated the tumor volume, with a median difference of +2.49 (IQR, 0.42–4.11) and a median relative difference of +130%. Conclusion: Segmentation of intraprostatic tumor volume and TPR with an adaptive segmentation approach most closely approximates TV-Histo. This information might be used to guide the primary treatment of men with clinically localized, high-risk prostate cancer.
The ability to accurately localize a tumor and delineate its volume is critical for guiding intended therapies for primary prostate cancer (PCa). Multiparametric MRI is most commonly used for this purpose (1). However, substantial evidence exists that multiparametric MRI underestimates tumor volume and has low sensitivity for small intraprostatic lesions (2,3).
Current treatment options for men with PCa range from active surveillance to radical therapy. Adverse effects of PCa treatment can have profound impacts on a patient’s health and quality of life, including impotence, incontinence, and rectal toxicity (4). These effects exist because of the complex anatomy surrounding the prostate and the proximity to vital structures, such as the neurovascular bundles, as well as the bladder and rectum (5). The risk of damage to these structures is increased with whole-gland treatment options, such as radical prostatectomy and radiation therapy. Focal therapies have the benefit of improving functional outcomes and reducing these off-target effects, but they have been limited historically by the multifocal nature of PCa and the risk of undertreatment (6). Optimizing focal therapies requires finding the balance between ensuring maximal treatment and minimizing damage to surrounding tissue. This requires precise and accurate contouring of the tumor volume and subsequent treatment area. Therefore, if we can better recapitulate histologic volume with pretreatment imaging, we can improve the efficacy of various focal or hemigland therapies (6). Specifically, with regard to planning for radiotherapy, precise identification of tumor volume is critical for strategic mapping of radiation delivery and dosimetry to minimize these off-target effects (7). Precision prostatectomy (8) is another more focal surgical treatment option that has shown outcomes for intermediate-risk PCa superior to those of other focal therapies while minimizing the adverse functional effects of radical prostatectomy.
Consequently, there is still a need for additional techniques to accurately identify tumor burden within the prostate. PET with radiotracers targeting prostate-specific membrane antigen (PSMA) have been studied in this context and have shown a high degree of sensitivity and specificity for primary PCa detection (9–11). Despite this, questions remain about the correlation of the radiotracer signal to the actual volume of the tumor—information that is critical when using PSMA PET for treatment guidance. The high contrast resolution of PSMA PET, with which very high radioactivity concentrations are achievable with PSMA-targeted agents, has the potential to overcome the intrinsic spatial-resolution limitations of other modalities. The use of PSMA PET to boost sites of disease to visibility is already under way, emphasizing the need for accurate PET-based tumor volume determination (12) as a means to both personalize treated volume and objectively determine response to therapy.
In this study, we assessed the accuracy of intraprostatic tumor volume measurements made with various segmentation methods on PSMA-targeted 18F-DCFPyL PET/CT and used a gold standard of histopathology for comparison. We focused on SUV-based threshold methods in the interest of developing metrics that would be most easily translated into clinical practice, although we acknowledge the array of more advanced methods that have been investigated (13).
MATERIALS AND METHODS
General
This study is a secondary analysis of the intraprostatic findings from a previously published phase II trial studying 18F-DCFPyL PET/CT in men with high-risk PCa undergoing radical prostatectomy (14). The original trial was indexed at ClinicalTrials.gov (NCT02151760) and was approved by the local institutional review board (NA_0092956/J1418).
Patients
The study enrolled men with clinically localized, high- or very high–risk PCa, as defined by the National Comprehensive Cancer Network (15). Preoperative staging was performed with the aid of conventional imaging, with a combination of 99mTc-methylene diphosphonate bone scan and either contrast-enhanced CT of the abdomen and pelvis or MRI of the pelvis. Evidence of distant metastatic disease or lymph node involvement on conventional imaging—that is, any lymph node longer than 15 mm on the short axis (16)—excluded the patient from participation in the study.
18F-DCFPyL PET/CT Imaging
18F-DCFPyL PET/CT was performed for all patients using an imaging protocol that has been previously described (17). Patients received up to 333 MBq (9 mCi) of 18F-DCFPyL administered via slow push through a peripheral intravenous catheter. Patients were instructed to void immediately before the image acquisition process began. Approximately 60 min after administration, a low-dose CT scan without intravenous contrast was obtained for attenuation correction and anatomic localization, followed by PET on either a Biograph mCT (Siemens Healthineers) or a Discovery VCT (GE Healthcare) using protocols that had been optimized to produce closely harmonized performance. The Biograph mCT data were reconstructed using 3-dimensional ordered-subsets expectation maximization with time of flight, 2 iterations, 21 subsets, 4-mm voxels, and a 5-mm, 3-dimensional gaussian filter. Corrections were applied for attenuation (CT-based), scatter (single-scatter simulation), randoms (delayed event subtraction), and dead time. The Discovery VCT data were reconstructed using 3-dimensional ordered-subsets expectation maximization without time of flight, 2 iterations, 21 subsets, 4.7-mm voxels, and a 3-mm, 2-dimensional gaussian filter. Corrections were applied for attenuation (CT-based), scatter (single-scatter simulation), randoms (singles-based), and dead time. These reconstruction parameters resulted in closely matched imaging performance, with recovery coefficients well within the range recommended by the European Association of Nuclear Medicine. For example, replicate experiments (n = 8) involving the National Electrical Manufacturers Association image quality phantom showed mean recovery for the 10-mm sphere of 53.2% (SD, 2.2%) for the Biograph mCT and 50.2% (SD, 3.1%) for the Discovery VCT.
Surgical Pathology
All patients underwent imaging, followed by radical retropubic prostatectomy with bilateral extended pelvic lymph node dissection within 1 wk of the 18F-DCFPyL PET/CT. For routine pathology analysis, the entirety of each prostatectomy specimen was submitted for formalin fixation and paraffin embedding. This entailed sectioning the prostate from apex to base in approximately 3-mm slices and handling the prostate in a manner that allowed the pathologist to determine tissue orientation at all times. After standard-of-care determination of tumor stage, margin status, Gleason score, and grade group, each section of the prostate and seminal vesicles that had been stained with hematoxylin and eosin was reviewed microscopically, and regions of tumor were demarcated using a marking pen. Then, the outline of each slide and the regions of tumor were traced onto transparency paper, keeping the orientation of all 3 axes present such that we obtained 3-dimensional maps of the prostate and tumor lesions (Fig. 1). Subsequently, each section of prostate and seminal vesicles was placed over graph paper with 1-mm squares. The total number of squares subsumed by the prostate and seminal vesicles, as well as by the tumor, was recorded for each patient. Using 3-mm slice thicknesses, it was possible to calculate the volumes of the total glands and the tumor foci. Volumetric analyses were performed by a subspecialty-trained genitourinary pathologist and verified by another genitourinary pathologist with more than 20 y of experience. The nodule harboring the highest Gleason grade was selected for each patient.

(A) Series of transparency tracings of histologic sections of prostate gland (blue outline) and tumor (red outline) from 1 patient in this study. Contours were drawn by hand from original histologic slides stained with hematoxylin and eosin. (B) Corresponding transparency tracings that have been transferred to 1-mm graph paper, with tumor demarcated by small black marks in each 1-mm square that corresponded to presence of tumor. Text is mirrored, because images were flipped to correspond to standard imaging display. Individual squares were determined by interpreting pathologist and confirmed by another pathologist. (C) Axial 18F-DCFPyL PET/CT representative images from same patient. High uptake in right-sided dominant tumor nodule in prostate, extending from base to apex, is similar to pathologic results. PET images were selected to show overall extent of abnormal uptake but do not specifically correspond in slice-dependent manner with histopathologic slides.
Image Analysis
All images were exported to a Mirada workstation running XD3 software (Mirada Medical). The dominant intraprostatic focus of uptake was identified in all patients, and segmentations were performed. These segmentations included the best manual approximation of tumor extent, SUV-based tumor segmentation using the SUVmax percentage (SUV%) with varying thresholds of SUV30%–SUV70%, and adaptive segmentation using the adaptive segmentation percentage (A%) with varying thresholds of A30%–A70%. For adaptive segmentations (18), the volume-of-interest isocontours were delineated by multiplying the selected SUVmax threshold (SUV30%–SUV70%) by the sum of SUVmax and an average background value determined by a 3-cm spheric volume of interest in the pelvis that did not include abnormal uptake. The manual segmentations were not done at any preset windowing level; the performing radiologist was allowed to adjust the windowing to account for adjacent activity and was actively changing the window levels during tumor delineation. Imaging-based volumes of the prostate were also obtained.
Statistical Analysis
Quantitative variables were tested for normal distribution by the Shapiro–Wilk test. Continuous variables were presented as median and interquartile ratio (IQR), and categoric variables were presented as frequency and percentage.
For each patient, the absolute and relative differences between PET-derived tumor volume measured by different segmentation methods and histopathologic tumor volume (TV-Histo) were calculated as follows: Eq. 1
Eq. 1 Eq. 2
Eq. 2
The histopathologic and PET-derived tumor-to-prostate ratios (TPRs) were calculated.
Box plots were used to graphically illustrate the distribution of differences in tumor volumes and TPRs for each segmentation method, showing the median, first and third quartile, and mean and maximum values. The significance of differences between the TV-Histo and PET-based tumor volume and the TPRs were assessed using the paired-sample Wilcoxon signed-rank test. The Spearman correlation coefficient was used to establish the strength of association between TV-Histo and PET-derived tumor volume (19). Scatterplots were used to display the relationship between TV-Histo and PET-derived tumor volume across segmentation methods (Supplemental Figs. 1–11 [supplemental materials are available at http://jnm.snmjournals.org]). Statistical significance was defined as a P value of less than 0.05. Data were analyzed using SPSS version 26 (IBM).
RESULTS
Patient Demographics and Surgical Pathology Findings
Twenty-five patients with clinically localized, high-risk PCa were included in this study. Supplemental Table 1 lists individual patient clinical data. A summary of patient demographics and clinicopathologic tumor characteristics is provided in Table 1. Patients had a median prostate-specific antigen level at the time of the scan of 9.3 ng/mL (IQR, 5.7–19.7 ng/mL), and 16 (64%) men had Gleason score 9, 2 (8%) men had Gleason score 8, and 7 (28%) men had Gleason score 7. After prostatectomy, 20 of 25 (80%) patients were found to have extraprostatic involvement. Seminal vesicle invasion was present in 7 of 25 (28%) patients, as was lymph node involvement. The median TV-Histo was 2.03 cm3 (IQR, 1.16–3.36 cm3). The median SUVmax of the tumor and background prostate was 9.84 (IQR, 6.62–22.61) and 2.07 (IQR, 1.77–2.72), respectively.
Summary Patient Demographics
Comparison of PET Segmentation Methods to Pathology
Segmentation of the tumor volume using the SUV threshold algorithm (SUV30%–SUV70%), adaptive threshold algorithm (A30%–A70%) (18), and the manual method were compared with the ground truth of TV-Histo. The absolute and relative differences in PET-derived tumor volume and TV-Histo across segmentation methods are reported in Table 2. Our results showed that adaptive method with an A40% threshold most closely determined the tumor volume, with a median difference of 0.19 cm3 (IQR, −0.71 to +2.01 cm3) and a median relative difference of +7.6%. Among the SUV-based threshold segmentation methods, an SUV50% threshold had the least difference; TV-Histo had a median difference of −0.3 cm3 (IQR, −1.04 to +0.92 cm3) and a median relative difference of −25%.
Absolute and Relative Percentage Difference of PET-Derived Tumor Volume with Pathology Across Segmentation Methods
The paired-sample Wilcoxon test showed no significant difference in PET-derived tumor volume and TV-Histo using A40%, A50%, SUV40%, and SUV50% threshold segmentation algorithms (P > 0.05). The tumor volumes derived from other segmentation algorithms were significantly different from those of TV-Histo (P < 0.05).
Figure 2 displays the distribution of absolute differences in tumor volume for different segmentation methods using a box plot. The box plot illustrates that the A40% segmentation algorithm most closely determined the tumor volume and had the least difference from TV-Histo.

Box plot of absolute differences between PET-derived tumor volume and TV-Histo across segmentation methods. Asterisk represents extreme values; circles are outlier values.
For both threshold-based segmentation methods, use of higher thresholds (e.g., SUV60% or SUV70% and A50%–A70%) resulted in underestimation of tumor volumes, and use of lower thresholds (e.g., SUV30% or SUV40% and A30%) resulted in overestimation of tumor volumes relative to TV-Histo. The manual segmentation method tended to overestimate the tumor volume, with a median difference of +2.49 (IQR, 0.42–4.11) and a median relative difference of +130%.
Spearman correlation coefficient analysis revealed statistically significant low positive correlation between TV-Histo and PET-derived tumor volume in SUV50%–SUV70%, as well as A30%–A50% and A70% (r = 0.44, 0.42, and 0.44 for SUV50%, SUV60%, and SUV70%, respectively, and r = 0.43, 0.47, 0.48, and 0.49 for A30%, A40%, A50%, and A70%, respectively). It showed moderate positive correlation in A60% (r = 0.55) and the manual method (r = 0.56) and no significant correlation in the SUV30% and SUV40% thresholds.
This analysis was extended to TPR, with statistically significant low positive correlation between histopathologic and PET-derived TPRs using the SUV70% threshold (r = 0.47) and the A40% and A50% thresholds (r = 0.45 and 0.49, respectively). Moderate positive correlations were observed for the manual method, as well as the A60% and A70% thresholds (r = 0.68 for manual, 0.53 for A60%, and 0.52 for A70%). No significant correlation was seen for the SUV30%–SUV60% thresholds or the A30% threshold.
Scatterplots of TV-Histo, PET-derived tumor volume, and TPRs across segmentation methods are presented in Supplemental Figures 1–11. The reference line (y = x) was drawn to show systematic skew in the data.
TPR
Prostate devitalization leads to prostate shrinkage after resection, which may lead to spuriously decreased histopathologic prostate volume and TV-Histo relative to preresection imaging. However, because prostate tumors typically do not have hypervascularity, the prostate parenchyma and tumors are likely to undergo shrinkage to comparable extents, leaving the ratio of the tumor volume to the prostate volume unchanged. Therefore, we evaluated the comparison of histopathologic and PET-derived TPRs across segmentation methods (Table 3). TPR analysis showed that the A40% segmentation and SUV50% threshold methods most closely determined histopathologic TPR (P = 0.29 and 0.4, respectively). Figure 3 displays the difference between histopathologic and PET-derived TPRs across segmentation methods.
Comparison of Histopathologic and PET-Derived TPRs Across Segmentation Methods

Box plot of relative differences between PET-derived tumor volume and TV-Histo across segmentation methods. Asterisks represent extreme values; circles are outlier values.
DISCUSSION
In recent years, there has been a rise in the use of PET imaging with PSMA-targeted agents, such as 18F-DCFPyL, 18F-DCFBC, and 68Ga-PSMA-11, in the detection of PCa (2,19–21). Implementing the best radiotracer in combination with the most accurate segmentation method may significantly improve staging, prognostication, and treatment planning of PCa. However, no segmentation method is considered definitive for delineating tumor volume from 18F-DCFPyL PET/CT. In this article, we demonstrate that an adaptive segmentation methodology most accurately recapitulates TV-Histo, regardless of whether tumor volume or TPR is used.
Various methods exist for determining tumor volume from PET data, including the SUV absolute value cutoff, SUV% threshold, adaptive thresholding, and manual segmentation. In studies imaging other cancers using different PET radiotracers, proposed thresholds ranged between 30% and 50% for both the SUVmax and the adaptive methods (22–25). In a study of 68Ga-PSMA-11 PET/CT comparing manual and semiautomatic segmentation methods with SUVmax thresholds, the highest sensitivity was achieved with a threshold of SUV20% and the highest specificity was achieved with a threshold of SUV40% or SUV50% (24). In our study, the A40% threshold demonstrated the greatest similarity to the ground truth of pathology, minimizing the difference in PET-derived tumor volume versus TV-Histo. Lower thresholds tended to overestimate tumor volume, whereas higher thresholds tended to underestimate tumor volume. Clinically, it may be more advantageous to overestimate, because of the comparative risk of treating benign prostate, than to leave malignant high-grade cells behind. Our findings are in line with studies that have shown that adaptive method performance is superior to that of standard fixed or relative thresholds in the segmentation of tumors (26,27).
Any study of in vivo imaging versus ex vivo pathology will have limitations. Specifically, both tumors and normal tissues undergo reductions in volume after devitalization, and accounting for such changes is difficult. We calculated ratiometric comparisons of tumor-to-prostate volume because the changes in volume in both types of tissue are likely similar. Furthermore, the patient cohort was limited to patients with high-risk disease. Studies of patients with lower-grade tumors would need to be performed to address segmentation in that population. In addition, the sample size was relatively small, although our study examined a greater number of lesions than other similar studies (22–24,28). Furthermore, the reliance of many of our segmentation methods on SUV-based thresholds suggests that very high–uptake tumors may lead to the exclusion of significant volumes of relevant disease in some patients. However, the use of SUV-based thresholds is easily translatable to the clinic. It is likely that more advanced methods of segmentation, including those derived from machine learning or neural networks (13,29), may be superior to the methods presented in this article, but those techniques are also more difficult to bring into clinical routine and may require refinement through additional rigorous, task-oriented studies (29,30). Even with painstakingly annotated data, there will always be comparative limitations. In this study, our inherently analog pathology specimens are being compared with digital imaging. Lastly, our scans were obtained from 2 different scanners, which adds an element of heterogeneity but could indicate broader generalizability to our findings. Detailed evaluations of other datasets of primary tumors relative to volumetric histologic gold standards are necessary. As advanced methods for segmentation become more commonly available in the clinic, we would expect that such methods would have the potential to supplant threshold-based techniques. We would also suggest that artificial intelligence or machine learning methods will be of significant importance in future work (31).
CONCLUSION
Accurate understanding of tumor volumes is critical when planning treatment for men with localized PCa. We show that segmentation at an A40% threshold on 18F-DCFPyL PET imaging most closely recapitulates pathologic volume in men with high-risk PCa (using either tumor volume or TPR) relative to other SUV threshold-based techniques. Future work is required to validate this method of tumor segmentation in men with lower-grade disease. In addition, it is unknown whether this method of tumor segmentation applies to other PSMA-targeted PET radiotracers.
DISCLOSURE
This study was funded by NIH/NCI grants P50CA58236, U01CA196390, U54CA274370, P30CA006973, and P41EB024495; U.S. DoD grant W81XWH-18-2-0015; and the Patrick C. Walsh Prostate Cancer Research Fund at Johns Hopkins University. Martin Pomper is a coinventor on a U.S. patent covering 18F-DCFPyL and as such is entitled to a portion of licensing fees and royalties generated by this technology. This arrangement has been reviewed and approved by Johns Hopkins University in accordance with its conflict-of-interest policies. Michael Gorin and Steven Rowe are consultants for Progenics Pharmaceuticals Inc., a wholly owned subsidiary of Lantheus, Inc., and the licensee of 18F-DCFPyL. Kenneth Pienta, Martin Pomper, Michael Gorin, and Steven Rowe have received research funding from Progenics. Angelo De Marzo is a paid consultant or advisor to Merck and Cepheid and has received research funding from Janssen and Myriad for unrelated work. No other potential conflict of interest relevant to this article was reported.
KEY POINTS
QUESTION: What is the best easily translatable method for segmenting primary, high-risk PCa on PSMA PET?
PERTINENT FINDINGS: Segmentation at a threshold of A40% most closely recapitulates primary tumor volume from pathology, whether compared with absolute tumor volume or TPR.
IMPLICATIONS FOR PATIENT CARE: Using the noted segmentation technique may allow more accurate guidance of therapy for primary, high-risk PCa.
Footnotes
↵* Contributed equally to this work.
Published online Nov. 30, 2023.
- © 2024 by the Society of Nuclear Medicine and Molecular Imaging.
REFERENCES
- Received for publication May 10, 2023.
- Revision received October 17, 2023.


