


Visual Abstract

Abstract
Alzheimer disease (AD) exhibits spatially heterogeneous 3- or 4-repeat tau deposition across participants. Our overall goal was to develop an automated method to quantify the heterogeneous burden of tau deposition into a single number that would be clinically useful. Methods: We used tau PET scans from 3 independent cohorts: the Mayo Clinic Study of Aging and Alzheimer’s Disease Research Center (Mayo, n = 1,290), the Alzheimer’s Disease Neuroimaging Initiative (ADNI, n = 831), and the Open Access Series of Imaging Studies (OASIS-3, n = 430). A machine learning binary classification model was trained on Mayo data and validated on ADNI and OASIS-3 with the goal of predicting visual tau positivity (as determined by 3 raters following Food and Drug Administration criteria for 18F-flortaucipir). The machine learning model used region-specific SUV ratios scaled to cerebellar crus uptake. We estimated feature contributions based on an artificial intelligence–explainable method (Shapley additive explanations) and formulated a global tau summary measure, Tau Heterogeneity Evaluation in Alzheimer’s Disease (THETA) score, using SUV ratios and Shapley additive explanations for each participant. We compared the performance of THETA with that of commonly used meta–regions of interest (ROIs) using the Mini-Mental State Examination, the Clinical Dementia Rating–Sum of Boxes, clinical diagnosis, and histopathologic staging. Results: The model achieved a balanced accuracy of 95% on the Mayo test set and at least 87% on the validation sets. It classified tau-positive and -negative participants with an AUC of 1.00, 0.96, and 0.94 on the Mayo, ADNI, and OASIS-3 cohorts, respectively. Across all cohorts, THETA showed a better correlation with the Mini-Mental State Examination and the Clinical Dementia Rating–Sum of Boxes (ρ ≥ 0.45, P < 0.05) than did meta-ROIs (ρ < 0.44, P < 0.05) and discriminated between participants who were cognitively unimpaired and those who had mild cognitive impairment with an effect size of 10.09, compared with an effect size of 3.08 for meta-ROIs. Conclusion: Our proposed approach identifies positive tau PET scans and provides a quantitative summary measure, THETA, that effectively captures heterogeneous tau deposition observed in AD. The application of THETA for quantifying tau PET in AD exhibits great potential.
Alzheimer disease is characterized by the accumulation of β-amyloid plaques and neurofibrillary tangles in the brain. Neurofibrillary tangles are composed of hyperphosphorylated tau proteins that progress along predictable patterns, originating in the transentorhinal cortex and spreading to the limbic system and eventually to the neocortex. The spread of tau leads to cognitive impairment and dementia (1). The current understanding of Alzheimer disease (AD) pathophysiology and neurodegeneration suggests that neurofibrillary tangle accumulation correlates with disease progression and precedes clinical symptoms, making tau a promising biomarker for disease diagnosis and clinical trial designs (2). However, pathologic and imaging evidence reveals heterogeneous tau deposition patterns in the AD brain across individuals (3,4).
PET imaging is used to visualize and assess tau deposition in neurodegenerative disorders using radioligands that bind to paired helical filaments of neurofibrillary tangles to detect and track tau pathology in vivo (5). Preclinical AD PET studies indicate that tau spreads throughout cortical regions along multiple trajectories (6). Common tau PET quantification methods include meta–regions of interest (ROIs) in the medial temporal lobe (MTL), temporal lobe, and neocortex (7). However, these methods may overlook tau outside the meta-ROIs and underestimate focal tau depositions.
In this study, we followed visual rating criteria that relied on the density and distribution of tau identified using the Food and Drug Administration (FDA)–approved radiotracer 18F-flortaucipir (Tauvid; Lilly) for AD tau pathology at the B3 level (Braak stages V and VI) (8). These criteria consider focal tau deposition and could overcome the limitations of the meta-ROI–based methods. We hypothesized that a machine learning (ML) model can be developed to identify tau PET–positive scans by incorporating the visual ratings that account for the spatial heterogeneity of tau to achieve improved quantification. We aimed to, first, develop the model on a single-site dataset using regional SUV ratios (SUVRs) and visual assessments as targets and validate it on 2 independent datasets; second, compare this model with temporal, MTL, and neocortical meta-ROIs based on clinical scores and histopathologic staging; and third, develop a summary measure by leveraging spatial heterogeneity captured by the model.
MATERIALS AND METHODS
Study Participants
We included participants who had undergone 18F-flortaucipir tracer tau PET in the Mayo Clinic Study of Aging and Mayo Alzheimer’s Disease Research Center dataset (referred to as Mayo; n = 1,290) (9), the Alzheimer’s Disease Neuroimaging Initiative phase 2 or 3 (ADNI; n = 831), or the Open Access Series of Imaging Studies phase 3 (OASIS-3; n = 430) (10). Individuals with frontotemporal dementia were excluded. The Mayo Clinic Study of Aging is a population-based study in Olmsted County, Minnesota, and the Alzheimer’s Disease Research Center is a longitudinal clinical practice study. Both studies have been approved by the Mayo Clinic and Olmsted Medical Center Institutional Review Boards. The ADNI initiative was launched in 2003 with the primary goal of testing whether serial MRI, PET, other biologic markers, and clinical and neuropsychological assessment can be combined to measure progression of mild cognitive impairment (MCI) and AD (www.adni-info.org). OASIS-3 is a longitudinal study of cognitively normal individuals at various stages of cognitive decline who have undergone MRI and PET (https://www.oasis-brains.org/).
Image Acquisition and Preprocessing
In Mayo, ADNI, and OASIS-3, 370 MBq of 18F-flortaucipir were administered, with acquisition times varying: Mayo had a 20-min acquisition at 80 min after injection (11), whereas ADNI and OASIS-3 had a 30-min acquisition between 75 and 105 min after injection.
The tau PET scans were rigidly coregistered to corresponding T1-weighted MRI scans, and median values were taken for each region. The MRI scans were initially tissue-class–segmented and divided into atlas regions using the MCALT-ADIR122 atlas (12). Cortical and subcortical regions were referenced to the cerebellar crus median uptake to form SUVR units. These regional SUVR units were used both to form the meta-ROIs and as inputs to our ML models.
Visual Assessment of Tau PET Scans
Three trained raters independently visually assessed tau PET images scaled to average counts in a 2-dimensional cerebellum ROI. FDA-approved official criteria for visual assessment were followed (8). A positive scan was one with increased neocortical tracer uptake isolated to the posterolateral temporal or occipital or parietal/precuneus regions with or without frontal activity. A negative scan was one with no increased neocortical activity or increased neocortical activity isolated to the mesial temporal, anterolateral temporal, or frontal regions (Fig. 1).

Visual assessment of tau PET scans used in study. Elevated signals are shown in color. Upper contrast value (UCV) for each participant was calculated from scaled mean cerebellar counts adjusted to match desired levels of color transitions.
Tau PET Status Using Meta-ROIs
The temporal meta-ROI (cut point, 1.23 SUVR) was the voxel-weighted average of the median uptake in the entorhinal, amygdala, parahippocampal, fusiform, inferior temporal, and middle temporal regions normalized to the median uptake of the cerebral crus gray matter region used as reference (7). MTL (cut point, 1.30 SUVR) was the unweighted average of MTL tau PET uptake in the left and right entorhinal cortex and amygdala, and the neocortical meta-ROI (cut point, 1.37 SUVR) was the voxel-weighted average in the left and right middle temporal and inferior temporal gyri (13).
Training and Interpreting the ML Model
The model inputs were regional SUVRs, whereas the targets were binary visual ratings. The Mayo dataset was used for training, with 80% (n = 1,038) for training and 20% (n = 252) for testing, partitioned using stratified splitting (Supplemental Fig. 1; supplemental materials are available at http://jnm.snmjournals.org). External validation was done on ADNI and OASIS-3.
A multilayer stack ensemble ML technique using repeated k-fold bagging was applied to train the models (AutoGluon, version 0.8.2) (14). Shapley additive explanation (SHAP), which is a model-agnostic explainable AI technique that calculates input contributions to the model predictions, was used to explain our models (15). SHAP was chosen because of its better performance as reported previously (16).
Developing the Tau Summary Measure THETA (Tau Heterogeneity Evaluation in Alzheimer’s Disease)
We developed a novel tau summary measure, THETA (https://github.com/ADIR-Lab/THETA), calculated as a linear combination of 2 parts: the sum of the SHAP ( ) values of the model input SUVRs (
 ), and the weighted sum of the inputs with their SHAPs that fall within the first and 99th percentiles (
 ) (Eq. 1). SHAPs represent the individual contribution of each brain region (i) to the model’s prediction. The first part captures overall feature importance by summing the SHAP values (
 ) across m number of regions. It sums up to the predicted binary classification as a consequence of the property of SHAP (15). The second part (
 ) focuses on the weighted contribution of the brain regions whose SHAPs fall within the percentile range. This part scales the SUVRs on the basis of their importance for classification and can be important for encoding disease heterogeneity:
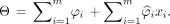 Eq. 1
Eq. 1
The intuition behind Equation 1 was such that THETA can express the degree of tau deposition quantitatively while accounting for tau spatial heterogeneity. For example, in visually tau-positive concordant Mayo cases, regional THETA values were higher for mid-temporal and inferior temporal regions in most participants because they displayed a typical AD tau deposition pattern and their rankings clearly showed spatial spread (Supplemental Fig. 2). In these participants, the first part summed up to one and the second component positively weighted the mid-temporal and inferior temporal regions. This becomes useful when, for example, the inferior temporal region is important in 2 concordant cases differing only by their degree of tau PET SUVR. In such a scenario, THETA could appropriately reflect the degree of tau deposition.
Lastly, the repeatability of THETA was assessed, and a high degree of agreement was found when compared with scores generated by various ML models (Supplemental Fig. 3).
Statistical Analysis
Model performance was evaluated using metrics such as the Matthew correlation coefficient, balanced accuracy, precision, recall, and the F1 score. The classification was assessed using area under the receiver operating characteristic curve (AUC), and curves were compared using the DeLong AUC nonparametric paired test. True-positive and true-negative rates were used to assess misclassification rates. The Spearman ρ accompanied by the Choi nonparametric test was used to analyze correlation. The separation between tau positives and tau negatives was examined using Cohen d and 2-tailed independent-samples t testing with Bonferroni adjustment.
RESULTS
Characteristics of Study Population
In the Mayo cohort (average age, 67 y [SD, 14 y]), 55% were male and 74% were cognitively unimpaired (CU); in ADNI (average age, 72 y [SD, 8 y]), 48% were male and 55% were CU; and in OASIS-3 (average age, 70 y [SD, 8 y]), 43% were male and 86% were CU (Table 1). There was overall sample variability in tau status, with 19% of visibly tau-positive cases in Mayo, 28% in ADNI, and 14% in OASIS-3. Additionally, MTL and neocortical tau positives were 14% for Mayo, 20% for ADNI, and 11% for OASIS-3 (Table 1).
Population Characteristics
Model Trained on Visual Ratings for Predicting Tau Positivity
After multiple cross-validation runs, the best model based on its highest F1 score was selected. This model showed excellent balanced accuracy, achieving scores of 98.58% during training and 95.43% during testing on the Mayo dataset. It also performed well on the ADNI and OASIS-3 datasets, with scores of 87.74% and 87.03%, respectively.
Tau status was classified with AUCs of 1.00, 0.96, and 0.94 on the Mayo, ADNI, and OASIS-3 datasets (Fig. 2; Table 2).

Classification performance of model in all 3 datasets and comparison to meta-ROIs in test set and whole dataset.
Models Trained on Mayo and Validated on ADNI and OASIS-3
Model Performance in Comparison to Meta-ROIs
The meta-ROIs classified tau positivity with an AUC of 0.99 in the Mayo test set (20%) and 0.94 overall (Fig. 2). The model outperformed the meta-ROIs in the Mayo dataset, with the lowest misclassification rates for both tau-positive and tau-negative cases (3.67% and 0.48%, respectively). In the ADNI dataset, the temporal meta-ROI showed the least tau-positivity misclassification (6.96%). In the OASIS-3 dataset, the model misclassified tau negatives at the lowest rate (1.36%) but was second best in tau-positive misclassification (24.59%), surpassed by the temporal meta-ROI (18.03%) (Table 3).
Comparison of Meta-ROIs and ML Model
THETA
Quantification of Spatial Heterogeneity in Tau PET Scans
We demonstrate tau spatial heterogeneity captured by THETA in 2 subpopulations: discordant and concordant. The discordant group included cases in which the visual rating disagreed with one or more of the meta-ROI classifications, whereas the concordant group included cases in which both methods agreed (Fig. 3).

Examples of concordant groups (with agreement between visual rating and meta-ROIs) (A and B) and discordant groups (C and D). Although meta-ROIs can miss visually positive scans in which SUVR is lower than cut point (C), visual assessment does not consider isolated increased activity in MTL (D). Arrows indicate increased tracer uptake. Aβ = β-amyloid.
THETA’s formulation accurately reflected the heterogeneous contributions of all regions in the discordant cases having mild signals and similar regional contributions. In this group, the input contributions were distributed among different regions rather than being focused specifically on the meta-ROIs (Supplemental Figs. 2 and 4). In the tau-positive concordant cases, our ML model’s hot-spot regions were the top predictors that constituted the meta-ROIs. In these cases, THETA maintained the importance of top regions, preserving spatial heterogeneity.
Association of THETA with Clinical Disease Severity Markers
THETA correlated with the Mini-Mental State Examination significantly better than all meta-ROIs for the Mayo dataset based on the Choi nonparametric test of Spearman correlations (THETA ρ = −0.45, meta-ROIs ρ ≥ −0.36, Choi P < 0.05) (Fig. 4). For the ADNI dataset, the correlation of THETA with the Mini-Mental State Examination was significantly better than the neocortical and temporal meta-ROIs (THETA ρ = −0.37, neocortical and temporal ρ = −0.31, P < 0.05). THETA did not significantly correlate with the Clinical Dementia Rating–Sum of Boxes compared with the meta-ROIs in the Mayo and OASIS-3 datasets but correlated significantly with the neocortical and temporal meta-ROIs in ADNI (THETA ρ = 0.46, meta-ROIs ρ ≥ 0.36, Choi P < 0.05). A similar pattern of association with clinical indices was also observed in Mayo-concordant groups. However, in Mayo-discordant groups, THETA demonstrated a significantly negative correlation with the Mini-Mental State Examination (THETA ρ = −0.43, meta-ROIs ρ ≥ −0.07, Choi P < 0.05) and a significantly positive correlation with the Clinical Dementia Rating–Sum of Boxes (THETA ρ = 0.37, meta-ROIs ρ = 0.05, Chois P < 0.05) compared with the meta-ROIs (Fig. 5).

Comparison of meta-ROIs and THETA to clinical measures (Mini-Mental State Examination [MMSE] and Clinical Dementia Rating–Sum of Boxes [CDR-SB]). Tau negativity (T-) and tau positivity (T+) are visual assessments, and meta-ROI cut points are shown by dotted vertical lines. OASIS-3 results are shown in Supplemental Figure 6.

Comparison of meta-ROIs and THETA to clinical measures (Mini-Mental State Examination [MMSE] and Clinical Dementia Rating–Sum of Boxes [CDR-SB]) for discordant and concordant Mayo groups. Discordant groups showed disagreement between visual rating and meta-ROIs, whereas concordant groups showed agreement between visual and meta-ROI methods. Tau negativity (T-) and tau positivity (T+) are visual assessments, and meta-ROI cut points are shown by dotted vertical lines.
Separation of Tau-Positive from Tau-Negative Scans
THETA provided greater separation between visually tau-positive and -negative cases, a characteristic attributed to its development from a model trained on the binary visual ratings; however, the meta-ROIs did not provide greater separation either according to visual classifications or according to their respective cut points (Fig. 4).
When THETA was compared with the temporal meta-ROI across various clinical diagnostic outcomes, the separation between tau-positive and tau-negative cases was similar for AD dementia cases. However, for CU and MCI, there was an overlap in tau status for the temporal meta-ROI, whereas THETA showed better separation between cases (Fig. 6). For instance, in ADNI, the difference between tau-positive and tau-negative temporal meta-ROI values for CU and MCI participants had an effect size of 3.08 (t = 16.50, P < 0.001) and 2.23 (t = 16.76, P < 0.001), respectively. THETA showed a larger effect size of 10.09 (t = 54.09, P < 0.001) and 6.83 (t = 51.36, P < 0.001), respectively (Fig. 6).

Comparison of temporal meta-ROI and THETA in diagnostic groups (CU, MCI, and AD dementia). Tau negativity (T-) and tau positivity (T+) are based on visual assessment. ns = not statistically significant.
Association of THETA with Braak Staging
Mayo participants with Braak staging (I–VI) (n = 90) were included for histopathologic validation of THETA (Supplemental Table 3). The association of THETA with Braak staging was similar to the meta-ROIs (ρ = 0.87 for THETA, P < 0.05 vs. P ≤ 0.83; P < 0.05 for meta-ROIs). However, improved separation of clinical diagnostic groups was observed in THETA compared with the meta-ROIs (Fig. 7).

Association of meta-ROIs and THETA to Braak stages. Cut points are shown by dotted lines. NEO = neocortex.
DISCUSSION
Tau pathology, as captured by tau PET scans, is a key indicator of disease severity in AD (17). Current tau PET quantitative techniques have limitations in addressing the heterogeneity of tau deposition because they focus on regions with typically high tau uptake while ignoring the spatial variance of tau burden. Using visual assessment by 3 raters as the gold standard in a large single-site dataset (Mayo), we developed an ML model to accurately classify tau PET scans. We then validated our model in 2 independent datasets (ADNI and OASIS-3) and developed a summary metric, THETA, to consider tau SUVRs across the entire brain and map well to disease progression. The clinical validations showed that THETA was better associated with indicators of cognitive impairment, provided a greater magnitude of separation between clinical diagnosis groups, and was better associated with AD pathology-based staging than are meta-ROIs.
The FDA approved 18F-flortaucipir for detecting neurofibrillary tangles at Braak stages V and VI (8). Effective quantification of tau PET has paramount importance as it leads to more sensitive assessments of disease severity. Given that visual evaluation is a clinically accepted practice, a model incorporating multirater assessment as a gold standard can be sensitive in identifying positive scans. Moreover, using such a model to develop a summary metric can be beneficial. Our work takes advantage of this model to accurately quantify tau PET scans using regional SUVRs to address heterogeneous tau deposition across the entire brain.
Our results show that THETA mapped onto clinical diagnostic and cognitive indices comparably to or better than meta-ROIs while retaining pattern-based information. This was further examined by inspecting the feature importance of participants with neocortical versus MTL tau positivity. For participants with neocortically dominant tau positivity, the inferior temporal cortex was the top predictor, whereas in participants with MTL tau positivity—a region notably affected by tau deposition—the entorhinal cortex was a key predictor (Supplemental Fig. 4). Furthermore, THETA demonstrated a clearer separation of clinical diagnoses at higher Braak stages (V and VI) better than the meta-ROIs. Given that a higher Braak stage is not always associated with cognitive decline, particularly in resilient groups (16), THETA effectively filtered out higher Braak (V) tau-negative CU participants, indicating its utility to quantify tau burden and better associate with clinical diagnosis (Fig. 7). Nonetheless, the histopathology sample used here was small, and further studies are needed to investigate the utility of THETA in identifying resilient and resistant groups.
Meta-ROIs and visual ratings have different approaches to measuring tau pathology. Meta-ROIs focus on the entorhinal cortex, which can overestimate tau positivity, whereas visual assessments can miss isolated tau in the MTL and anterolateral temporal lobe (18). Visual assessments offer the possibility of assessing tau burden throughout the brain and can be superior because the meta-ROIs rely on specific regions. Nonetheless, we found in our Mayo cohort that all 3 meta-ROIs underperformed in the visual identification of tau-positive cases. The neocortical meta-ROI’s true negative rate was consistent across all 3 datasets, whereas the MTL did better in the identification of true negatives in Mayo and decreased in performance in ADNI and OASIS-3.
This study had some strengths and limitations. A strength is that both the ML model and THETA were validated on 2 independent datasets. A limitation is that visual assessment was FDA-approved specifically for moderate to higher levels of tau. Although this method ensures exclusion of off-target binding, the trained model could be less sensitive to early tau changes. Further studies are needed to assess the effectiveness of THETA to identify early tau changes. Another limitation is that the model’s performance was lower for the ADNI and OASIS-3 validation sets because of cohort differences. However, combining them and training a new model achieved a balanced accuracy of more than 94% and an AUC of more than 0.99 (Supplemental Table 4; Supplemental Fig. 5). Finally, THETA exhibits sensitivity for visual tau positives, which can be a strength or a limitation. A longitudinal sensitivity analysis found no significant difference in performance from meta-ROIs (Supplemental Fig. 6). Lastly, changing the cut points for meta-ROIs could change the results presented for the meta-ROIs.
CONCLUSION
We were able to develop an ML model to predict tau status on single-site data and validate it on external datasets. We also developed a tau summary measure, THETA, which captured the spatial heterogeneity of tau and showed higher sensitivity to clinical disease severity. Overall, this study provided promising results for using ML to improve the detection and quantification of tau pathology in AD.
DISCLOSURE
Support was received from a Mayo Clinic Radiology Research fellowship; NIH grants R01 NS097495, R01 AG056366, U01 AG006786, P50 AG016574, RF1AG069052, UF1NS125417, R37 AG011378, R01 AG041851, R01 AG073282, NIH P30 AG066444, P50 AG00561, P30 NS09857781, P01 AG026276, P01 AG003991, R01 AG043434, UL1 TR000448, and R01 EB009352; a GHR Foundation grant; the Alexander Family Alzheimer’s Disease Research Professorship of Mayo Foundation; the Elsie and Marvin Dekelboum Family Foundation U.S.A.; Opus building NIH grant C06 RR018898; and Rochester Epidemiology Project (REP) medical records–linkage system resources, supported by the National Institute on Aging (NIA; AG 058738), by the Mayo Clinic Research Committee, and by fees paid annually by REP users. Data collection and sharing for this project were funded by the ADNI (NIH grant U01 AG024904) and DOD ADNI (Department of Defense award W81XWH-12-2-0012). The ADNI is funded by the National Institute on Aging, by the National Institute of Biomedical Imaging and Bioengineering, and through generous contributions from AbbVie, the Alzheimer’s Association, the Alzheimer’s Drug Discovery Foundation, Araclon Biotech, BioClinica, Inc., Biogen, Bristol-Myers Squibb Company, CereSpir, Inc., Cogstate, Eisai Inc., Elan Pharmaceuticals, Inc., Eli Lilly and Company, EuroImmun, F. Hoffmann-La Roche Ltd. and its affiliated company Genentech, Inc., Fujirebio, GE Healthcare, IXICO Ltd., Janssen Alzheimer Immunotherapy Research & Development, LLC, Johnson & Johnson Pharmaceutical Research & Development LLC, Lumosity, Lundbeck, Merck & Co., Inc., Meso Scale Diagnostics, LLC, NeuroRx Research, Neurotrack Technologies, Novartis Pharmaceuticals Corporation, Pfizer Inc., Piramal Imaging, Servier, Takeda Pharmaceutical Company, and Transition Therapeutics. The Canadian Institutes of Health Research is providing funds to support ADNI clinical sites in Canada. Private sector contributions are facilitated by the Foundation for the National Institutes of Health (www.fnih.org). The grantee organization is the Northern California Institute for Research and Education, and the study is coordinated by the Alzheimer’s Therapeutic Research Institute at the University of Southern California. ADNI data are disseminated by the Laboratory for Neuro Imaging at the University of Southern California. The funders had no role in the design or conduct of the study. No other potential conflict of interest relevant to this article was reported.
KEY POINTS
QUESTIONS: Can an ML model trained using visual ratings identify positive tau PET scans and aid in developing a summary metric that considers spatial heterogeneity?
PERTINENT FINDINGS: Our model, trained on a single-site cohort, was accurate in classifying tau-positive status and was able to generalize well to external cohorts. The summary metric THETA was able to associate with clinical cognitive markers, clinical diagnoses, and histopathology comparably to or better than meta-ROIs.
IMPLICATIONS FOR PATIENT CARE: Our model and THETA can enhance information extracted from tau PET for improved clinical diagnoses, disease progression tracking, AD subtyping, and identification of therapeutic targets, for better personalized and effective patient care.
ACKNOWLEDGMENTS
Data used in preparation of this article were obtained from the ADNI database (adni.loni.usc.edu). As such, the investigators within the ADNI contributed to the design and implementation of the ADNI or provided data but did not participate in analysis or writing of this report. A complete listing of ADNI investigators can be found online (https://adni.loni.usc.edu/wp-content/uploads/how_to_apply/ADNI_Acknowledgement_List.pdf). We acknowledge Valentina Garibotto, Isminni Mainta, Valle Camacho, Martijn van Essen, Andrés Perissinotti, Omar Rodríguez, and Kohl L. Johnson Sparman for visually rating some participants. We thank AVID Radiopharmaceuticals, Inc., for its support in supplying the AV-1451 precursor, for chemistry production advice and oversight, and for the needed FDA regulatory cross-filing permission and documentation. Data were provided in part by OASIS-3_AV1451; the longitudinal multimodal neuroimaging principal investigators were Tammie L.S. Benzinger, Daniel Marcus, and John C. Morris; NIH P30 AG066444, AW0000993; AV-1451 doses were provided by Avid Radiopharmaceuticals, a wholly owned subsidiary of Eli Lilly.
Footnotes
Published online Jul. 25, 2024.
- © 2024 by the Society of Nuclear Medicine and Molecular Imaging.
REFERENCES
- Received for publication December 25, 2023.
- Accepted for publication June 25, 2024.
In this issue


Jump to section
Related Articles
Cited By...
- No citing articles found.