


Article Figures & Data
Figures
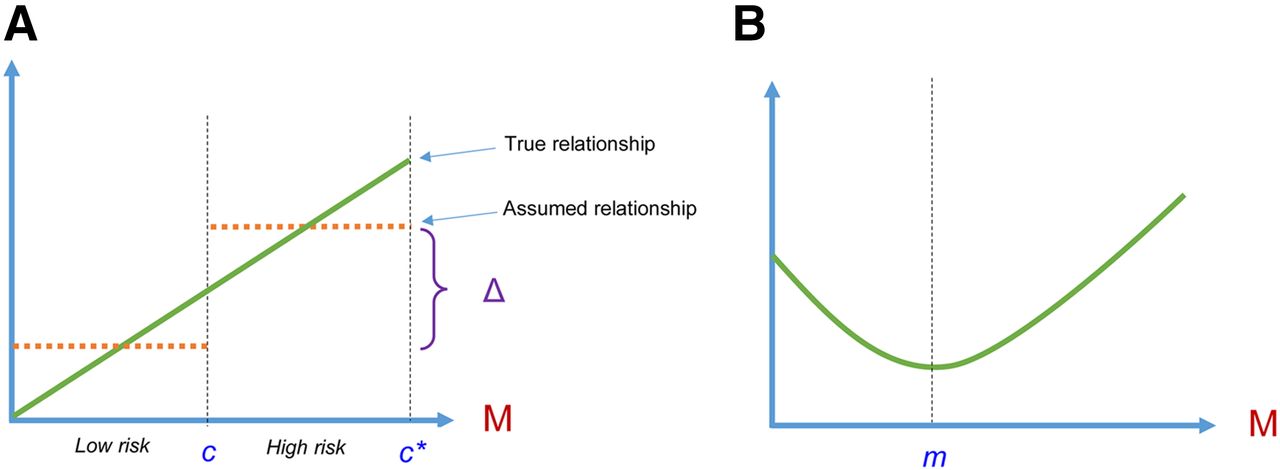
- FIGURE 1.
Hypothetical relationship between biomarker M and clinical outcome. (A) Green line depicts linear relationship between biomarker and outcome. Risk of outcome increases linearly with increasing biomarker values. Dashed lines illustrate effect of dichotomizing biomarker, assuming that discontinuity in risk occurs at cut point c (patients whose biomarker values are below cut point are conferred the same risk, which is lower by magnitude Δ than that conferred to patients whose biomarker values exceed cut point). c* represents the biomarker value of a patient whose true risk is highest in the high-risk subgroup. (B) Quadratic relationship between biomarker and outcome. Risk of outcome decreases with biomarker up to point m and increases linearly after m.
- FIGURE 2.
Dichotomy of continuous biomarker (NLR example). (A) Nonlinear relationship between NLR and patient survival in Mayo Clinic triple-negative breast cancer dataset using restricted spline method. (B) Effect of dichotomizing NLR at its sample median. Association between NLR and survival is no longer significant (log-rank P = 0.27). AIC = Akaike’s information criterion; L.R. = likelihood ratio.
- FIGURE 3.
Minimal-P-value approach (NLR example). (A) Highly unstable P values of log-rank test as function of cut point used for NLR in Mayo Clinic triple-negative breast cancer dataset. Top and bottom 20% of NLR values were excluded, and 200 cut points were used. (B) Strong inverse correlation between estimated HRs and log-rank P values for NLR in Mayo Clinic triple-negative breast cancer dataset. Smallest P value corresponds to most extreme HR estimate.
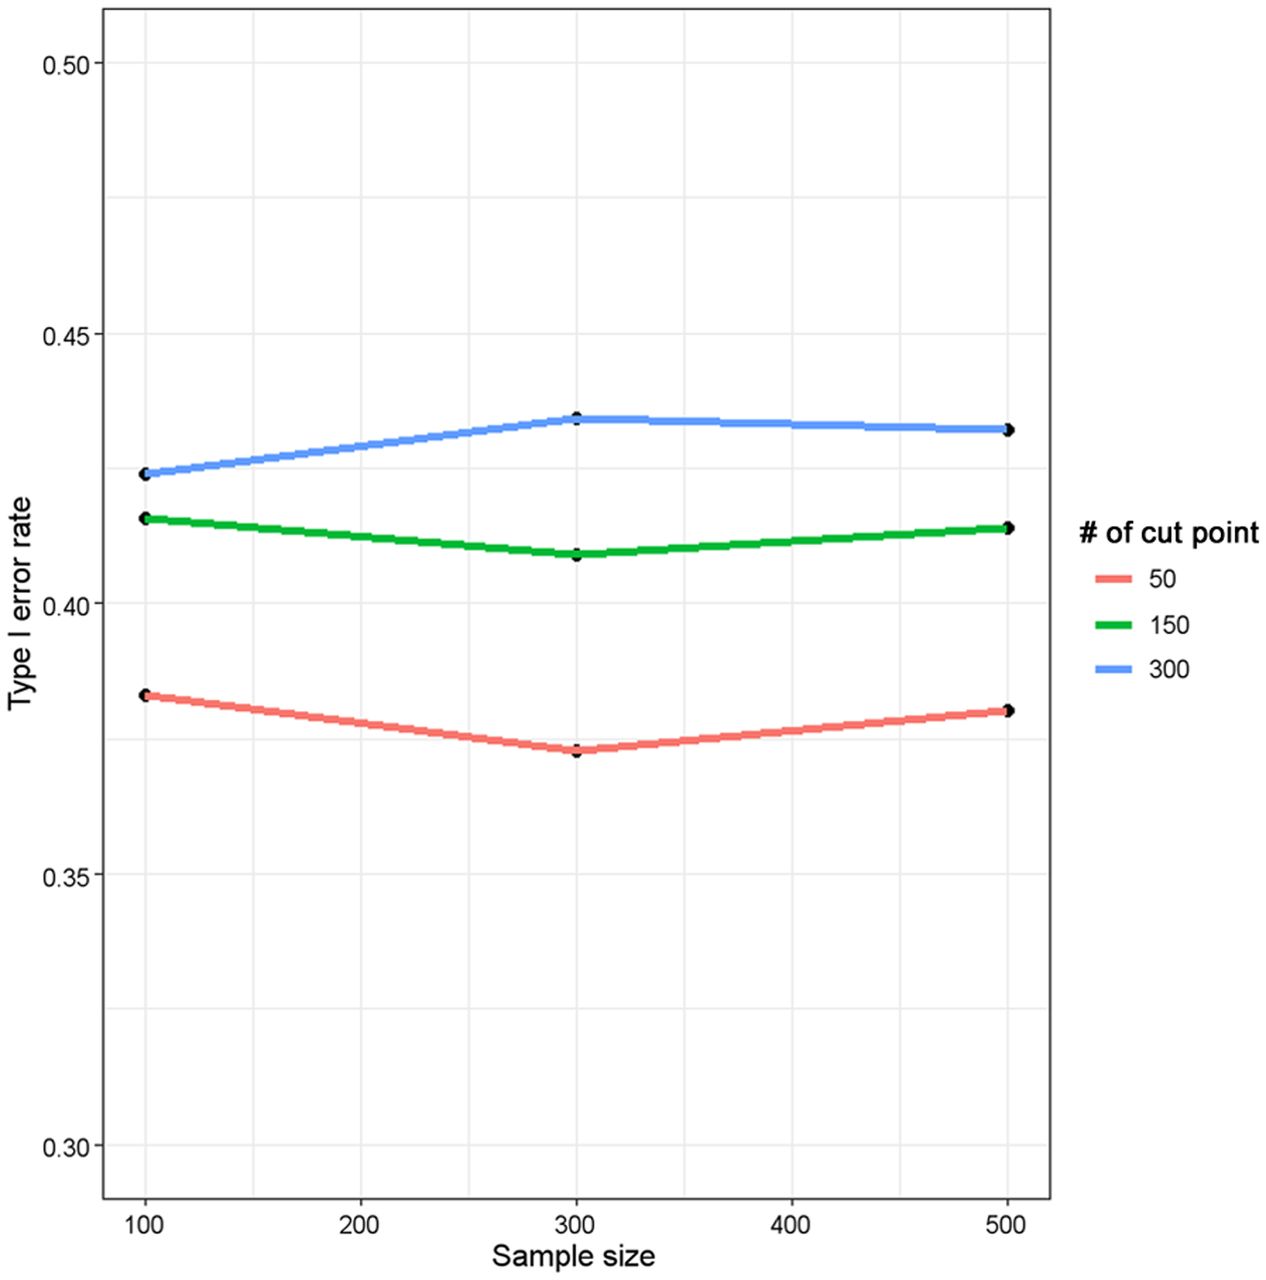
- FIGURE 4.
Type I error inflation as function of number of cut points and sample size using minimal-P-value approach. In each simulation, 10% of smallest and largest biomarker values were not considered as potential cut points. Two-sided P value from log-rank test was computed for each cut point applied. Each plotted point represents percentage of 5,000 simulations for which minimal P value is less than nominal 5% level based on assumption that there is no association between biomarker and time-to-event outcome (i.e., type I error). No censoring in outcome was assumed.
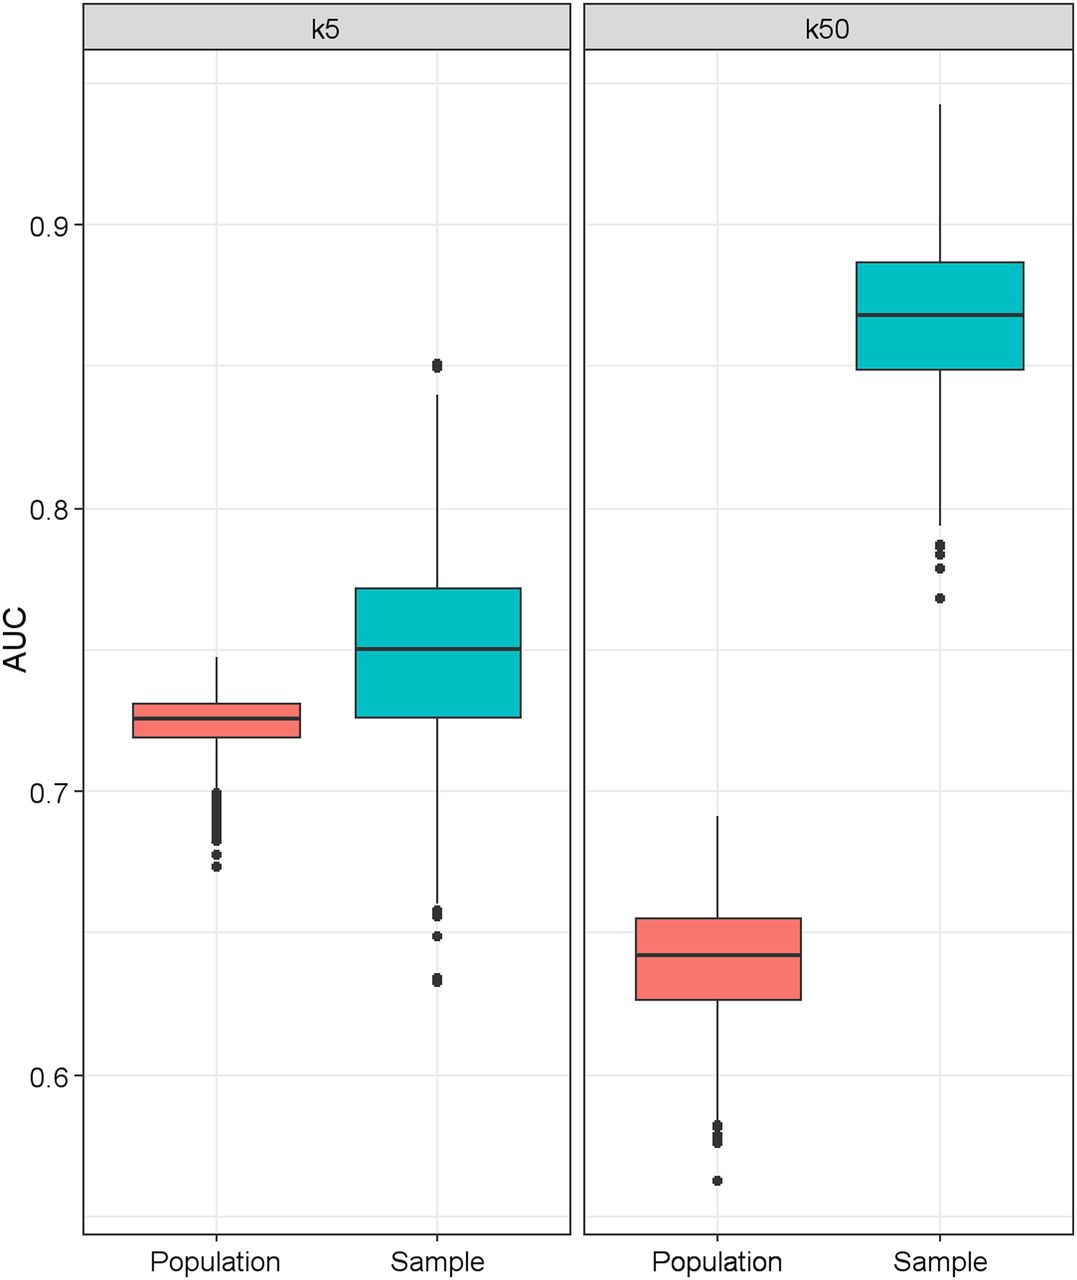
- FIGURE 5.
Effect of number of covariates (k) in risk model on resubstitution bias in AUC. Population box plot represents true AUC distribution in interested population at large. Sample box plot represents distribution of AUC derived from sample dataset used to construct risk model. Each box plot was based on 1,000 simulations. When k = 5, there is slight upward (optimistic) bias in sample AUC distribution compared with true population. Degree of optimistic bias increases drastically when k increases to 50.
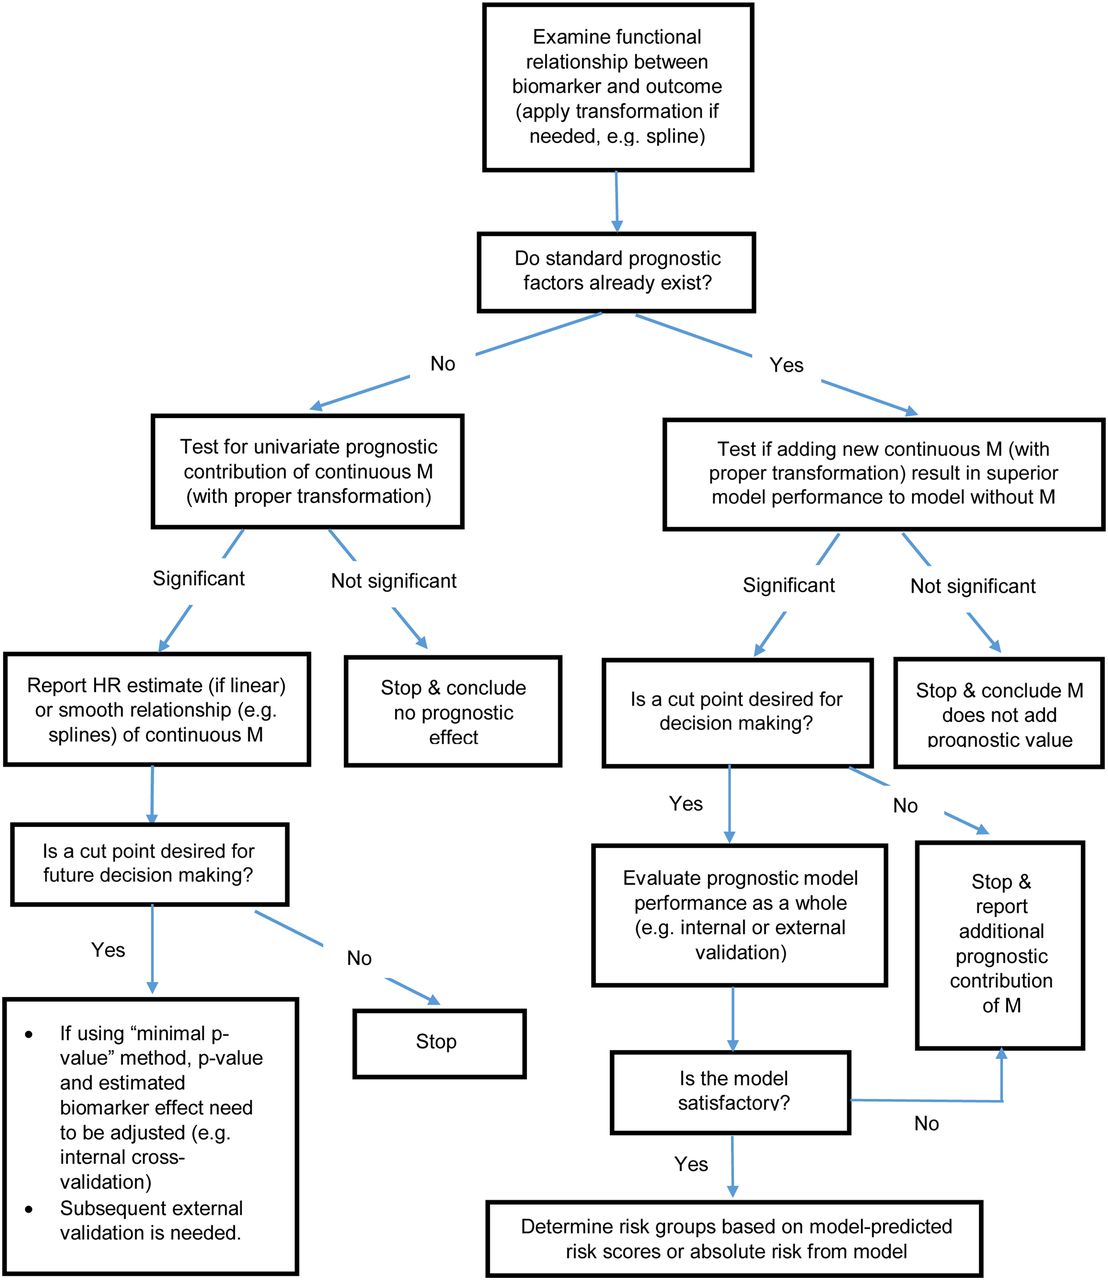
- FIGURE 6.
Schema for biomarker cut point analysis and evaluation.


