


Visual Abstract

Abstract
11C-UCB-J ((R)-1-((3-(11C-methyl-11C)pyridin-4-yl)methyl)-4-(3,4,5-trifluorophenyl)pyrrolidin-2-one) is a PET tracer for synaptic vesicle glycoprotein 2A, which may be a marker of synaptic density. To simplify the scan protocol, SUV ratios (SUVRs) were compared with model-based nondisplaceable binding potential (BPND) to select the optimal time window in healthy and neuropsychiatric subjects. Methods: In total, 141 scans were acquired for 90 min. Arterial blood sampling and metabolite analysis were conducted. SUVR-1 (centrum semiovale reference region) was computed for six 30-min windows and compared with 1-tissue-compartment model BPND. Simulations were performed to assess the time dependency of SUVR-1. Results: Greater correlation and less bias were observed for SUVR-1 at later time windows for all subjects. Simulations showed that the agreement between SUVR-1 and BPND is time-dependent. Conclusion: The 60- to 90-min period provided the best match between SUVR-1 and BPND (−1% ± 7%); thus, a short scan is sufficient for accurate quantification of 11C-UCB-J–specific binding.
PET imaging with 11C-UCB-J ((R)-1-((3-(11C-methyl-11C)pyridin-4-yl)methyl)-4-(3,4,5-trifluorophenyl)pyrrolidin-2-one) has enabled visualization of the synaptic vesicle protein 2A in vivo in humans and may provide a quantitative measurement of synaptic density. Synaptic vesicle protein 2A imaging with 11C-UCB-J revealed lower synaptic density in temporal lobe epilepsy (1), Alzheimer’s disease (AD) (2), major depressive disorder (3), and Parkinson’s disease (4). In humans, 11C-UCB-J displayed high brain uptake and fast kinetics with excellent test–retest reproducibility (3%–9%) for volume of distribution (VT) calculated by the 1-tissue-compartment model (5). However, quantification with the 1-tissue-compartment model requires arterial blood sampling and a PET scan of at least 60 min. To simplify the scan protocol, we evaluated 2 ratios, tissue to plasma (TTP) and tissue to reference (i.e., standardized uptake value ratio, SUVR), for quantification against the gold standard parameters VT and nondisplaceable binding potential (BPND), respectively, in healthy subjects (HSs) and neuropsychiatric subjects (NSs). A previous study on 10 HSs (6) showed that a window of 60–90 min was best for SUVR-1 (centrum semiovale reference region). Here, we expanded on that study using much larger HS and NS groups.
MATERIALS AND METHODS
Human Subjects
This study included 141 subjects, comprising 51 HSs (33 men and 18 women; mean age ± SD, 48 ± 17 y; body mass index [BMI], 27 ± 5) and 90 NSs (59 men and 31 women; age, 42 ± 15 y; BMI, 28 ± 5): 11 with AD, 5 with epilepsy, and 74 with other types of neuropsychiatric disorders (Supplemental Table 1; supplemental materials are available at http://jnm.snmjournals.org). The study protocols were approved by the Yale Human Investigation Committee, the Yale–New Haven Hospital Radiation Safety Committee, or the Yale Radioactive Drug Research Committee and were performed in accordance with federal guidelines and the regulations of the United States for the protection of human research subjects, as described in title 45, part 46, of the Code of Federal Regulations. All subjects signed an informed consent form. As part of the subject evaluation, MR images were acquired for all subjects to eliminate those with significant anatomic abnormalities not consistent with their illness and for PET image registration.
Data Acquisition
11C-UCB-J was prepared as described previously (7). All subjects underwent 90-min PET scans on a High Resolution Research Tomograph (Siemens Medical Solutions) after a bolus injection of 11C-UCB-J (536 ± 192 MBq, n = 141) over 1 min. Dynamic scan data were reconstructed in 27 frames (6 × 0.5 min, 3 × 1 min, 2 × 2 min, 16 × 5 min) with corrections for attenuation, normalization, scatter, randoms, and dead time using the MOLAR algorithm (motion-compensation ordered-subsets expectation maximization list-mode algorithm for resolution-recovery reconstruction) (8). Motion was corrected using measurements with the Polaris Vicra sensor (NDI Systems), with reflectors mounted on a swim cap worn by the subject. The metabolite-corrected arterial input function was acquired as described previously (5).
Image Registration and Regions of Interest
After registration of the MR images to an averaged PET image, 14 regional time–activity curves were generated for the cerebral cortex (frontal, temporal, occipital, and parietal cortices; insula; and cingulum), subcortical regions (hippocampus, caudate, putamen, pallidum, thalamus, and hypothalamus), cerebellum, and centrum semiovale (2,9) using the combined transformations from template-to-PET space (5).
Quantitative Analysis
The 1-tissue-compartment model was applied to regional time–activity curves (90 min) to estimate VT and BPND. The centrum semiovale was used as the reference region (1). TTP and SUVR-1 were computed as the ratio of the average values across frames in each time window (10–40, 20–50, 30–60, 40–70, 50–80, and 60–90 min) for comparison with VT and BPND, respectively. The optimal window was selected by comparing the percentage difference (pd) between SUVR-1 and BPND across all HSs and all NSs.
To assess whether the relationship between SUVR and BPND was affected by demographics, age, sex, or BMI, interactions with the pd between SUVR-1 and BPND were assessed with analysis of covariance in HSs.
Subsequently, the performance of the selected time window was evaluated in 2 specific clinical populations. In AD (2), the group differences in hippocampal BPND and SUVR-1 between age-matched subjects (7 HS vs. 9 AD) were assessed; the hippocampus showed the clearest group difference for 11C-UCB-J (2). In epilepsy (1), SUVR-1 and BPND were compared in the ipsilateral and contralateral hippocampus. Between-group differences were computed using t testing for both model-based and simplified measures.
Simulation Study
To investigate the full time dependency of SUVR-1, noise-free data were simulated using the estimated K1 and k2 of all subjects for frontal cortex, hippocampus, and centrum semiovale. A monoexponential clearance rate (β) of the input function (t > 20 min) was estimated to extrapolate the input function (β = 0.0095 ± 0.0023 1/min, n = 141). TTP and SUVR-1 were computed for 45 time windows with 30-min duration, beginning at 10, 20,…, and 4,500 min after injection. TTP and SUVR-1 were compared with the true VT and BPND. In addition, these parameters were compared with their transient equilibrium values (10), that is, the constant TTP and SUVR ultimately reached after a bolus injection. The transient equilibrium VT and BPND were computed using the estimated β and kinetic parameters as VT/(1 − β/k2) and (BPND + 1)(1 − β/k2,REF)/(1 − β/k2) − 1. TTP and SUVR-1 were compared with the true and transient equilibrium VT and BPND, respectively.
Statistical Analysis
Data were expressed as a mean and SD unless otherwise indicated. pd between X and Y was computed as  using all regions and all subjects unless otherwise indicated. Comparisons between 2 groups were performed by t testing and Cohen’s d. In analysis of covariance, age and BMI were used as covariates, sex as an independent variable, and pd as the dependent variable. For all statistical tests, a P value of 0.05 or less was considered significant. Correlations between 2 outcome measures were assessed by Pearson r and linear regression.
RESULTS
BPND Versus SUVR-1
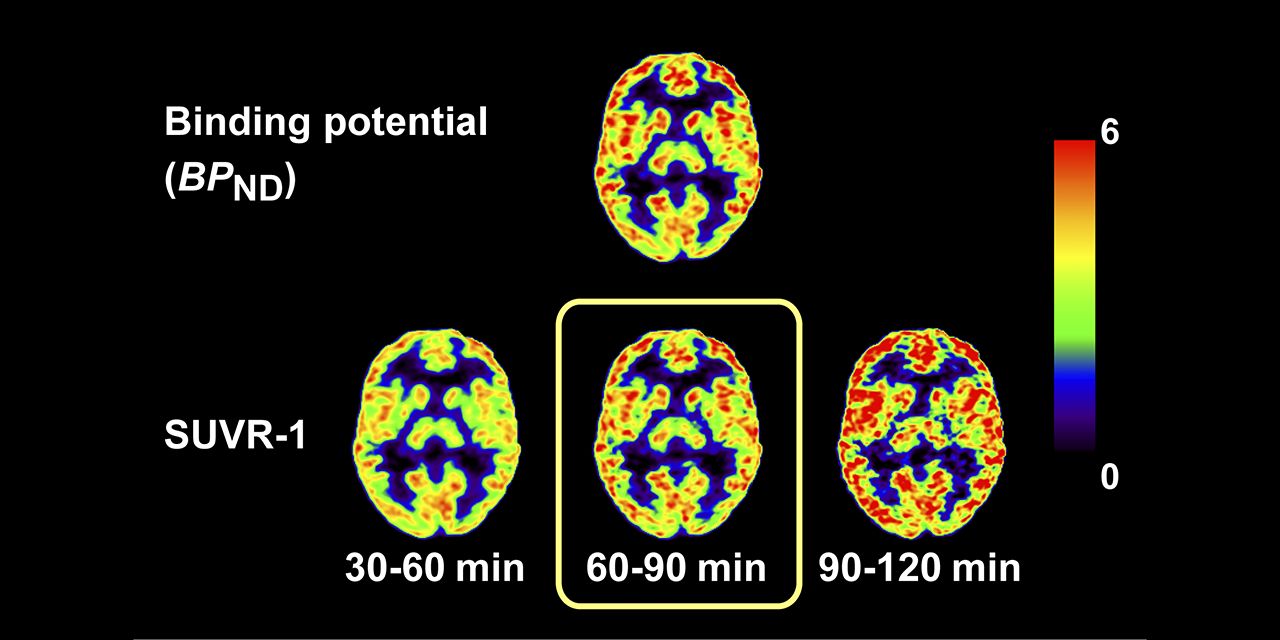
Table 1 shows comparisons of TTP and SUVR-1 in 6 time windows with VT and BPND, respectively, derived from the 90-min scan data in HSs (Fig. 1). pds between TTP and VT and between SUVR-1 and BPND are listed in Table 2. TTP substantially overestimated VT in all time windows, with greater overestimation at later times, as transient equilibrium approached (11). When comparing BPND with SUVR-1, we found the results to be quite different, with the 60- to 90-min window producing excellent agreement based on the regression lines, correlation coefficients, and pds. Corresponding data for NSs are shown in Supplemental Tables 2 and 3.
Linear Correlations and Regression Analyses of TTP vs. VT (90 Minutes) and SUVR-1 vs. BPND (90 Minutes) in HSs (n = 51) Across All Regions
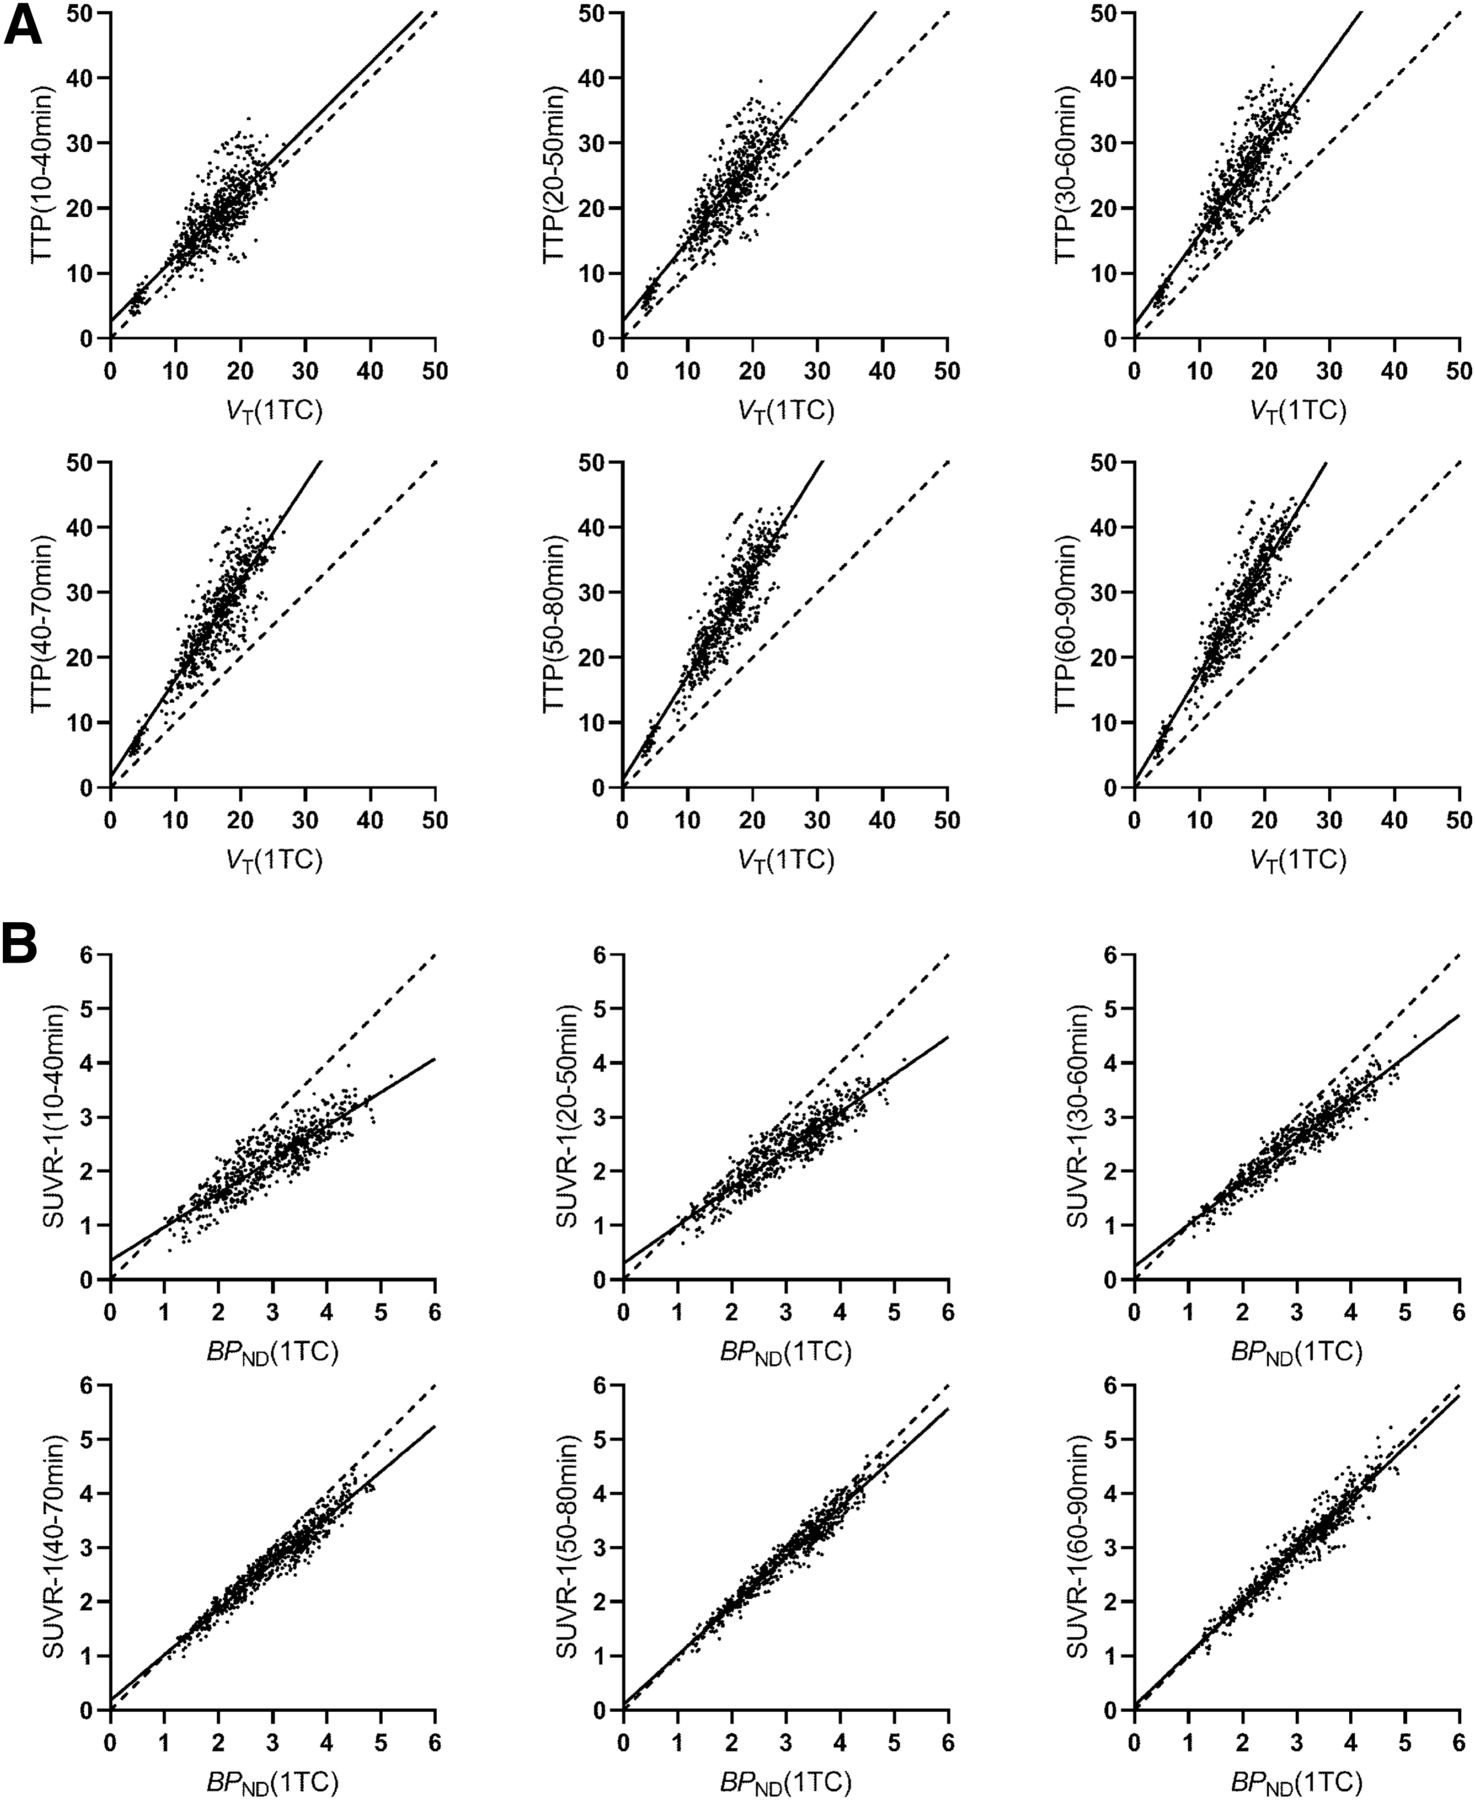
Scatterplots of TTP vs. VT (90 min) (A) and of SUVR-1 vs. BPND (90 min) (B) with regression analysis across all regions in HSs (n = 51). y-axis labels define period for ratio calculation. Table 1 shows regression results. 1TC = 1-tissue-compartment model.
Percentage Difference in TTP vs. VT (90 Minutes) and SUVR-1 vs. BPND (90 Minutes) in HSs (n = 51)
Analysis of covariance revealed that there were no significant effects of age, sex, or BMI on the relative difference between the SUVR-1 (60–90 min) and BPND in HSs.
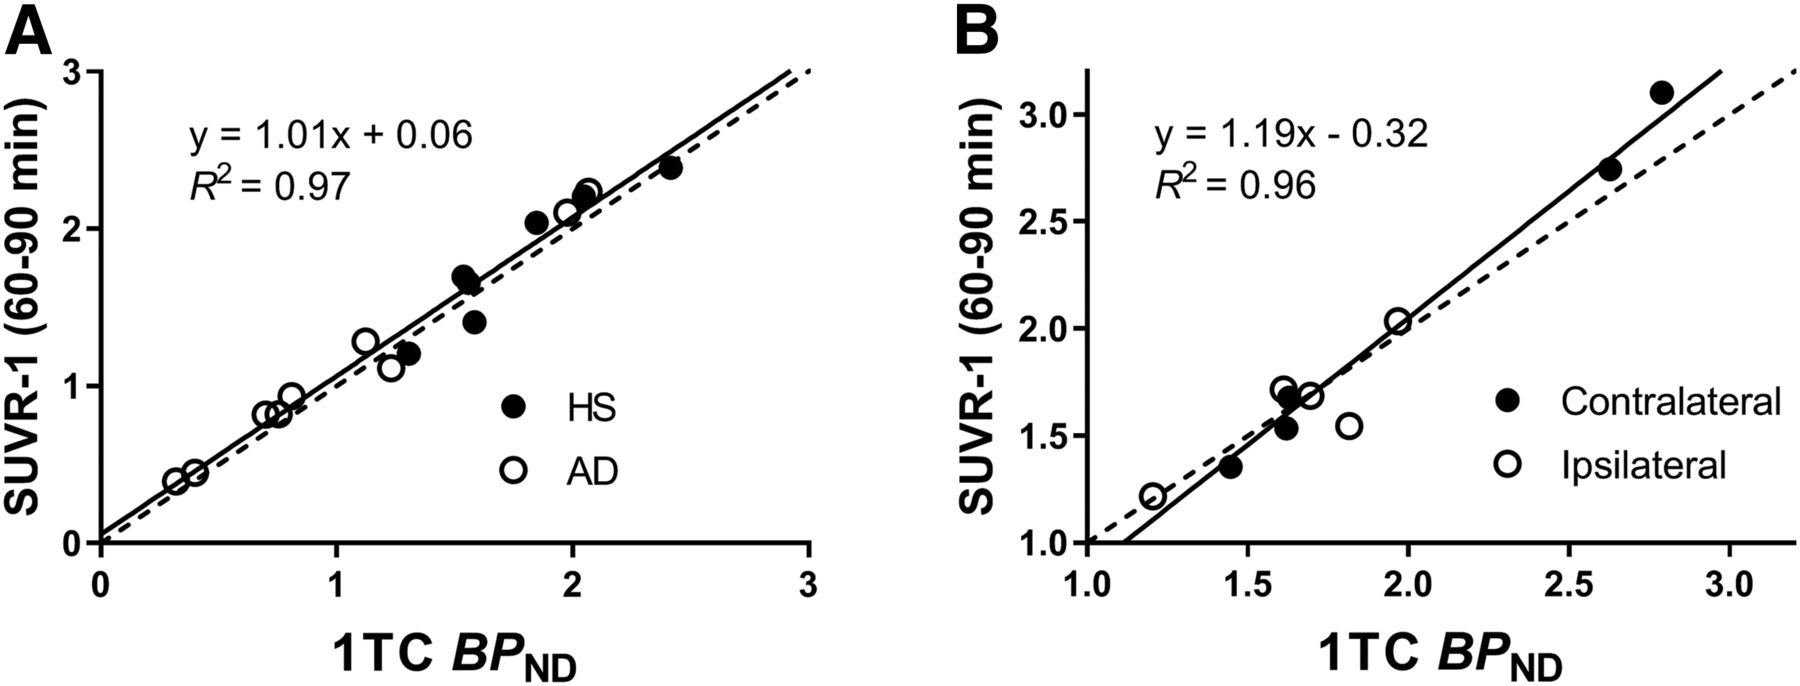
A linear regression analysis was performed in the hippocampus for HSs and ADs (Fig. 2A) and showed excellent agreement. pds between SUVR-1 and BPND in the hippocampus were 2% ± 9% for HSs and 11% ± 9% for ADs. The HS-versus-AD group difference was significant using both SUVR-1 and BPND (SUVR-1: P = 0.035, d = 1.03; BPND: P = 0.019, d = 1.13). A linear regression analysis was also applied to the contralateral and ipsilateral hippocampus regions of epilepsy subjects (Fig. 2B). pds between SUVR-1 and BPND were again small, at 1% ± 7% (contralateral) and −1% ± 8% (ipsilateral). The difference in asymmetry indices [(ipsilateral − contralateral)/(ipsilateral + contralateral) × 2] was −2% ± 6%, which was not significant (P = 0.42, paired t test). Bland–Altman plots are also shown in Supplemental Figure 1.

Scatterplots between 1-tissue-compartment (1TC) BPND and SUVR-1 in hippocampus of HSs and ADs (A) and contralateral and ipsilateral hippocampus of epilepsy subjects (B).
Simulation
Figure 3 and Supplemental Figure 2 demonstrate the effect of time window, plotted as the pd against theoretic values. Transient equilibrium was reached at 210 min in the centrum semiovale, 270 min in the frontal cortex, and 380 min in the hippocampus. At transient equilibrium, TTP overestimated VT by 58% in the centrum semiovale, 93% in the frontal cortex, and 117% in the hippocampus. At 60–90 min, overestimation was similar between cortex (76%) and white matter (74%) (Supplemental Fig. 2), and thus, this overestimation canceled out when computing SUVR-1 (Fig. 3).

Mean ± SD of percentage difference between SUVR-1 and BPND in frontal cortex (A) and hippocampus (B). The 60- to 90-min window is shaded.
DISCUSSION
The goal of this study was to find a simple static time window for the measurements of synaptic density and synaptic vesicle protein 2A with 11C-UCB-J PET. Using tissue ratios (SUVR) and comparing with BPND, the best agreement was achieved in the 60- to 90-min window.
In general, stronger correlations of ratios (TTP and SUVR) with VT and BPND were seen in later time windows. The correlation coefficient between SUVR-1 and BPND did not improve for windows later than 40–70 min. The magnitude of TTP overestimation over VT increased with later time windows, as expected, whereas the magnitude of SUVR-1 underestimation over BPND decreased because of cancellation of the errors between the target and reference regions. The best agreement between SUVR-1 and BPND was achieved in the 60- to 90-min window.
We tested the 60- to 90-min window for the ability of SUVR-1 to distinguish hippocampal binding between the AD and HS groups. Although SUVR-1 from the AD group slightly overestimated BPND, a significant group difference was maintained. We also found a good agreement between SUVR-1 and BPND in the ipsilateral and contralateral hippocampus regions in epilepsy.
Since the pd between SUVR-1 and BPND reduced monotonically from the 10- to 40-min window to the 60- to 90-min window, we simulated a longer time–activity curve to assess the time dependency of SUVR-1. As with many other tracers, simulation results revealed that the agreement between SUVR-1 and BPND is time-dependent and that the pd continues to increase until transient equilibrium is achieved.
For 11C-labeled radiotracers, later time windows tend to generate noisier images and SUVs because of radioactivity decay. However, brain uptake of 11C-UCB-J is very high and remains so even at 60–90 min after injection. For example, the 11C-UCB-J SUV in the centrum semiovale at 60–90 min is higher (1.32 ± 0.30) than the SUV of the amyloid radiotracer 11C-Pittsburgh compound B in the cerebellum at 40–60 min (0.69 ± 0.07) (12) and thus provides statistically useful data.
If there are differences in plasma clearance between subjects, the optimal time window for SUVR may shift, an effect that is handled accurately by kinetic modeling. This is the motivation for the very large cohort and diverse NS subjects used in this study. However, a larger cohort in a specific patient group would be useful for full validation. Also, although modeling requires longer scan times, it has the advantages of reducing intersubject variability, as well as providing K1 or R1 (tracer delivery) information, which can be a useful secondary outcome measure (2).
CONCLUSION
On the basis of a large cohort of HSs and NSs, we found that the scan period from 60 to 90 min after injection provided the best agreement between SUVR-1 and BPND for 11C-UCB-J PET. This relationship was not affected by age, sex, or BMI. Therefore, simplified analysis with SUVR can be used for quantification of 11C-UCB-J PET imaging data.
DISCLOSURE
Financial support was received from R01NS094253, R01AG052560, R01MH104459, and the Nancy Taylor Foundation. No other potential conflict of interest relevant to this article was reported.
KEY POINTS
QUESTION: When is the optimal time window for SUVR for the synaptic vesicle protein 2A tracer 11C-UCB-J?
PERTINENT FINDINGS: The 60- to 90-min period provided the best match between SUVR-1 and BPND (−1% ± 7%).
IMPLICATIONS FOR PATIENT CARE: A short scan is sufficient for accurate quantification of synaptic density with 11C-UCB-J.
Footnotes
Published online Jul. 9, 2020.
- © 2021 by the Society of Nuclear Medicine and Molecular Imaging.
REFERENCES
- Received for publication February 20, 2020.
- Accepted for publication June 10, 2020.


