


Abstract
11C-RO-963, 11C-RO-643, and 18F-RO-948 (previously referred to as 11C-RO6924963, 11C-RO6931643, and 18F-RO6958948, respectively) have been reported as promising PET tracers for tau imaging based on in vitro and preclinical PET data. Here we describe the first, to our knowledge, human evaluation of these novel radiotracers. Methods: Amyloid PET–positive Alzheimer disease (AD) subjects and younger controls each received 2 different tau tracers. Dynamic 90-min scans were obtained after bolus injection of 11C-RO-963, 11C-RO-643, or 18F-RO-948. Arterial blood sampling was performed on 11 healthy controls and 11 AD subjects. Regions were defined on MR images, and PET data were quantified by plasma reference graphical analysis (for total distribution volume) and target cerebellum ratio (SUV ratios of 60- to 90-min frames). SUV ratio images were also analyzed voxelwise. Five older controls each underwent 2 scans with 18F-RO-948 for evaluation of test–retest variability. Four AD subjects underwent a repeated 18F-RO-948 scan 6–22 mo after the first scan. Six additional healthy controls (3 men and 3 women; age range, 41–67 y) each underwent 1 whole-body dosimetry scan with 18F-RO-948. Results: In younger controls, SUVpeak was observed in the temporal lobe with values of approximately 3.0 for 11C-RO-963, 1.5 for 11C-RO-643, and 3.5 for 18F-RO-948. Over all brain regions and subjects, the trend was for 18F-RO-948 to have the highest SUVpeak, followed by 11C-RO-963 and then 11C-RO-643. Regional analysis of SUV ratio and total distribution volume for 11C-RO-643 and 18F-RO-948 clearly discriminated the AD group from the healthy control groups. Compartmental modeling confirmed that 11C-RO-643 had lower brain entry than either 11C-RO-963 or 18F-RO-948 and that 18F-RO-948 showed better contrast between (predicted) areas of high versus low tau accumulation. Thus, our subsequent analysis focused on 18F-RO-948. Both voxelwise and region-based analysis of 18F-RO-948 binding in healthy controls versus AD subjects revealed multiple areas where AD subjects significantly differed from healthy controls. Of 22 high-binding regions, 13 showed a significant group difference (after ANOVA, F(1,21) = 45, P < 10−5). Voxelwise analysis also revealed a set of symmetric clusters where AD subjects had higher binding than healthy controls (threshold of P < 0.001, cluster size > 50). Conclusion: 18F-RO-948 demonstrates characteristics superior to 11C-RO-643 and 11C-RO-963 for characterization of tau pathology in AD. Regional binding data and kinetic properties of 18F-RO-948 compare favorably with other existing tau PET tracers.
- molecular imaging
- PET
- Alzheimer disease
- novel radiotracers
- radiotracer development
- tau radiopharmaceuticals
Building on the success of in vivo imaging of amyloid protein aggregates in Alzheimer and related neurodegenerative disorders over the last decade, imaging of tau protein (1,2) has become of scientific and medical interest. Alzheimer disease (AD), the most common of the tauopathies (3), is characterized by the presence of amyloid plaques and tau tangles at autopsy (4,5). The ability to image tau pathology in vivo is important both for differential diagnosis and for monitoring treatment response, as new therapies include antitau mechanisms (6–8).
Recently, we reported the discovery and radiolabeling of several new candidate ligands for tau PET imaging (1). Through in vitro screening, autoradiography, and preclinical in vivo PET imaging studies (2), we selected 3 candidates for evaluation in AD subjects and in younger and older controls (YCs and OCs, respectively) (9). The specificity of all 3 candidate tracers for tau aggregates was supported by autoradiography studies on AD Braak V or VI brain sections, colocalization of radiotracer binding with antibody staining of tau aggregates on the same tissue sections, and lack of colocalization with amyloid plaques. All 3 candidates (11C-RO-963, 11C-RO-643, and 18F-RO-948, previously referred to as 11C-RO6924963, 11C-RO6931643, and 18F-RO6958948, respectively), displayed good brain penetration as indicated by their SUVpeak and blood–brain clearance rate constant (K1), rapid washout, and favorable metabolism in a nonhuman primate (2). The clinical evaluation of these 3 tracers and the selection of one, 18F-RO-948, for further evaluation is described below.
MATERIALS AND METHODS
Subjects
All subjects gave written informed consent before participation. The study protocol was reviewed and approved by the Johns Hopkins Medicine Institutional Review Board and registered on ClinicalTrials.gov (reference NCT0217627).
Three groups of participants were enrolled into the study: YCs aged 25–40 y, OCs aged over 50 y (healthy volunteers were recruited by PAREXEL International), and AD subjects aged 50 y or older (recruited by Johns Hopkins). Screening consisted of routine medical assessments. AD subjects met National Institute on Aging–Alzheimer Association diagnostic criteria, with Mini Mental State Examination (MMSE) scores of 16–26, inclusive. A positive amyloid PET scan was a prerequisite for AD subjects. Capacity for consent was determined (10). All subjects had a body mass index of between 18 and 32, and if on dementia medication the dose had been stable for at least 4 wk before PET scanning.
Study Design
The study aim was to directly compare the imaging properties of 3 tau PET tracers in human subjects and, based on that comparison, to select for further evaluation the single tracer most suitable for application in clinical research.
The study was divided into 3 parts (Table 1). Part 1 evaluated the kinetics of each of the 3 tracers in AD subjects and YCs. To avoid a possible confounding effect of intersubject variability in tau burden (in AD subjects), a pairwise comparison was used in which each subject received 2 of the 3 tracers, with a washout of 7–14 d between the 2 scans (Table 1). Subsequently, one tracer was selected for further evaluation in part 2A (test–retest imaging) and part 2B (whole-body radiation dosimetry) (Table 1). Finally, 4 of the AD subjects who participated in parts 1 (n = 3) and 2A (n = 1) returned for repeated 18F-RO-948 scans with no intervening tau- or amyloid-targeted treatment to provide a preliminary evaluation of the progression of tau deposition. The range of times between scans was 6.2–21.6 mo (mean, 16.9 mo).
Study Design and Subject Demographics
Radiochemistry
11C-RO-963, 11C-RO-643, and 18F-RO-948 were prepared as described previously (1).
Brain Imaging
A structural T1-weighted MR brain scan was acquired on a Siemens Tim Trio 3T for all subjects other than dosimetry subjects. Data were acquired in the sagittal plane, using a 3-dimensional magnetization-prepared rapid gradient-echo sequence with a repetition time of 2.11 s, echo time of 2.73 ms, and inversion time of 1.1 s and were reconstructed in isotropic voxels of 0.8 mm.
All MRI scans were inspected by a faculty neuroradiologist to exclude subjects with clinically relevant brain abnormalities. All brain PET imaging procedures were performed at the Johns Hopkins Hospital PET Center on a High-Resolution Research Tomograph (Siemens) with a resolution of approximately 2 mm in full width at half maximum.
For brain PET scans, subjects were positioned in the tomograph after insertion of a venous cannula in an antecubital vein and a radial arterial cannula. The attenuation maps were generated from 6-min transmission scans performed with a 137Cs point source before each radiotracer injection. Dynamic emission data were collected continuously for 0–90 min in part 1 (frame durations: four 15-s, four 30-s, three 1-min, two 2-min, five 4-min, and twelve 5-min frames, or a total of 30 frames for the 90-min scan). Thereafter, for scans longer than 90 min, 5-min frames were used up to 120 and 200 min in parts 2A and 2B, respectively. Imaging took place after intravenous bolus injection of 11C-RO-963, 11C-RO-643, or 18F-RO-948 in part 1 and 18F-RO-948 in part 2.
For radiation dosimetry (part 2B), non–intravenous-contrast CT and PET images were obtained in 4 repetitions from the vertex to mid thighs. Images were acquired on a GE Discovery VCT (DVCT) lutetium-yttrium oxyorthosilicate crystal 64-slice scanner. Each repetition of the vertex to mid thighs involved 8 bed positions over 91 min.
Target injected activities were as follows: 70-min amyloid scans of 370 MBq (10 mCi) for 18F-florbetapir (Amyvid; Eli Lilly) or 560 MBq (15 mCi) for 11C-Pittsburgh compound B dynamic PET scans; for 90-min scans of 11C-RO-963 and 11C-RO-643, 740 MBq (20 mCi); for 90- to 200-min scans of 18F-RO-948, 185 MBq (5 mCi), later increased to up to 370 MBq (10 mCi); and for dosimetry scans of 18F-RO-948, 185 MBq (5 mCi).
Amyloid positivity was determined by Food and Drug Administration–approved visual interpretation with 18F-florbetapir, or visual interpretation and SUV threshold with 11C-Pittsburgh compound B (11).
Input Function Measurement
For all tau PET brain scans, radial-artery blood samples (optional for AD subjects) were obtained for derivation of a plasma input function (∼42 samples over the duration of each tau PET brain scan), and for determination of radioactive metabolites in plasma with high-performance liquid chromatography (6 or more samples). During the PET scan period, safety data were obtained including vital signs, electrocardiography, labs, and safety monitoring.
Outcome Measurements
Image data were reconstructed using the iterative ordered-subsets expectation maximization algorithm, with correction for radioactive decay, dead time, attenuation, scatter, and randoms (12).
Detailed analysis methods, including PET outcome variables, are described in a companion paper (13). Briefly, volumes of interest were defined by Freesurfer and FSL/FIRST software, manually refined on the basis of each individual subject’s MR images, and transferred to each subject’s native PET space using the coregistration module of SPM12 (14,15) to generate time–activity curves of volumes of interest. In total, 80 volumes of interest were used (left and right volumes of interest of 40 brain regions). The volume of interest for the cerebellar cortex served as a reference region, excluding the vermis and upper 6 mm to reduce contamination from the supratentorial regions. The main outcome variables for part 1 were the K1 from 2-tissue-compartment analysis and the total distribution volume from plasma input graphical analysis (16). For part 2A, the main outcome measures were the distribution volume ratio (DVR) from plasma input graphical analysis and reference tissue graphical analysis (17), as well as the SUV ratio (SUVR) to the cerebellar cortex. Part 2B outcome measures were activity time integrals for the whole-body dosimetry.
18F-RO-948 in AD Subjects and OCs
The most promising radiotracer, 18F-RO-948, was further evaluated to compare regional tau accumulation in AD subjects compared with OCs. First, the mean SUVRs of AD subjects, OCs, and YCs in all 80 regions were examined to explore the region-specific binding throughout the gray matter by ranking regions in order of mean SUVRs in AD subjects.
Next, regional SUVR data for the AD and OC groups were compared to examine the discriminatory power of the radiotracer.
Third, a voxelwise analysis of differences in SUVR between AD and OC groups was performed with SPM12 (14). SUVR images of individual subjects were spatially normalized to Montreal Neurological Institute space using parameters from each subject’s PET-to-MRI coregistration and MRI-to-template spatial normalization given by respective modules of SPM12 (15) and smoothed by a gaussian kernel of 6 mm in full width at half maximum. A locally modified Desikan/Killiany atlas (18) of the 80 brain regions was used to identify the brain structures in Montreal Neurological Institute space. Separately, an SUVR threshold map (the mean SUVR map plus 3 times the median SD of gray matter voxels of OCs) was constructed for generation of a map of tau-positivity frequencies.
Subsequently, Braak stages (19) of tau accumulation were estimated using the region scheme and criteria of Schwarz et al. (20), which adapted the scheme of Braak (19) to SUVR images in Montreal Neurological Institute space.
Statistical Analysis
To compare regional values of AD subjects against OCs we tested for the effect of region and group status (AD and OC) on PET outcome variables using ANOVA with group and region as the independent variables. If the ANOVA showed a significant effect of group, we used post hoc t tests, applying Bonferroni adjustment for multiple comparisons. Specifically, the Mann–Whitney U test was used because the outcome variables showed a skewed distribution. Statistical analyses were performed by MATLAB (The MathWorks).
In the exploratory voxelwise statistical analysis, a significance threshold combination at a P value of less than 0.001, uncorrected, and a minimal volume of 0.4 mL (or 50 voxels) was used. The threshold for commonly affected voxels in the tau-positive frequency map was set at the frequency value that roughly equated the resulting total volume of commonly affected voxels to the total cluster volume of the SPM group difference analysis.
Whole-Body PET/CT Scanning
Mean residence times for each organ were calculated using the area under the non–decay-corrected time–activity curve and the tabulated organ volume as used in OLINDA/EXM, version 1.0, to calculate the radiation dose to individual organs, as well as effective dose equivalents and effective doses.
RESULTS
Subject demographics and study design are in Table 1, and injected activity, mass, and specific activity for all radiotracers are in Supplemental Table 3 (supplemental materials are available at http://jnm.snmjournals.org). There were no serious adverse events.
Brain Uptake and Kinetics
Brain SUVpeak was approximately 3.0, 1.5, and 3.5 for 11C-RO-963 (n = 5), 11C-RO-643 (n = 4), and 18F-RO-948, (n = 5), respectively, for YCs in the temporal lobe. Other regions showed a similar trend, with 18F-RO-948 having the highest SUVpeak, followed by 11C-RO-963 and then 11C-RO-643 (Fig. 1). Brain penetration was highest for 18F-RO-948 and lowest for 11C-RO-643. The retention of 11C-RO-963 in YCs at later times (60–90 min after injection) was somewhat higher than that of 11C-RO-643 and 18F-RO-948, suggesting that 11C-RO-963 has nonspecific binding leading to its slower washout (Fig. 1).
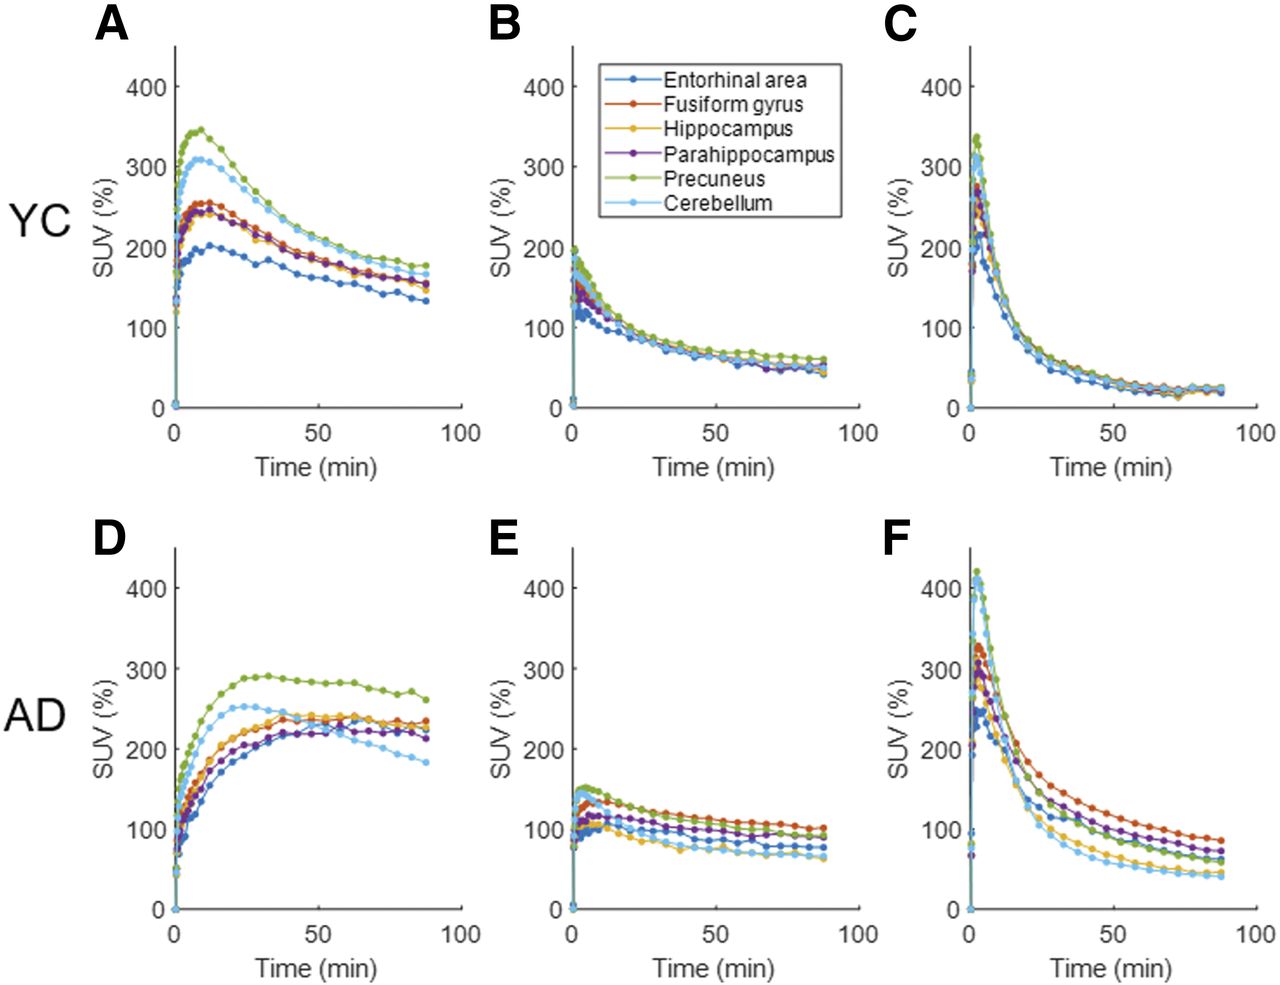
Line plots of time–activity curves in SUV of selected brain regions of 11C-RO-963 (A and D), 11C-RO-643 (B and E), and 18F-RO-948 (C and F) for YCs (panels A–C) and AD subjects (panels D–F).
After direct comparison of brain uptake in the AD subjects of all 3 tracers with compartmental modeling (below), further testing of 11C-RO-963 was deprioritized.
When 11C-RO-643 was compared with 18F-RO-948 within AD subjects, 18F-RO-948 displayed a higher contrast between (predicted) tau-rich regions and tau-poor regions. The regional retention of 18F-RO-948 appeared to distinguish between AD subjects and YCs (Fig. 2).

Sagittal SUVR images of candidate radioligands, applied to same AD subjects and YCs. Cb = cerebellar cortex.
Time–activity curves (60–90 min) in regions typically involved in tau accumulation (e.g., temporal lobe, fusiform, cingulate, parietal, occipital, and parahippocampal) showed greater separation between the AD and YC groups for 18F-RO-948 than for the other 2 tracers (Fig. 1).
For comparison, the time–activity curves for the cerebellar gray region are shown (Fig. 1). Cerebellar gray matter is thought to contain low or no levels of aggregated tau in AD subjects and YCs; thus, the late-phase tracer uptake should be low and similar between AD subjects and YCs, best exhibited by 18F-RO-948.
Compartmental modeling (2-tissue-compartment analysis) confirmed the lower brain entry of 11C-RO-643 (mean across regions, K1 = 0.054 ± 0.01 for AD subjects and 0.065 ± 0.02 mL/mL/min for YCs) than of 11C-RO-963 (K1 = 0.35 ± 0.07 for AD subjects and 0.42 ± 0.09 mL/mL/min for YCs) and 18F-RO-948 (K1 = 0.35 ± 0.1 for AD subjects, 0.43 ± 0.9 for YCs, and 0.42 ± 0.14 mL/mL/min for OCs), a result anticipated from the time–activity curves.
Time–activity curves for 18F-RO-948 YCs, compared with AD subjects (Fig. 1), were consistent with the anticipated lower level of retention and regional heterogeneity in YCs and with the higher retention and regional heterogeneity in AD subjects. The regional distribution of 18F-RO-948 retention was also distinct from that of the amyloid tracers.
Quantification
The kinetics of the 3 radiotracers was well described by a 2-tissue-compartment analysis, and plasma input graphical analysis plots approached an asymptote by 20 min.
Regional (60–90 min) SUVR data correlated with DVR data for both 11C-RO-643 (y = 0.85x·+ 0.22; R2 = 0.867; Fig. 3A) and 18F-RO-948 (y = 1.62x·− 0.64; R2 = 0.911; 4 AD subjects and 4 YCs) (13). Direct comparisons of SUVR data for 11C-RO-643 versus 18F-RO-948 (Fig. 3B) indicated a lower slope (0.36; 95% confidence interval, 0.34–0.38) for AD data than for YC data (slope, 0.51; 95% confidence interval, 0.47–0.54). These data suggest that 11C-RO-643 underestimates SUVR in the AD range (i.e., the higher the SUVR, the higher the underestimation) compared with 18F-RO-948.
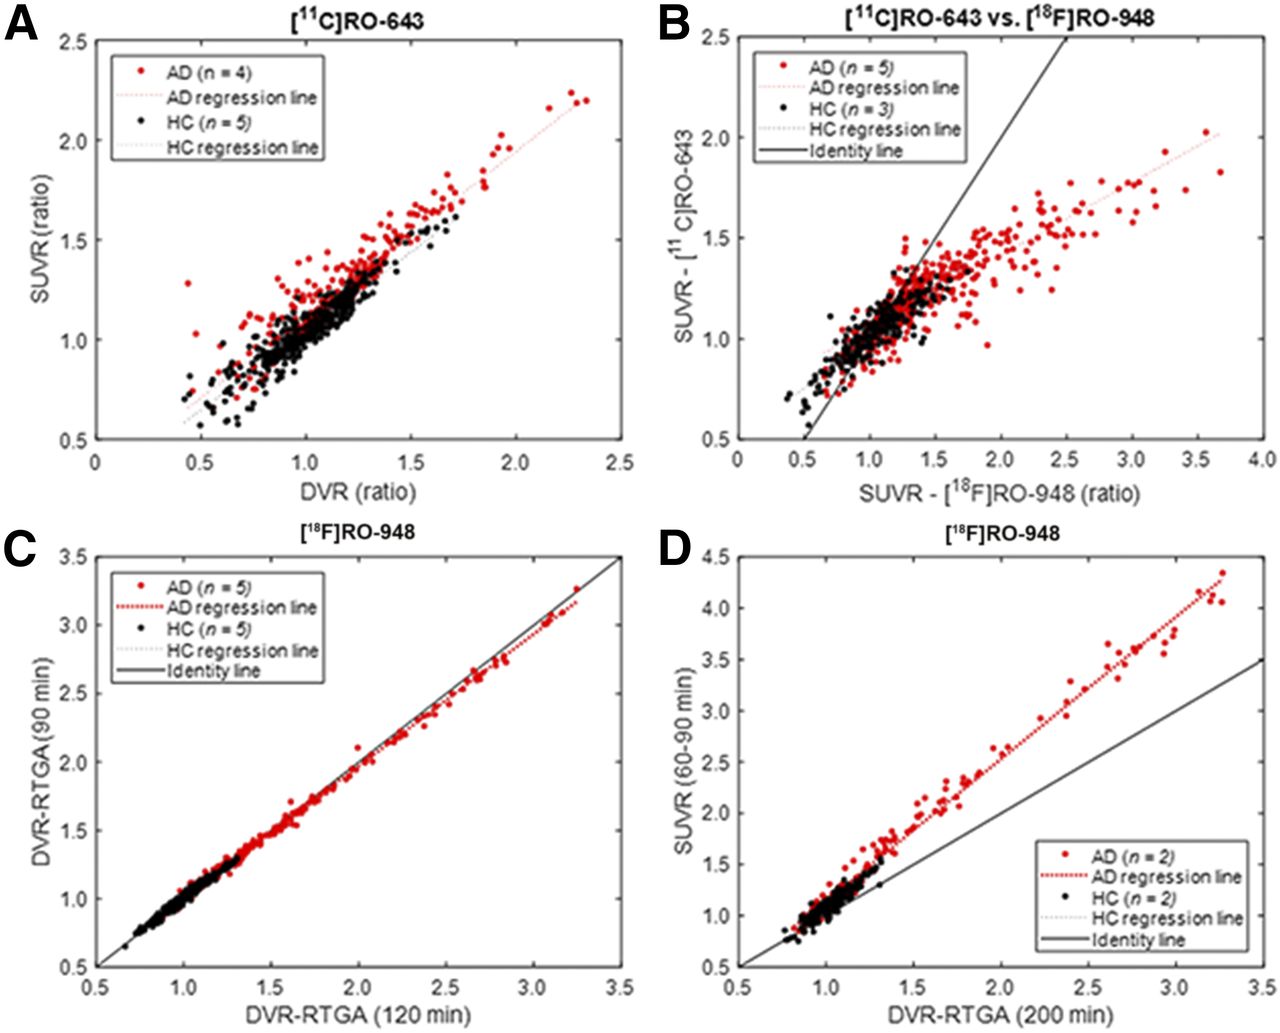
Scatterplots of SUVR vs. DVR for 11C-RO-643 (A) and SUVR data for 11CRO-643 vs. 18F-RO-948 for subjects who had both scans (B). Scatterplots of DVR (reference tissue graphical analysis [RTGA]) for 90- vs. 120-min circulation times for data analysis (C) and SUVR vs. DVR for 18F-RO-948 (D).
Additionally, for 18F-RO-948, the regional DVR data at 90 min linearly correlated with the DVR data at 120 min for AD subjects and OCs, with a minimal bias of about 5% (Fig. 3C), by reference tissue graphical analysis (17). Reference tissue graphical analysis yielded DVRs essentially identical to those from plasma input graphical analysis (considered the optimal method) for 18F-RO-948 (13). The regional SUVRs for 60- to 90-min frames were strictly proportional to the DVRs for 200-min scans (Fig. 3D), which confirmed that the SUVR of 60- to 90-min frames is a valid surrogate for DVR in 200-min scans for 18F-RO-948. Therefore, 18F-RO-948 was selected for further evaluation. A detailed evaluation of the kinetic modeling of 18F-RO-948 is given in the companion paper (13).
Injection Parameters
There were no significant differences in injected radioactivity, mass, or specific activity between test and retest studies of 18F-RO-948. Activity was a median of 271.6 MBq (range, 166.5–364.8 MBq) on test studies and 259.7 MBq (range, 140.6–355.2 MBq) on retest studies (P = 0.9 on the Student paired-samples t test). Injected mass was a median of 0.08 μg (range, 0.03–0.21 μg) on test studies and 0.13 μg (range, 0.03–0.68 μg) on retest studies (P = 0.5). Specific activity was a median of 27.7 GBq/μmol (range, 11–51 GBq/μmol) on test studies and 33.0 GBq/μmol (range, 16–71 GBq/μmol) on retest studies (P = 0.5).
Metabolite Analysis
11C-RO-643 and 18F-RO-948 showed similar plasma parent time profiles (Supplemental Fig. 1). Across all subjects, the percentages of high-performance liquid chromatography–corrected radiolabeled 18F-RO-948 metabolites as compared with parent were very similar, with no lipophilic metabolites identified. There was no evidence of defluorination of 18F-RO-948.
Reproducibility of Blood Data Quantification
The percentage of the 18F-RO-948 parent compound in the plasma differed by less than 10% between test and retest. For the first 5 min, test–retest differences were higher (25%), likely because of bolus injection differences (Supplemental Table 1).
Reproducibility of PET Data Quantification
The test–retest variability with various methods (DVR, SUVR) in OCs and AD subjects between test and retest was 6%–10% across regions (13).
Regional Uptake of 18F-RO-948
The mean SUVRs of the 40 regions (left and right merged) for AD subjects, OCs, and YCs are shown in Supplemental Table 4 in descending order for AD subjects. The Braak anterior regions (hippocampus, entorhinal area, and parahippocampus) together with the inferior temporal lobe, lateral cortical regions (inferior parietal lobe, supramarginal gyrus, lateral occipital lobe, and superior parietal lobe), medial posterior regions (precuneus, posterior cingulate gyrus, and isthmus/cingulate), and frontal regions (middle frontal lobe, rostral frontal lobe, and frontal operculum) showed the highest SUVRs. Surface projection maps (Fig. 4A) visually confirmed the above-mentioned regional distributions of SUVR in AD.

(A) Surface projection maps of mean 18F-RO-948 SUVR images of left and right hemispheres of AD subjects (from top to bottom: lateral, medial, and ventral views). (B) Box plot of SUVR data comparing AD subjects and OCs in 8 regions in which AD subjects showed highest mean SUVRs, as well as 3 Braak anterior regions (hippocampus, entorhinal area, and parahippocampus). Dots represent points lying outside ±2.7 SDs, assuming normal distributions. ER = entorhinal area; FO = frontal operculum; Fs = fusiform gyrus; Hp = hippocampus; IC = isthmus/cingulate; iPa = inferior parietal lobe; iTp = inferior temporal lobe; lOc = lateral occipital lobe; mFr = middle frontal lobe; mTp = middle temporal cortex; PH = parahippocampus; pCg = posterior cingulate gyrus; Pr = precuneus; sPa = superior parietal lobe; rFr = rostral frontal lobe; SM = supramarginal gyrus.
The SUVRs of 22 regions, consisting of those showing high-SUVR regions plus Braak anterior regions, are compared between AD subjects and OCs in Figure 4B. The lowest AD values exceeded the highest OC values in 5 regions (3 left-sided and 2 right-sided; Table 2). Statistically, ANOVA showed a significant group effect (F(1,21) = 45, P < 10−5), and 13 regions had significant differences (AD > OC) that survived Bonferroni adjustment (uncorrected P < 0.05/22 = 0.0023, Table 2).
Presence or Absence of Separation and Statistical Differences
The voxelwise statistical test (SPM12) identified a pair of roughly symmetric clusters of AD > OC (Figs. 5A–5D) that spanned Braak anterior regions and other high-binding regions (inferior parietal lobe and inferior temporal lobe) (Supplementary Table 5). Along the y-axis (anterior–posterior), both t values (Supplemental Table 5) and cluster volumes (Fig. 5E) peaked around the anterior commissure (y = 0). If one selects a coronal slice of 1-cm thick that includes hippocampus based on the SPM results, it is likely that such a slice will coincide with the Braak anterior block that was selected as a representative coronal slice to capture tau accumulations in AD (19).The map of tau-positive frequencies had a similar volume of clusters when the threshold was set to 0.64 (i.e., 7 of the 11 AD subjects). Although extending to similar regions in the SPM analysis, the clusters of the frequency map included precuneus and posterior cingulate gyrus, and superior parietal lobe and inferior parietal lobe.

(A–D) Two roughly symmetrical SPM clusters (AD > OC) overlaid on 3 orthogonal views of standard MRI. (E) Line plots of volumes (across 1-cm-thick coronal slices) of over-the-threshold voxels of SPM analysis, hippopotamus, and amygdala along anterior–posterior axis. The 2 blue vertical lines indicate extent of anterior slice of Braak anterior block (19). (F–K) Clusters of high 18F-RO-948 tau-positive frequencies (>7 of 11 AD subjects) that spatially agreed with the 2 SPM clusters (F–H). Additional high-frequency clusters were noted in precuneus and posterior cingulate gyrus (I), and in superior and inferior parietal lobes, and supramarginal gyrus (J and K).
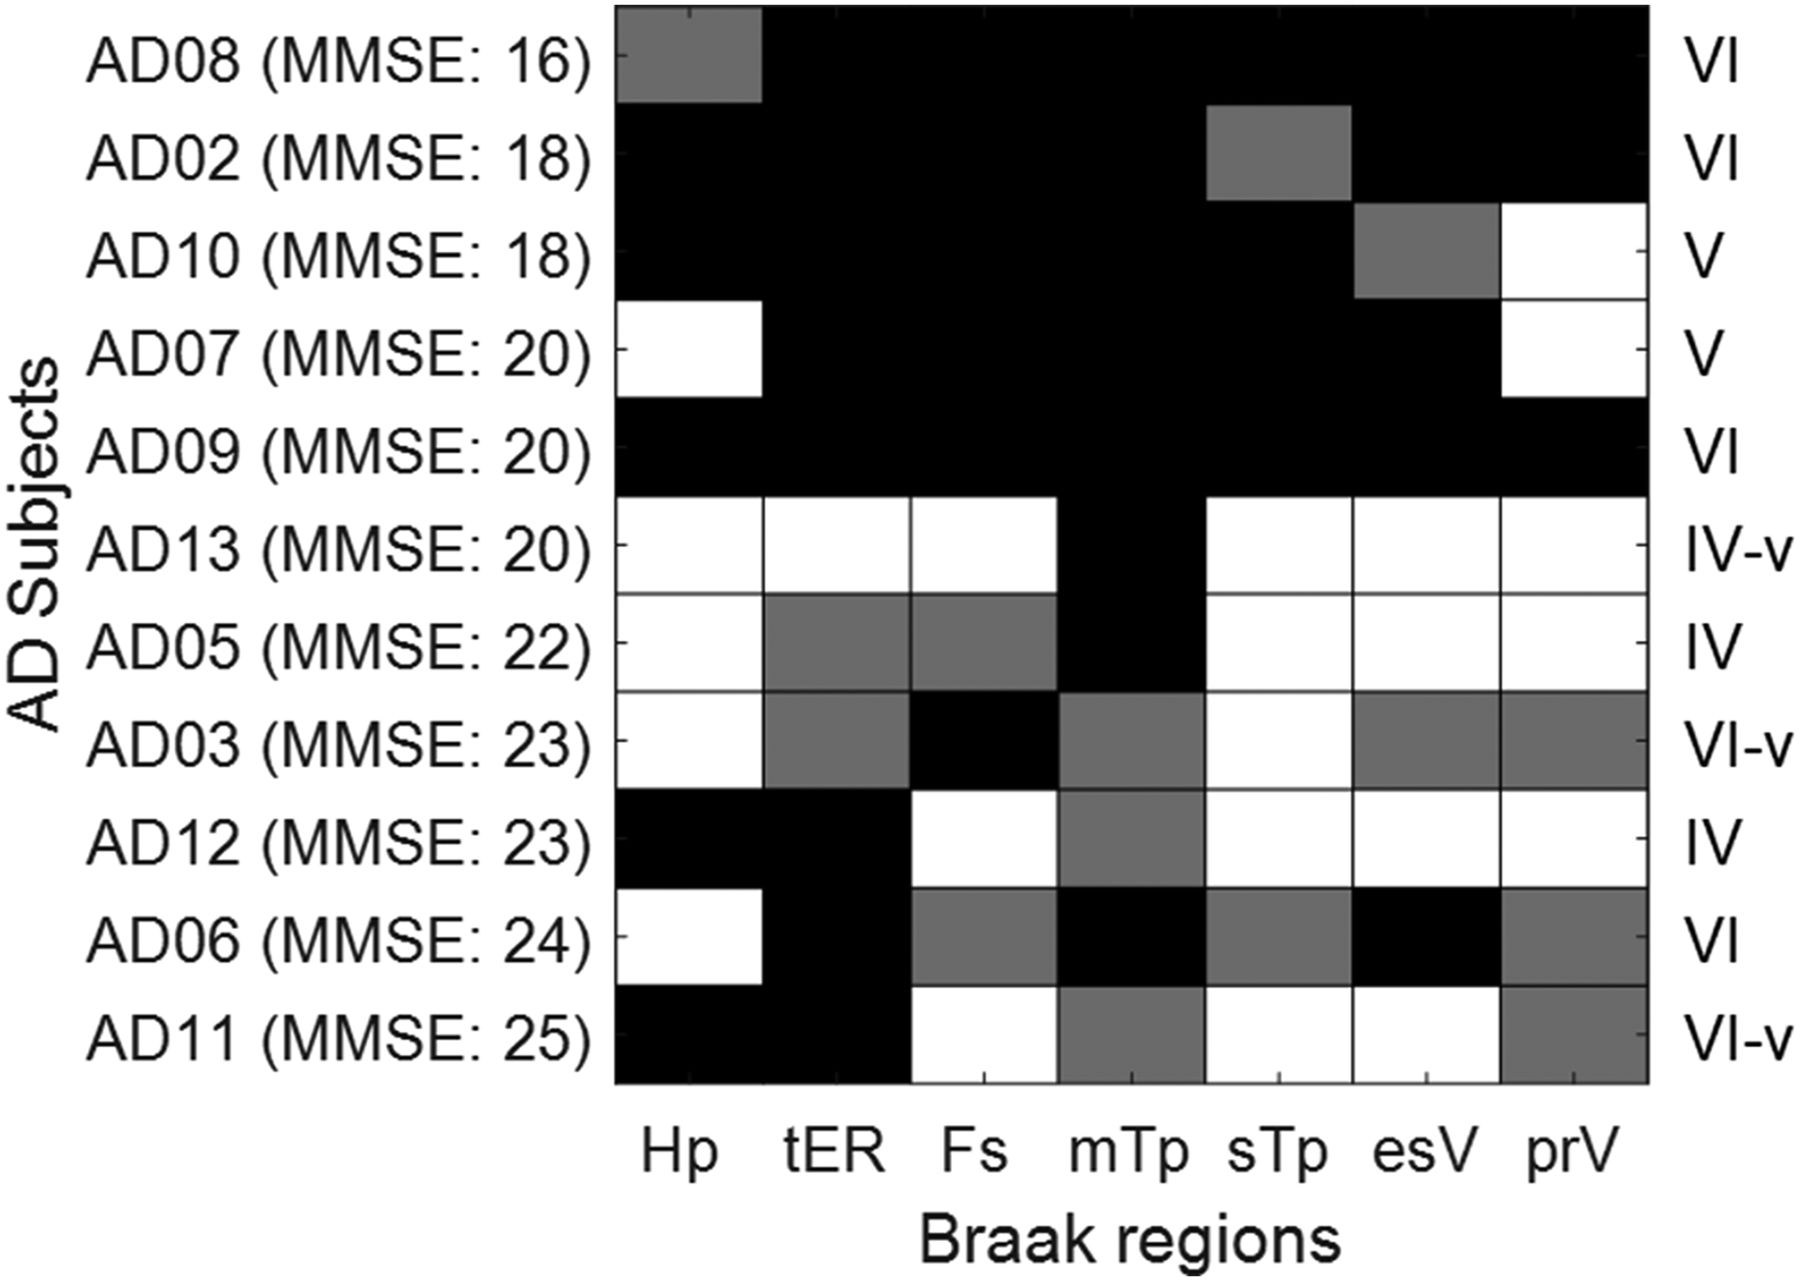
Tau-positivity results for the Braak anterior and posterior regions are shown in Figure 6. Estimated Braak stages were IV in 3 AD subjects (MMSE: 20, 22, and 23), V in 2 AD subjects (MMSE: 18 and 20), and VI in 6 AD subjects (MMSE: 16, 18, 20, 23, 24, and 25). Single (hippocampus in 4 subjects) or multiple (3 subjects with -v in the estimated Braak stages; right-most column in Figure 6) spared regions were noted across stages. No correlations of estimated Braak stages to MMSE scores were noted in this small sample of AD subjects (R2 < 0.01; P = 0.86).

Checkerboard plot showing 18F-RO-948-positivity results (black cells: bilaterally positive; gray cells: unilaterally positive) of anterior and posterior Braak regions (19), and estimated Braak stages (right column) (20). esV =extrastriatal visual cortex; Fs = fusiform gyrus; Hp = hippocampus; mTp = middle temporal cortex; prV = primary visual cortex; sTp = superior temporal cortex; tER = transentorhinal cortex.
We illustrate amyloid load (using either 11C-Pittsburgh compound B or 18F-AV45), tau binding with 18F-RO-948, age, and MMSE score in Figure 7 for all AD subjects. This figure shows the ability of 18F-RO-948 to successfully image a range of tau burden across a variety of patients and to demonstrate the difference in regional patterns between amyloid and tau.

SUVR-cerebellar cortex images of 18F-RO-948 for all 11 AD subjects, arranged in descending order of global mean SUVR, alongside corresponding Aβ image (11C-Pittsburgh compound B SUVR, except for subjects AD02, AD05, and AD13, who had 18F-AV45 scans).
Finally, longitudinal studies in 4 AD subjects showed DVR or SUVR changes in 3 subjects over 1 y, with considerable increases in tau in regions selected a priori (Supplemental Fig. 2). These data suggest that 18F-RO-948 could be used to detect changes in tau pathology over time.
Whole-Body Radiation Dosimetry
All organ time–activity curves were well fit with 1 or 2 exponential functions. The gallbladder received the highest dose, 0.15 mSv/MBq (0.5 rem/mCi), with most organs receiving 0.01–0.05 mSv/MBq (0.03–0.15 rem/mCi).
The mean effective dose (averaged for men and women) was estimated to be 0.015 mSv/MBq (0.056 rem/mCi). Detailed organ dosimetry is given in Supplemental Table 2.
DISCUSSION
We report the in vivo characterization of 3 tau tracers—11C-RO-963, 11C-RO-643, and 18F-RO-948—using an arterial input. Because of its superior in vivo imaging properties, 18F-RO-948 was selected for further evaluation. Healthy subjects demonstrated minimal retention, whereas AD subjects demonstrated regional distributions consistent with published postmortem data on paired helical filament–tau.
Kinetic analyses demonstrated good correlations and time stability for measures by the 2-tissue-compartment model and plasma input graphical analysis. DVR for plasma input graphical analysis remained constant between 180 and 200 min (13). DVR for reference tissue graphical analysis correlated with DVR for plasma input graphical analysis, suggesting that reference tissue graphical analysis using the cerebellum gray matter as the reference tissue could be used for dynamic studies. SUVR for cerebellar cortex and DVR showed excellent test–retest variability results in the small sample of patients evaluated to date. SUVR for cerebellar cortex (60–90 min) correlated linearly with DVR. Altogether, the above findings demonstrated that the SUVR for cerebellar cortex was suitable for larger clinical studies. In fact, the SUVR for cerebellar cortex demonstrated excellent separation between AD subjects and OCs in 12 selected regions.
The human whole-body dosimetry was lower than or comparable to that of other 18F tau radiotracers and allowed as many as 6 scans per subject at 370 MBq (10 mCi) each, using U.S. guidelines.
In common with flortaucipir (18F-AV1451, T807), we observed the highest uptake of 18F-RO-948 in the inferior and lateral temporal lobes of AD subjects (21) and in other brain regions known to display tau pathology in AD. In contrast to flortaucipir, 18F-RO-948 showed stable SUVRs in AD subjects at around 70–80 min. This stability may confer some advantages to the use of 18F-RO-948 in longitudinal studies or in studies assessing the impact of a therapeutic agent. In this limited dataset, we saw no appreciable uptake in the choroid plexus or in the striatum. Off-target retention was observed in the substantia nigra and, in one control subject, in the cerebellar vermis. Extracerebral tracer retention was occasionally observed in the meninges and more often in the retina.
Recently, several other tau tracers have been reported, including 18F-THK5351 (22), 18F-MK6240 (23,24), 18F-GTP1 (25), 18F-PI2620 (26), and 18F-JNJ643493 (27). When these tracers are compared with each other, or with 18F-RO-948, assuming no major differences in selectivity (e.g., a large fraction of the specific signal of 18F-THK5351 has been shown to be attributable to monoamine oxidase B rather than tau (28)) or kinetics, several other factors should be considered, particularly if the intended application of the tracer is in longitudinal or multicenter studies. First, production needs to be reliable and consistently have a sufficiently high yield (as in the case of 18F-RO-948) to allow the tracer to be transported between production and scanning sites. Second, extracerebral uptake should be minimal to avoid spillover into the cortex, complicating quantification and interpretation of images, particularly in subjects with mild AD. Finally, a highly specific signal may increase tracer sensitivity to detect low levels of pathologic changes in earlier stages of the disease and to appreciate pathologic changes over time. 18F-RO-948 satisfies these criteria. The tau-positive frequency map advanced by Cho et al. (29) is an example of qualitative assessment (spatial occurrences of above-threshold voxels). Such maps are expected to supplement voxelwise statistical tests or quantitative assessments. With greater numbers of subjects (67 OCs and 53 AD subjects), the paper reported a maximal frequency of 0.3, whereas this study with 18F-RO-948 showed much higher frequencies (≥0.7) in similar regions. The difference could be ascribed to different frequencies of subtypes of AD in the 2 studies. In fact, frequency maps could supplement mean SUVR maps of subtypes of AD (30), which could be influenced by subjects with high SUVRs. Clearly, a much larger sample of 18F-RO-948 OCs and AD subjects is needed to confirm this observation of frequency differences.
Currently, Braak stages are applied to tau-neuroimaging studies either using a conventional approach involving the whole brain regions (20,31,32) or using a new approach with anterior and posterior brain blocks alone (19,20). By either approach, studied AD subjects tended to be in either stage V or VI (62% by Cho; 87% by Scholl; 78% by Schwarz; 71% by this study). However, there are several reasons why one would not expect tau PET images to correspond directly to the Braak system. Perhaps most importantly, Braak staging is based on counting of neurofibrillary tangle lesions identified on postmortem tissue. In contrast, a PET tracer binding to tau fibrils will presumably reflect the density of a wider range of tau aggregates. Therefore, new staging algorithms are needed to capture natural advancement of tau-accumulation, differences in tau-accumulation patterns in subtypes of AD, and treatment effects of tau-targeting treatments. Sparing of selected regions, as proposed by Schwarz et al. (20), may be one possibility, as we also observed sparing of regions with 18F-RO-948 in this study. These findings are consistent with the heterogeneity of binding for all the recent tau radiotracers and the need for novel classifications.
Our limited sample of longitudinal data suggests that 18F-RO-948 is able to detect longitudinal tau changes (33), though larger longitudinal studies are needed to confirm its reliability and sensitivity to track tau pathology changes over time.
CONCLUSION
18F-RO-948 is a promising radiotracer for imaging tau pathology in AD. The tracer shows good brain uptake, has no apparent brain-penetrant radiolabeled metabolites, has a good kinetic profile, shows little or no retention in cognitively normal YCs or OCs and a distribution in AD subjects consistent with published postmortem data, has low test–retest variability, and has radiation dosimetry consistent with that of other 18F-labeled central nervous system PET tracers.
It is our hope that tools such as 18F-RO-948 will allow us to gain a better understanding of the pathophysiology of AD and, in the context of drug development, select patients for clinical trials, confirm the mechanism of action of drugs targeting pathologic tau, and monitor the effects of disease-modifying therapies regardless of whether they target tau directly.
DISCLOSURE
The study was funded by F. Hoffmann-La Roche, Basel, Switzerland. Susan Resnick and Madhav Thambisetty are supported by the Intramural Research Program, the National Institute on Aging, and NIH. No other potential conflict of interest relevant to this article was reported.
Acknowledgments
Special thanks are given to the Johns Hopkins PET Center staff and for dosimetry calculations by Michael Stabin, Vanderbilt University. Robert A. Comley is currently with AbbVie Inc., USA.
Footnotes
↵* Contributed equally to this work.
Published online May 4, 2018.
- © 2018 by the Society of Nuclear Medicine and Molecular Imaging.
REFERENCES
- Received for publication February 23, 2018.
- Accepted for publication April 27, 2018.


Jump to section
Related Articles
Cited By...
- Imaging {alpha}-synuclein pathologies in animal models and patients with Parkinsons and related diseases
- The Use of Tau PET to Stage Alzheimer Disease According to the Braak Staging Framework
- The Use of Tau PET to Stage Alzheimer Disease According to the Braak Staging Framework
- TauIQ: A Canonical Image Based Algorithm to Quantify Tau PET Scans