


Abstract
The availability of tau PET radioligands enables quantitative assessment of tau density and distribution in the human brain. We evaluated the kinetics of a novel radioligand, 18F-RO-948 (previously referred to as 18F-RO6958948), and its ability to identify tau positivity in individual patients with mild Alzheimer disease (AD). Methods: Eleven subjects with amyloid-positive mild AD, 5 amyloid-negative older control subjects (OC), and 5 younger control subjects (YC) completed 1 or 2 (4 AD and 5 OC) PET scans with 18F-RO-948 for 90, 120, or 200 min. The kinetics of the radioligand was evaluated with standard compartmental and noncompartmental models (with plasma data in 70% of cases), tissue-reference methods, and SUV ratio. These approaches were applied to assess the ability of 18F-RO-948 to discriminate AD subjects from OC subjects. Results: The plasma reference graphical analysis appeared to be the optimal method of quantification for 18F-RO-948, yielding strictly time-consistent values of distribution volume and distribution volume ratio at 90 min against the analyses at 120 and 200 min. The reference tissue graphical analysis and SUV ratio were cross-validated against plasma reference graphical analysis. Test–retest evaluation showed excellent reproducibility. A proposed novel index of tau load, the regional tau-positive fraction, showed high values in the medial and lateral temporal and parietal regions in AD and successfully separated AD subjects from OC and YC subjects with a significant margin. Conclusion: 18F-RO-948 appears to be a promising radioligand for quantitative imaging of tau in the brain of AD patients.
- neurology
- PET
- radiotracer tissue kinetics
- Alzheimer disease
- 18F-RO6958948 for tau imaging
- radiotracer tissue kinetics
Recently, interest in neuroimaging of tauopathies with PET has grown within the Alzheimer disease (AD)/dementia research community, complementing the imaging of amyloid-β (Aβ) (1,2). Models of AD progression based on neuropathologic studies (3–5) are being examined with 18F-AV1451 PET imaging (6,7). Independently of these models, distribution patterns of tau in early-AD subjects (8) and in subtypes of AD (9) are being evaluated with 18F-AV1451. In addition, it has been reported that PET is able to detect progression of tau pathology in AD over intervals of as short as 6 mo (10).
We have developed 18F-RO-948 (previously referred to as 18F-RO6958948) for imaging tau aggregates in the human brain (11,12). The ligand has high affinity and specificity for tau aggregates in vitro while lacking affinity for Aβ plaques (11). Autoradiographic studies indicate that 18F-RO-948 binds with high affinity to tau aggregates in AD brain sections whereas lower reactivity is observed in non-AD tauopathies (11), suggesting that 18F-RO-948 primarily recognizes a mixture of 3- and 4-repeat tau isoforms.
In this study, we evaluated the kinetics of 18F-RO-948 in the brain of AD and younger and older control subjects (YC and OC subjects, respectively) to identify optimal modeling approaches, outcome variables, and tracer circulation time. We also evaluated reproducibility with test and retest scans. Imaging outcome measures with good reproducibility will be key to understanding the natural progression of tau deposition in patients and assessing the effects of tau-targeting therapies.
One of the primary purposes of neuroimaging of tauopathies is to accurately identify tau positivity in individual scans. Analogous schemes have been established for Aβ imaging (13,14); however, SUV ratio (SUVR)–based attempts (15,16) have not yet been established for tau tracers. In this paper, we introduce a novel index of tau load, the regional tau-positive fraction (TPF). It was expected that the binary nature of TPF (positive or negative) could make it very sensitive in detecting initial increases of tau accumulation in AD compared with published quantitative approaches (15,16). In addition, after recent reports (17,18) suggesting the presence of off-target binding for 18F-AV1451, we carefully examined the binding of 18F-RO-948 in YC and OC subjects.
MATERIALS AND METHODS
Subjects
After giving written informed consent, 11 subjects with AD, 5 YC subjects, and 5 OC subjects entered this study, which was approved by the institutional review board of the Johns Hopkins University, School of Medicine. Detailed inclusion and exclusion criteria are listed in a companion paper (12). Briefly, the YC subjects were less than 40 y old and had no neuropsychiatric disorders. The OC subjects were more than 50 y old, cognitively normal (mini-mental state examination score > 28), and Aβ-negative based on scans obtained with 11C-Pittsburgh compound B or 18F-AV45. The AD subjects were more than 50 y old, had a clinical diagnosis of AD, scored between 16 and 26 on the mini-mental state examination, and were Aβ-positive based on scans obtained with 11C-Pittsburgh compound B or 18F-AV45.
PET and MRI Procedures
PET studies were performed on a high-resolution research tomograph (Siemens). Preparation included insertion of an intravenous catheter for ligand injection and, in selected subjects, a radial arterial catheter for blood sampling. Each subject had a custom-fitted thermoplastic facemask to reduce head motion during the PET study. A 6-min attenuation scan was performed using a rotating 137Cs point source. Starting with a slow-bolus injection of 18F-RO-948, the emission scan lasted for 90, 120, or 200 min in 3-dimensional list mode. Short restroom breaks (<5 min) were allowed, and a 20-min break (between 120 and 140 min after injection) was scheduled for 200-min scans. In subjects with arterial catheters, blood samples were obtained throughout the scan, approximately every 5 s initially and increasing to every 5 min after 30 min. The radioactivity in plasma was measured with a cross-calibrated γ-counter. Radioactive species in plasma were determined with high-pressure liquid chromatography on selected plasma samples (2, 5, 10, 20, 30, 45, and 90 min and every 30 min thereafter). Each subject was carefully monitored for subjective symptoms together with vital signs and electrocardiography throughout the scan.
The emission scans were reconstructed (19), correcting for attenuation, scatter, and dead time. The frame schedules were four 15-s, four 30-s, three 1-min, two 2-min, and five 4-min frames up to 30 min, and 5-min frames thereafter to make totals of 30, 36, or 52 frames for the 90-, 120-, and 200-min scans, respectively. Each PET frame consisted of 256 by 256 by 207 (axial) voxels. The final spatial resolution was expected to be about 2.3 mm in full width at half maximum in 3 directions (19). In interrupted scans, separate transmission scans were used for pre- and postinterruption emission scans. PET frames were aligned to the frame with the highest non–decay-corrected count using the coregistration module of SPM12 (20) (http://www.fil.ion.ucl.ac.uk/spm/) to reduce the effects of head motion during the scan and head motion due to interruptions. Spoiled gradient sequence MR images were obtained with a 3-T Trio Tim system (Siemens) for each subject for anatomic identification of the structures of interest.
Volumes of Interest (VOIs) and Generation of Time–Activity Curves
VOIs of 40 brain regions (80 left and right VOIs) were generated with the software library tools of the Oxford Center for Functional MRI of the Brain (21,22) (subcortical) and with Freesurfer software (23). The VOIs were refined on the MR image using a locally developed VOI tool. VOIs for the cerebellar gray matter were defined manually, excluding the vermis and anterior lobules. Voxels within 6 mm dorsally were excluded to reduce contamination from supratentorial structures. The VOIs were spatially transferred to the PET space (20) and applied to successive PET frames to generate time–activity curves. Plasma data were decay-corrected to the injection time. Metabolite-corrected plasma time–activity curves were obtained by applying high-pressure liquid chromatography data to total plasma time–activity curves as previously reported (24).
Evaluation of Kinetic Approaches
Applicability of the 1- and 2-tissue-compartment models and plasma reference graphical analysis (25) (PRGA) was examined. The Akaike information criterion (26) was used to examine whether the 1-tissue-compartment model could be justified over the 2-tissue-compartment model (27). The outcome variables were distribution volume (VT) and distribution volume ratio (DVR). Tracer circulation times of 90, 120, and 200 min were used in the tracer evaluation.
Reference tissue graphical analysis (28) (RTGA) and the multilinear reference tissue method with 2 parameters (29) were also evaluated (outcome variable: DVR). SUVR was obtained as the target–to–cerebellar gray matter ratio at 60–90 min after injection.
Test–Retest Evaluation
Test–retest variability (given as a percentage) and interclass correlation coefficient were calculated in individual regions as the mean of [test – retest] over the means of test and retest values across subjects to evaluate the reproducibility of PET outcome variables. A level of 10% test–retest variability was considered acceptable (30). Test–retest variability was calculated separately for AD and OC subjects because of expected differences in value ranges.
Identification of Tau-Positive Individuals
TPF was defined as the fraction of voxels of a given VOI that exceeded the mean SUVR plus 2.5 SDs of the same VOI in YC and OC subjects. Mean, composite, and maximal TPFs, and conventional global mean SUVRs or mean SUVRs of composite regions (15), were evaluated for their ability to discriminate AD from OC and YC subjects.
Statistics
Values are expressed as mean and SD, when applicable. To compare groups, 2-way (group x region) ANOVA was performed first. When either effect was shown significant, subsequent t testing was performed with the significance level set at a P value of less than 0.05 and with Bonferroni adjustment for multiregion comparisons.
RESULTS
Demographic and scan information on the participants is shown in Table 1. There were no statistical differences in injected radioactivity or mass between groups. Three 120-min scans were terminated early (at 75 and 85 min) or interrupted (for <5 min) because of restroom breaks, resulting in varying numbers of scans for circulation times of 90, 120, and 200 min (Table 1).
Demographic and Scan Information
Tissue time–activity curves peaked within 5 min of the tracer injection (Fig. 1). Thereafter, the time–activity curves of AD subjects showed varying degrees of retention across regions and subjects, whereas the time–activity curves of OC and YC subjects showed rapid clearance across regions. In YC and OC subjects, SUVR, or frame-by-frame SUVR, became stable after approximately 60 min, except for putamen, whose SUVR slightly declined at later times. In AD subjects, SUVR approached plateaus of varying heights by 150 min in the subject who showed the highest SUVR. YC and OC subjects showed a relatively homogeneous radioactivity distribution at 60–90 min (Fig. 2), whereas AD subjects showed a heterogeneous pattern of tracer retention in brain regions known to exhibit tau pathology in AD subjects. No off-target binding was noted in the basal ganglia, thalamus, choroid plexus, or white matter (pons, 0.98 ± 0.10; corpus callosum, 0.93 ± 0.08 [mean ± SD of SUVR of AD]); some retention was evident in the substantia nigra. In 1 control subject, tracer retention was observed in the cerebellar vermis. Extracerebral retention was occasionally observed in the meninges and often in the retina.

Plots of time–activity curves (top) and time profiles of SUVR (bottom) of 18F-RO-948 in selected brain regions for representative subjects. Solid lines = left side of brain; dotted lines = right side of brain.
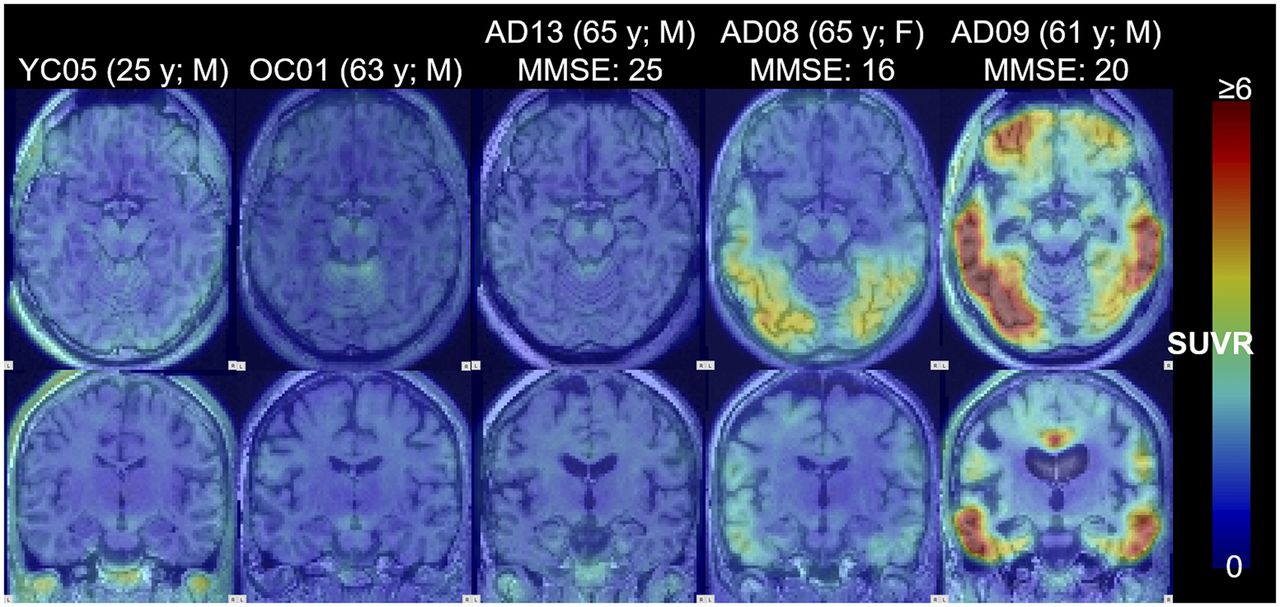
Images of SUVR (60–90 min) of 18F-RO-948 for representative YC, OC, and 3 levels (by mean SUVR) of AD subjects. Transaxial images (top) show medial and lateral temporal regions, and coronal images (bottom) were cut through uncus. Maximal SUVR for display was set at 6. MMSE = mini-mental state examination score.
Total plasma time–activity curves peaked within 1 min of the tracer injection, cleared rapidly until about 5 min, remained stable toward 20 min, and slowly decreased thereafter (Supplemental Fig. 1A; supplemental materials are available at http://jnm.snmjournals.org). Parent fractions in plasma were 16.0% ± 5.2% at 30 min and 9.9% ± 3.5% at 90 min (Supplemental Fig. 1B). In longer scans, parent fractions were 7.3% ± 2.9% at 120 min and 2.1% ± 0.9% at 200 min. Because of the metabolism, plasma time–activity curves of the parent compound decreased monoexponentially after the peaks.
Plasma Input Methods
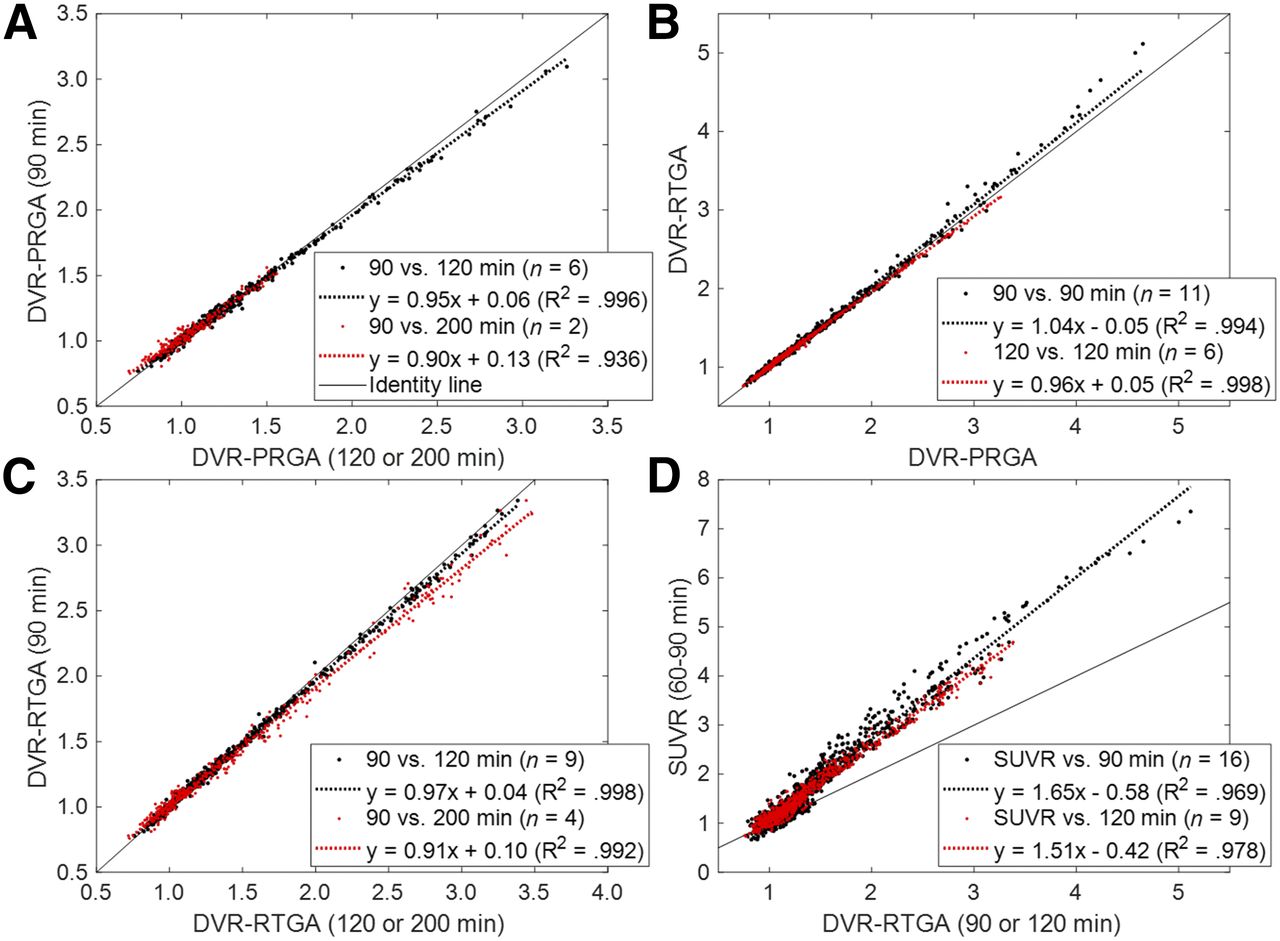
On visual inspection, model-predicted time–activity curves aligned well with observed time–activity curves across frames for the 2-tissue-compartment model (Fig. 3A) but not for the 1-tissue-compartment model (not shown). In agreement, the 2-tissue-compartment model showed lower Akaike information criterion values in 95% of regions. These findings support the use of the 2-tissue-compartment model over the 1-tissue-compartment model for 18F-RO-948. Plots of PRGA approached asymptotes by 20 min (t*) in AD and OC subjects and showed excellent linearity (R2 > 0.98) in more than 98% of regions for circulation times of 90, 120, and 200 min (Fig. 3B). Although PRGA (y) yielded tightly correlated VT values to the 2-tissue-compartment model at 90 min (y = 0.87·x + 0.60; R2 = 0.942), the 2-tissue-compartment model yielded sporadic outlier values (incidence: 0.7% of regions; outliers: 1 range below or above the observed range of RTGA values). Regional VT and DVR data at 90 min were tightly proportional (i.e., regression lines passed through the theoretic origin) to respective data at 120 and 200 min (Fig. 4A; Supplemental Fig. 2A), although slopes minimally decreased as a function of circulation time. Very similar regression results were obtained when data of the OC, YC, and AD groups were pooled (Supplemental Figs. 2B and 2C). These findings establish the timewise consistency of VT and DVR across the 90-, 120-, and 200-min analyses, which validated the 90-min dynamic scans for derivation of VT and DVR for 18F-RO-948.

Plots of observed and model-predicted tissue time–activity curves (TACs) of 2-tissue-compartmental model (A), PRGA (B), multilinear reference tissue method with 2 parameters (C), and RTGA (D) for AD subjects who had highest mean SUVRs with (A and B) and without (C and D) arterial plasma data. A(T), R(T), and C(T) stand for TACs in target and reference regions and in plasma, and  for the brain-to-blood clearance constant of the reference region.

(A) Scatterplot of regional DVR data for PRGA at 90 min (y) vs. 120 and 200 min. (B and C) Scatterplots of regional DVR data for RTGA (y) vs. PRGA at 90 and 120 min (B) and for RTGA at 90 min (y) vs. 120 and 120 min (C). (D) Scatterplot of SUVR data (y) vs. DVR data for RTGA at 90 and 120 min (D). Regression equations are shown in keys.
Reference Tissue Methods
The brain-to-blood transfer rate constant of the reference region was estimated from the intercepts of PRGA (25) and set at 0.05 min−1, and t* was set at 15 min after R2 was confirmed to be more than 0.98 in over 95% of regions. RTGA yielded DVRs essentially identical to PRGA at 90 and 120 min for DVRs of less than 3.5 and showed a trend to slightly overestimate for DVRs above 3.5 (Fig. 4B). These results validated the RTGA by agreement with PRGA. RTGA also yielded strictly proportional DVRs at 90 min against the 120- and 200-min analyses (C). The multilinear reference tissue method with 2 parameters showed statistically indistinguishable correlations to PRGA and timewise consistency with RTGA (data not shown). Regional SUVR data correlated very well to the DVRs of RTGA at 90 and 120 min (D). These findings validated SUVR against RTGA.
Test–Retest Evaluation
The numbers of subjects for calculation of test–retest variability are shown in Table 1. The durations between the 2 scans ranged from 14 to 38 d. The median test–retest variabilities of AD were 2.5% and 2.7% for the DVR of PRGA and RTGA, and 4.6% for SUVR across 56 regions relevant for AD in which mean SUVR exceeded 1.5 (Fig. 5). The 56 regions also showed excellent interclass correlation coefficients (>0.92). Results for all 80 regions are shown in Supplemental Figure 3.

Box plot of regional test–retest variability estimates for PRGA and RTGA (variable: DVR) and SUVR for AD subjects in regions where mean SUVR exceeded 1.5 (56 left and right regions). Boxes indicate median value and upper 25th and 75th percentiles, and whiskers indicate highest and lowest values, excluding outliers (black dots; data points exceeding ±2.7 SDs). Dotted line indicates desired test–retest variability level of 10%.
Application of 18F-RO-948 to AD and Control Subjects
SUVRs in AD subjects (Fig. 6A) generally agreed with published data on 18F-AV1451 (Table 2) (18). Values in AD subjects showed wide dynamic ranges across regions; minimum values in AD subjects were slightly lower than maximum values in OC subjects across regions, resulting in complete separation (minimum values of AD > maximum values of OC) in 7 VOIs alone. Between OC and YC subjects, slightly higher values of VT in the cerebellar gray matter of the OC group resulted in opposite group effects for VT (OC < YC: Supplemental Fig. 4) and for SUVR (OC > YC), albeit no regions showed significant differences after Bonferroni adjustment for both variables (threshold P = 0.05/40 = 0.0012). The regional SUVRs of YC and OC subjects (Fig. 6B) correlated with the regional SUVRs of AD subjects (YC = 0.28·AD + 0.63, R2 = 0.396, P < 10−9; OC = 0.20·AD + 0.72, R2 = 0.483, P < 10−12), although slopes were very shallow and no regions showed high SUVRs (i.e., SUVR > 1.5). One possible interpretation of the weak but significant correlation between the SUVRs of OC and YC subjects and those of AD subjects is that the tracer may be detecting early forms of tau aggregates. Further work is required to test this hypothesis.
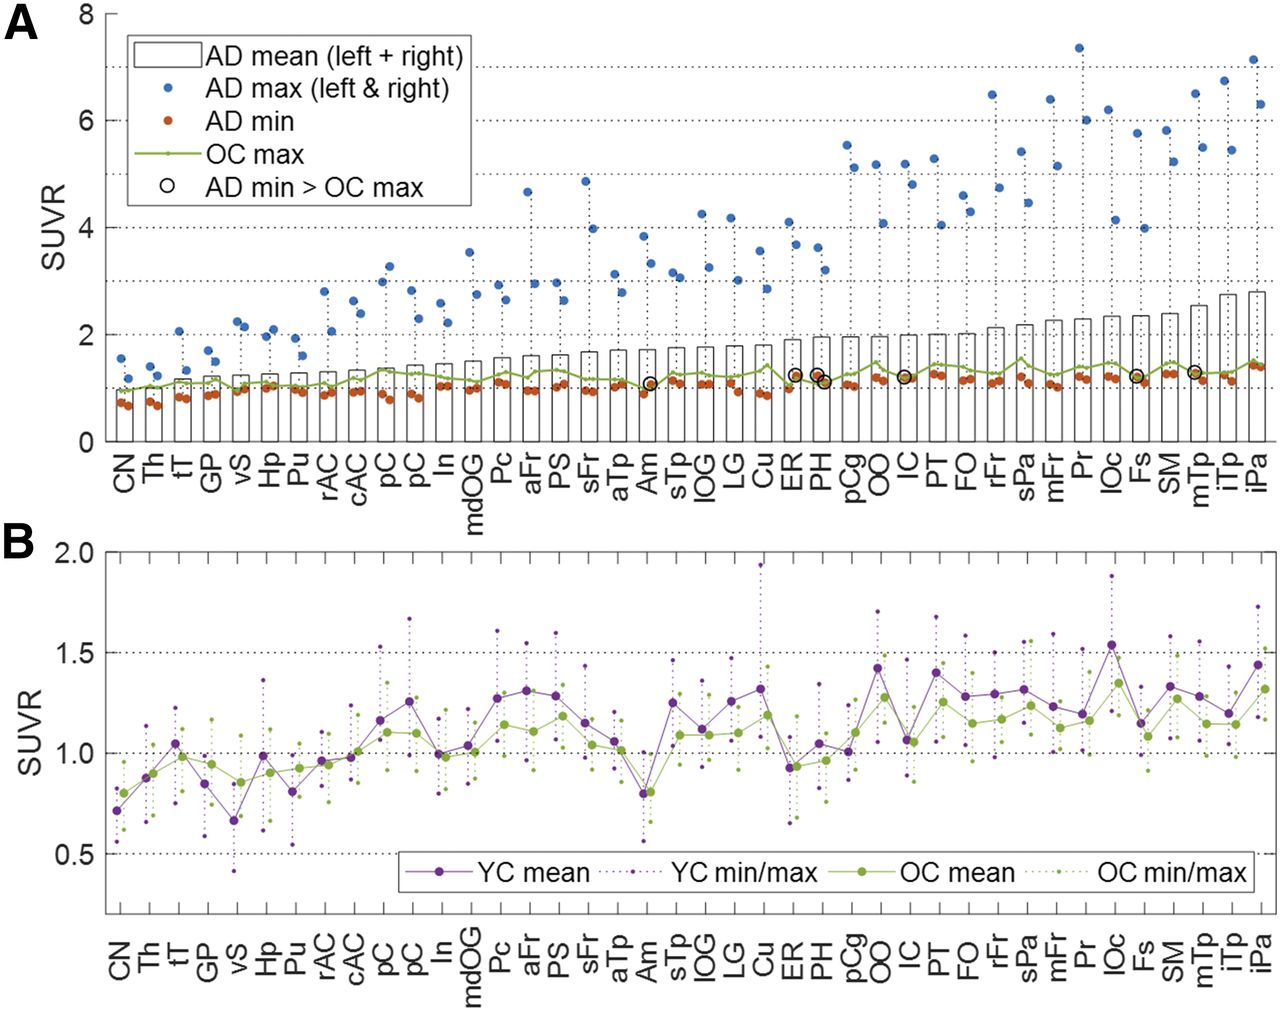
(A) Histogram of mean SUVR for AD subjects in ascending order, together with plots of minimal and maximal values for AD subjects (in left and right sides of brain), and maximal values for OC subjects. (B) Line plot of mean SUVR for OC and YC subjects (left and right sides of brain merged), together with plots of respective minimal and maximal values. Key to abbreviated brain regions is in Table 2.
Forty Brain Regions in Descending Order of SUVR of 18F-RO-948
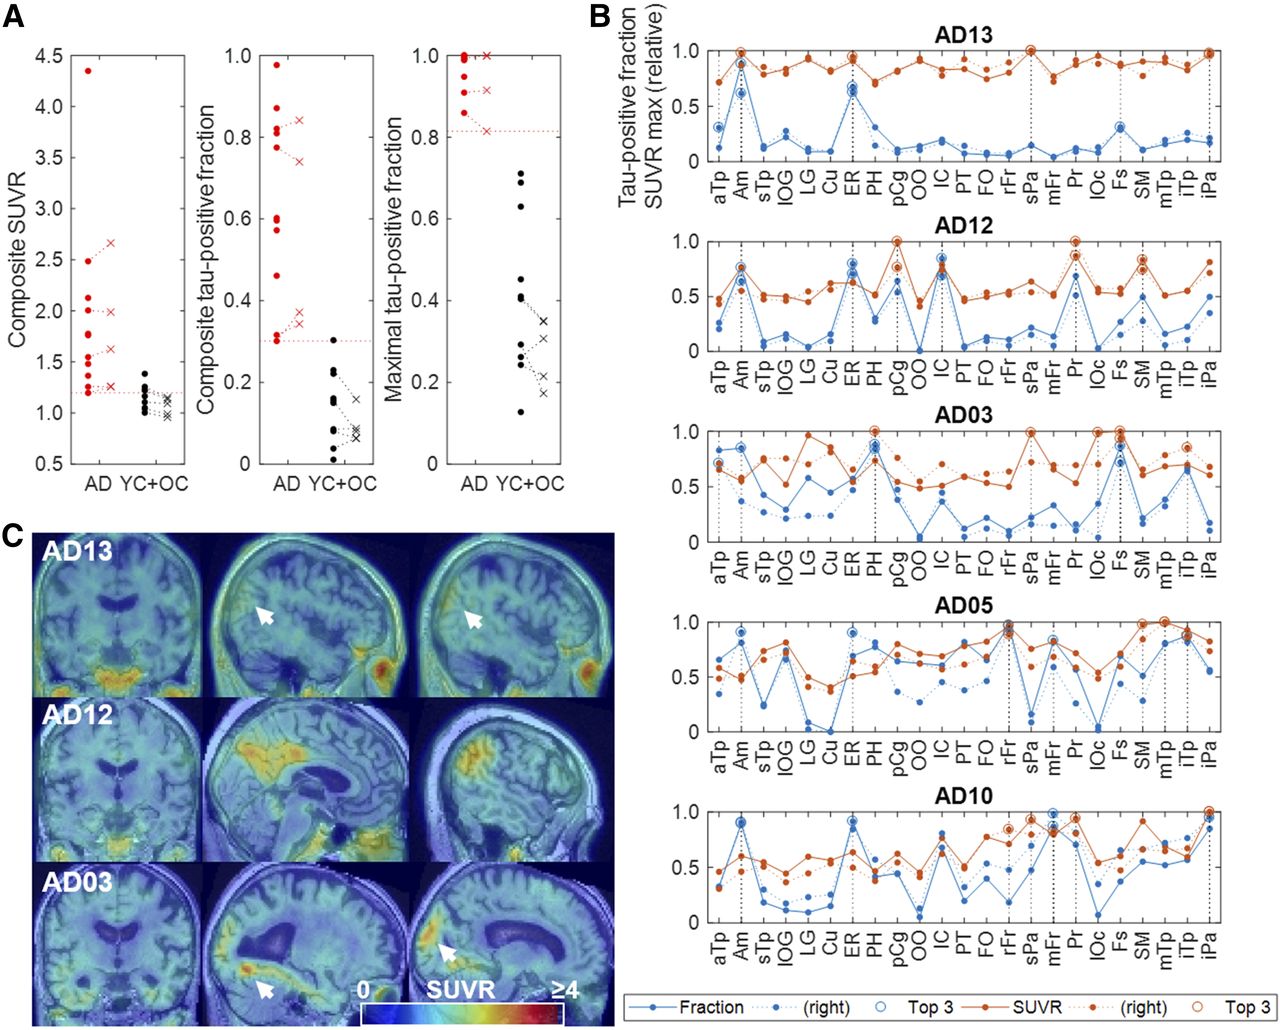
Composite SUVR and TPF, and maximal TPF, respectively, showed increasingly better discrimination of the AD group from the control group (Fig. 7A), whereas global SUVR and TPF showed lesser discrimination (results not shown). Line plots of regional TPF and relative maximal SUVR (Fig. 7B; Supplement Fig. 5 for all AD subjects) revealed that high TPFs (>0.8) were observed even in cases of very mild AD in specific regions such as the amygdala, entorhinal area, parahippocampus, and fusiform gyrus, whereas high relative maximal SUVRs (the 3 regions [per side of brain] that had the highest TPF or relative SUVR) could occur outside the above-mentioned regions without elevation of TPFs (<0.5), such as in the superior parietal lobe (AD patients 13 and 3) and in the inferior parietal lobe (AD patient 13). YC and OC data were pooled for the above evaluations.

(A) Scatterplots of composite SUVR and TPFs, and maximal tau-positive fractions of individual subjects in baseline (dots) and retest (x) scans of AD and OC + YC subjects. (B) Line plots of TPRs and maximal SUVRs of individual regions (showing highest 23 regions alone) for 5 subjects who showed lowest composite SUVR and TPRs. Three regions (per side of brain) that had highest TPF or relative SUVRs are separately shown by circles and denoted in key as Top 3. (C) SUVR images of 3 mildest cases showing locations where maximal SUVRs were observed. Key to abbreviated brain regions is in Table 2.
DISCUSSION
This study demonstrated that 18F-RO-948 is a promising radioligand for quantitative imaging of tau pathology in AD subjects. First, the kinetics of the radioligand followed the 2-tissue-compartment model and PRGA up to 200 min. Second, the interregional and intersubject relationships of DVR and SUVR at 90 min remained unchanged up to 200 min of circulation time, and these PET outcome variables showed excellent reproducibility in the test–retest evaluation. Showing slightly better reproducibility results, RTGA may be preferable to SUVR for longitudinal studies. These findings confirm that 18F-RO-948 has excellent kinetic properties (31,32). Furthermore, 18F-RO-948 appears to be free of binding to monooxidase B (11), high retention in white matter, or brain-penetrant radioactive metabolites as reported for other tau tracers (33–37).
To date, AV1451 is the most widely used and characterized tau tracer and can thus be considered a benchmark for comparison. Differences and similarities are noted regarding binding of 18F-RO-948 and 18F-AV1451 in control subjects. In this limited-subject sample, 18F-RO-948 appeared to be free of off-target retention in the basal ganglia, thalamus, and choroid plexus in contrast to 18F-AV1451 (17,18,38). Off-target retention in the latter structure has been reported to contaminate the 18F-AV1451 signal in the hippocampus (15,16). In addition, 3H-RO-948 lacks affinity to monoamine oxidase A and B (11), again in contrast to 18F-AV1451 (39). Off-target 18F-RO-948 retention was observed in the substantia nigra (SN) and in the cerebellar vermis in 2 YC subjects. Although we have no explanation for the latter, the former could be ascribed to binding to neuromelanin deposits as indicated by autoradiographic studies in SN sections (results not shown). Binding to melanin has been reported also for other tau tracers (15).
Among quantitative approaches with 18F-AV1451, the mean SUVR of composite regions (15,16) failed to discriminate individual AD subjects from control subjects as accurately as other regionally based methods. The composite SUVR of 18F-RO-948 showed similar, suboptimal separation capabilities. Maximal TPF appeared to be promising for identification of tau positivity in individual scans, showing a significant margin between AD and control subjects. The progressive improvement could be explained by the progressively narrower AD distributions along the total observed ranges from composite SUVR to composite FTP to maximal TPF. The analysis of regional TPF and relative maximal SUVR suggests that initial tau deposition in AD could start not only in the region of the mesial (amygdala, entorhinal area, fusiform gyrus, and parahippocampus) and lateral inferior temporal lobe but also in the lateral parietal areas (superior parietal lobe and supramarginal), thus supporting the notion of anatomic variability in the pattern of tau deposition (9). Similar patterns of regional involvement in cases of very mild AD were reported with 18F-AV1451 (15) by means of visual inspection alone. Therefore, analysis of regional TPF and relative maximal SUVR could be useful for improving our understanding of the progression of tau pathology in various subtypes of AD.
This study had some limitations. First, the findings for group comparisons should be considered preliminary because of the limited numbers of subjects. Accordingly, the usefulness of TPF should be examined further with larger numbers of AD subjects at different stages of the disease. Second, the current scan duration (200 min) included DVRs of up to 3.5 and SUVRs of up to 4.5. Although these ranges are expected to be sufficient for most applications, the effect of scan duration on quantification may need to be further validated using subjects with more advanced tau accumulations.
CONCLUSION
18F-RO-948 is a promising radioligand for imaging tau pathology in AD, showing excellent kinetic properties and displaying little off-target binding. 18F-RO-948 SUVRs showed excellent reproducibility, and SUVR-derived variables appeared to be promising for identification of tau positivity in individual scans and for characterization of progression of tauopathies in AD.
DISCLOSURE
Johns Hopkins University faculties receive salary support through several sponsored research sources, including NIH career award K24 DA000412 to Dean Wong, and none receive direct funding from Roche except via sponsored Johns Hopkins University contracts. This study was funded by a F. Hoffmann-La Roche Ltd. contract to Johns Hopkins University. No other potential conflict of interest relevant to this article was reported.
Acknowledgments
We thank the staff of the Johns Hopkins PET Radiotracer Center (Dr. Hayden T. Ravert, Dr. William B. Mathews, Daniel P. Holt, and Andrew W. Hall) for their radiochemistry expertise. Robert A. Comley is currently with AbbVie Inc., USA.
Footnotes
Published online Aug. 10, 2018.
- © 2018 by the Society of Nuclear Medicine and Molecular Imaging.
REFERENCES
- Received for publication February 23, 2018.
- Accepted for publication May 14, 2018.


Jump to section
Related Articles
Cited By...
- Hemispheric Asymmetry of Tau Pathology is Related to Asymmetric Amyloid Deposition in Alzheimers Disease
- In Vivo Head-to-Head Comparison of [18F]GTP1 with [18F]MK-6240 and [18F]PI-2620 in Alzheimer Disease
- The Use of Tau PET to Stage Alzheimer Disease According to the Braak Staging Framework
- The Use of Tau PET to Stage Alzheimer Disease According to the Braak Staging Framework
- CenTauR: Towards a Universal Scale and Masks for Standardizing Tau Imaging Studies
- An optimized reference tissue method for quantification of tau protein depositions in diverse neurodegenerative disorders by PET with 18F-PM-PBB3 (18F-APN-1607)
- Independent information from PET, CSF and plasma biomarkers of tau pathology in Alzheimers disease
- Evaluation of Dosimetry, Quantitative Methods, and Test-Retest Variability of 18F-PI-2620 PET for the Assessment of Tau Deposits in the Human Brain
- The implications of different approaches to define AT(N) in Alzheimer disease
- Characterization of 3 Novel Tau Radiopharmaceuticals, 11C-RO-963, 11C-RO-643, and 18F-RO-948, in Healthy Controls and in Alzheimer Subjects