


Abstract
18F-PI-2620 is a next-generation tau PET tracer that has demonstrated ability to image the spatial distribution of suspected tau pathology. The objective of this study was to assess the tracer biodistribution, dosimetry, and quantitative methods of 18F-PI-2620 in the human brain. Full kinetic modeling to quantify tau load was investigated. Noninvasive kinetic modeling and semiquantitative methods were evaluated against the full tracer kinetics. Finally, the reproducibility of PET measurements from test and retest scans was assessed. Methods: Three healthy controls (HCs) and 4 Alzheimer disease (AD) subjects underwent 2 dynamic PET scans, including arterial sampling. Distribution volume ratio (DVR) was estimated using full tracer kinetics (reversible 2-tissue-compartment [2TC] model and Logan graphical analysis [LGA]) and noninvasive kinetic models (noninvasive LGA [NI-LGA] and the multilinear reference tissue model [MRTM2]). SUV ratio (SUVR) was determined at different imaging windows after injection. The correlation between DVR and SUVR, effect size (Cohen’s d), and test–retest variability (TRV) were evaluated. Additionally, 6 HCs received 1 tracer administration and underwent whole-body PET for dosimetry calculation. Organ doses and the whole-body effective dose were calculated using OLINDA 2.0. Results: A strong correlation was found across different kinetic models (R2 > 0.97) and between DVR(2TC) and SUVR between 30 and 90 min, with an R2 of more than 0.95. Secular equilibrium was reached at around 40 min after injection in most regions and subjects. TRV and effect size for SUVR across different regions were similar at 30–60 min (TRV, 3.8%; Cohen’s d, 3.80), 45–75 min (TRV, 4.3%; Cohen’s d, 3.77) and 60–90 min (TRV, 4.9%; Cohen’s d, 3.73) and increased at later time points. Elimination was via the hepatobiliary and urinary systems. The whole-body effective dose was 33.3 ± 2.1 μSv/MBq for an adult female and 33.1 ± 1.4 μSv/MBq for an adult male, with a 1.5-h urinary bladder voiding interval. Conclusion: 18F-PI-2620 exhibits fast kinetics, suitable dosimetry, and low TRV. DVR measured using the 2TC model with arterial sampling correlated strongly with DVR measured by NI-LGA, MRTM2, and SUVR. SUVR can be used for 18F-PI-2620 PET quantification of tau deposits, avoiding arterial blood sampling. Static 18F-PI-2620 PET scans between 45 and 75 min after injection provide excellent quantification accuracy, a large effect size, and low TRV.
Alzheimer disease (AD), the most common cause of dementia among elderly adults, is characterized by memory loss, spatial disorientation, and cognitive impairment. Key pathologic features of AD include extracellular amyloid-β aggregates and intracellular tau neurofibrillary tangles (1). In particular, the role of tau phosphorylation in the pathophysiology of tauopathies remains only partially understood. As a consequence, accurate quantification of tau neurofibrillary tangles in the living brain is critical to expand current knowledge of the role of tau in tauopathies (1). Several PET tracers targeting tau have been discovered and are currently being tested in humans (2,3).
18F-PI-2620 is a next-generation tau PET tracer with high binding affinity for aggregated tau of both 3-repeat and 4-repeat isoforms, without specific tracer binding on brain slices from nondemented donors (4). In animal models, this compound has shown high selectivity, with no off-target binding to β-amyloid or monoamine oxidase A or B, and high initial brain uptake and fast washout (4). Initial clinical investigations confirmed the preclinical data and showed that 18F-PI-2620 is safe and accumulates in regions known to have tau deposition in AD subjects (5). Healthy controls (HCs) showed very low 18F-PI-2620 accumulation, and AD subjects could be clearly distinguished from HCs (5). Although visual assessment has shown 18F-PI-2620 to be suitable for detection of tau deposits in AD subjects, it may not sufficiently describe subtle longitudinal changes or tau deposition in early stages of the disease. Consequently, reliable quantitation of the tau load in the brain is critical in the research setting, either in observational clinical studies or in interventional therapeutic trials.
The objectives of this study were to describe the biodistribution and dosimetry of 18F-PI-2620, to assess the tracer kinetics of 18F-PI-2620 in the human brain, to identify optimal full kinetic modeling approaches to quantify tau load in the human brain using 18F-PI-2620, to assess the validity of noninvasive kinetic modeling and semiquantitative methods, and to assess the reproducibility of PET measurements with test–retest scans.
MATERIALS AND METHODS
Subjects
The study population consisted of 9 HC and 4 AD subjects. Three male and 3 female HCs (age range, 19–47 y) underwent a whole-body PET scan to assess the biodistribution and dosimetry of 18F-PI-2620. Three elderly HCs (age range, 61–75 y) and 4 AD subjects (age range, 58–71 y) underwent 1 18F-florbetaben and 2 18F-PI-2620 brain PET scans with arterial blood sampling. A T1-weighted MRI scan was acquired for each subject on a Siemens Espree 1.5-T to confirm eligibility criteria and to identify and delineate the brain anatomic regions of interest (ROIs). This study was conducted in accordance with the Declaration of Helsinki. The study protocol was reviewed and approved by the New England Institutional Review Board. All participants (or their legal representatives) provided written informed consent and underwent a screening evaluation that included baseline clinical laboratory testing, a physical and neurologic evaluation, and cognitive assessment.
Radiotracer Preparation
18F-PI-2620 was synthesized using a GE Healthcare TRACERlab FX-FN as recently described (4). 18F-PI-2620 was obtained with 16.2% ± 4.9% radiochemical yield (decay-corrected), 99.6% ± 1.6% radiochemical purity, and molar activity of 188.3 ± 66.6 GBq μmol−1. Neuraceq (18F-florbetaben) was obtained from Sofie.
Biodistribution and Dosimetry Study
Whole-Body Acquisition
Immediately after an intravenous bolus of 18F-PI-2620 had been administered, a series of whole-body PET images at 9 bed positions was acquired from the vertex of the head to the thighs over a period of 5.5 h in 3 scanning sessions using a Siemens Biograph PET/CT camera. The scanning sessions were separated by 30-min breaks, during which the subjects were allowed to leave the scanner bed. The first scanning session included 5 whole-body passes (2 × 60 and 3 × 120 s per bed position). The second and third sessions included 2 whole-body passes each (2 × 270 s per bed position). A whole-body CT transmission scan was acquired before each imaging session. Urine was collected 3–4 times (1–2 times after each scanning session, up to 6 h after radiotracer injection) to measure the excretion of 18F-PI-2620 through the urinary tract.
Dosimetry Estimation
Manually delineated ROIs were placed on the visually identified source organs (brain, lungs, heart wall, liver, gallbladder, intestines, marrow, kidneys, and urinary bladder), which were subsequently used for all PET frames. Each ROI covered the whole organ, with the exception of the bone marrow ROI, which included only the lumbar spine. Radioactivity was corrected for body attenuation but not for decay, and time–activity curves were generated for each source organ. Source organ time–activity curves were then expressed as percentage injected dose by normalization to the injected activity. Organ residence times were computed from the area under the non–decay-corrected time–activity curves via the trapezoid method. Area under the curve from end of imaging to infinity was computed with the assumption of physical decay only after the last imaging time point. The residence times for all source organs were summed and subtracted from the theoretic total residence time to calculate the residence time of the remainder of the body. Gastrointestinal tract model 30 of the International Commission on Radiological Protection was applied to compute the residence times in the small intestine, lower large intestine, and upper large intestine, with the assumption that activity enters the gastrointestinal tract via the small intestine, where the intestinal decay-corrected time–activity curve was used to estimate the fraction of radioactivity entering the intestine during the imaging period. A gallbladder-emptying model was used, and gallbladder residence times were computed on the basis of the model assumptions. Calculations were performed with and without modeling of urinary bladder voiding. When urinary bladder excretion was modeled, the residence times were calculated by fitting an exponential to the combined cumulative urinary bladder imaging data, with the measured urine samples collected after each of the 3 scanning sessions. Parameters representing the fraction leaving the body via urine and biologic half-time were obtained from the fit and used to model urinary bladder voiding. Urinary bladder voiding models with voiding intervals of 1.5 h were applied. The OLINDA/EXM1.1 software package was used to estimate the organ and whole-body absorbed radiation doses (6). The 70-kg adult male and the 55-kg adult female models were used. Organ-absorbed doses, effective doses, and effective dose equivalents were calculated as mean ± SD across subjects.
Tracer Kinetics Study
Image Acquisition and Reconstruction
All subjects underwent a 18F-florbetaben PET scan according to the standard methods for screening. All eligible subjects underwent 2 dynamic 18F-PI-2620 PET scans for test–retest assessment within 3 wk using a Siemens ECAT EXACT HR+ camera. Before the radiotracer injection and emission imaging, a transmission scan was performed with an external 68Ge rod source to provide coefficients for attenuation correction. Subjects were administered a single dose of 18F-PI-2620 per imaging visit (339.4 ± 5.2 MBq, 1.4 ± 0.7 μg [test], and 339.7 ± 7.5 MBq, 2.1 ± 1.1 μg [retest]) as a 3-min bolus through a venous catheter followed by a 10-mL saline flush. Dynamic PET imaging of the brain was acquired over 2 imaging sessions over the course of 180 min after tracer injection (0–90 min: 6 × 30 s, 4 × 1 min, 4 × 2 min, and 15 × 5 min; 120–180 min: 12 × 5 min). PET images were reconstructed in a 128 × 128 matrix (zoom of 2, pixel size of 2.574 × 2.574 mm) with the ordered-subsets expectation maximization algorithm (4 iterations, 16 subsets) and a post hoc gaussian filter of 5 mm. Corrections for random coincidences, scatter, system dead time, and attenuation were performed as provided by the camera manufacturer.
Arterial Blood Sampling
During 18F-PI-2620 PET imaging, arterial blood samples were collected at 0.75, 1.5, 2.25, 3, 3.75, 4.5, 5.25, 6, 8, 10, 15, 20, 25, 30, 45, 60, 75, and 90 min after injection. Samples were counted to measure activity in the total plasma and whole blood samples over time. Samples at 4.5, 8, 15, 30, 60, and 90 min after injection were analyzed to determine the unmetabolized parent fraction of 18F-PI-2620. Metabolite analysis and plasma protein binding (free fraction) was performed as recently described (7). The plasma activity corrected for metabolites was used as the input function for tracer kinetic modeling.
Image Analysis
Reconstructed PET images were processed using SPM12 software (http://www.fil.ion.ucl.ac.uk/spm/doc/), including motion correction and coregistration onto the individual MR images. The MR images were segmented into gray matter, white matter, and cerebrospinal fluid. Subsequently, the MR images were normalized into the standard Montreal Neurological Institute space, and the same transformation was applied to the coregistered PET images and gray matter probability maps. ROIs were defined as the intersection between the standard Automated Anatomic Labeling template (8) and the normalized gray matter segmentation thresholded at a probability level of 0.2. Cortical ROIs extracted from the Automated Anatomic Labeling anatomic template were the amygdala, hippocampus, parahippocampus, fusiform gyrus, inferior lateral temporal cortex, superior lateral temporal cortex, orbitofrontal cortex, prefrontal cortex, occipital cortex, parietal cortex, anterior cingulate cortex, posterior cingulate cortex, and cerebellar gray matter. Cerebellar gray matter, excluding vermis and anterior lobe surrounding vermis, was used as the reference region. The average activity concentration (kBq/mL) at each time point was determined for each ROI, and time–activity curves were generated.
Tracer Kinetic Modeling
Time–activity curves, plasma arterial samples corrected for metabolites, and whole-blood arterial samples collected up to 90 min after tracer injection were analyzed using the PMOD software package (version 3.7; PMOD Technologies). Invasive models (reversible 1-tissue compartment [1TC] model, reversible 2-tissue compartment [2TC] model, and Logan graphical analysis [LGA], t* = 20 min) were used to estimate the volume of distribution (VT) across regions (9,10). The distribution volume ratio (DVR) using the cerebellar cortex as a reference region was computed as VT/VT(reference region), with VT being the total volume of distribution in the target ROI and VT(reference region) being the total volume of distribution in the reference region (9). The binding potential was computed as DVR − 1. DVR, using the cerebellar gray matter as a reference region, was also estimated using the noninvasive Logan graphical plot (NI-LGA) (t* = 20 min, k2′ = 0.22 min−1) (10) and the multilinear reference tissue model (MRTM2) (t* = 20 min, k2′ = 0.22 min−1) (11). The k2′ used in NI-LGA and MRTM2 was the average k2′ derived from the full tracer kinetic modeling using 2TC. The Akaike information criterion was used to determine the optimal kinetic modeling approach.
SUV Ratio (SUVR)
Mean radioactivity concentration (kBq/mL) at each time point was obtained from each ROI. SUVR at different time points was calculated as the ratio of the activity in the target ROI to the activity in the reference region ROI (cerebellar gray matter). SUVR was determined at six 30-min imaging windows by averaging the SUVR at different time points within each imaging window (20–50, 30–60, 45–75, 60–90, 120–150, and 150–180 min after injection). The secular equilibrium interval, defined as the imaging window where SUVR becomes stable over time, was determined by visual inspection of the SUVR over time curves.
Statistical Analysis
Reproducibility of PET measurement (DVR and SUVR) was assessed by means of the test–retest variability (TRV) and intraclass correlation coefficient. TRV was calculated as the mean of the absolute differences in the test minus the retest divided by the mean of the test and retest expressed as a percentage (TRV = 200 [test − retest]/[test + retest]). The intraclass correlation coefficient was calculated as [MSBS − MSWS]/[MSBS + (k − 1) MSWS], where MSBS and MSWS are the mean sum of squares between and within subjects, respectively, and k is the number of repeated observations (k = 2 in this study). The effect size between AD subjects and HCs was assessed by means of Cohen’s d. DVR and SUVR measures were compared by means of linear regression.
RESULTS
Subject Demographics
In total, 9 HC and 4 AD subjects were assessed as part of these analyses. For the biodistribution and dosimetry study, 6 HCs (3 men and 3 women, 31.3 ± 10.2 y old) were included. Their demographics are shown in Supplemental Table 1 (supplemental materials are available at http://jnm.snmjournals.org). For the tracer kinetic study and test–retest scanning, 3 β-amyloid–negative HCs (1 man and 2 women; 67.0 ± 7.2 y old; MMSE range, 29–30) and 4 β-amyloid–positive AD subjects (3 men and 1 woman; 65.3 ± 6.1 y old; MMSE range, 15–28) were included. Subject demographics, clinical characteristics, and β-amyloid PET status for these subjects are presented in Table 1, and more details are shown in Supplemental Table 2. One AD subject’s retest scan (subject 4) was not evaluable because of substantial motion during acquisition and was excluded from the test–retest analysis. For the whole subject sample, no adverse events were observed, and no serious adverse events related to the imaging agent, 18F-PI-2620, were observed.
Demographics for Subjects Enrolled in Tracer Kinetics Study
Biodistribution and Dosimetry Study
18F-PI-2620 elimination was observed via both the hepatobiliary and the urinary system (Supplemental Figs. 1 and 2). The whole-body effective dose was 33.3 ± 2.1 μSv/MBq (adult female) and 33.1 ± 1.4 μSv/MBq (adult male), with a 1.5-h urinary bladder voiding interval. The target organ with highest exposure (critical organ) was the right colon in both the adult female model (222 ± 28 μSv/MBq) and the adult male model (262 ± 12 μSv/MBq). The individual organ residence times and doses are provided in Supplemental Tables 3–5.
Tracer Kinetics Study
Visual Assessment
No areas of specific 18F-PI-2620 retention were identified in HCs, and a consistent pattern of initial uptake and fast washout was observed throughout (Fig. 1A). Asymmetric tracer uptake was identified in cortical regions in 3 of the 4 AD subjects (Fig. 1B). One AD subject (subject 4) showed only slightly increased tracer retention. Within each subject, the 18F-PI-2620 test and retest images were visually comparable (upper and lower rows in Figures 1A and 1B, respectively). Visual assessment of SUVR images at different imaging windows indicated similar patterns of tracer retention (Supplemental Fig. 3).
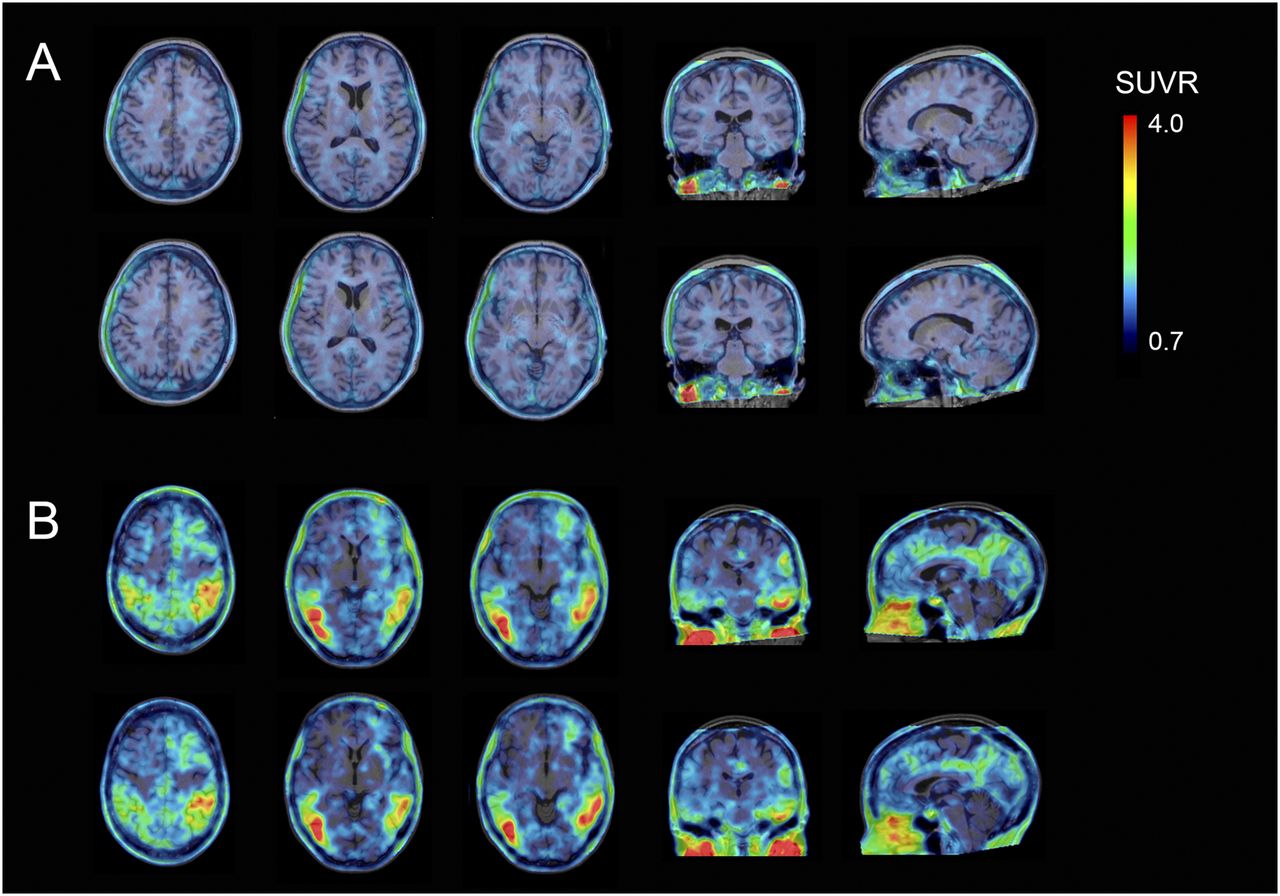
18F-PI-2620 test and retest SUVR images (45–75 min). (A) Images from HC subject 1 (65 y old; MMSE, 29; CDR, 0; ADAS-Cog, 5). (B) Images from AD subject 6 (62 y old; MMSE, 28; CDR, 0.5; ADAS-Cog, 16). Upper row in each panel shows test images and lower row retest images. Scans were normalized to cerebellar gray matter and were coregistered to MR images.
Time–Activity Curves
In the HCs, both the cortex and the cerebellar gray matter showed similar time–activity curve patterns, peaking at around 5 min after injection and showing a rapid washout thereafter. In AD subjects, washout from areas of specific uptake was slower than in HCs, whereas the cerebellar cortex time–activity curves were similar to those of HCs. Both HC and AD subjects displayed rapid clearance of the tracer from the reference region and across brain regions devoid of tau (Supplemental Fig. 4).
Blood Sample Analyses
Arterial blood measures were consistent between test and retest scans within each subject. No species more hydrophobic than the parent compound were detected, indicating the probable absence of brain-penetrating metabolites (Supplemental Fig. 5). 18F-PI-2620 metabolism was slightly faster in AD subjects than in HCs; the remaining parent compound was 12.7% ± 5.0% and 19.6% ± 5.1%, respectively, at 30 min and 7.7% ± 4.0% and 11.0% ± 3.8%, respectively, at 90 min. Fifteen minutes after injection, the fraction of activity corresponding to unmetabolized parent compound in plasma dropped from the initial value to 27% ± 9.7% (AD subjects) and 40.6% ± 9.2% (HCs). Afterward, a slow decrease was observed until its final level (∼10%) was reached (Supplemental Fig. 5). Free fraction for test and retest scans, respectively, was 0.52% ± 0.24% and 0.43% ± 0.31% in AD subjects and 0.38% ± 0.11% and 0.33% ± 0.02% in HC subjects.
Invasive Kinetic Models
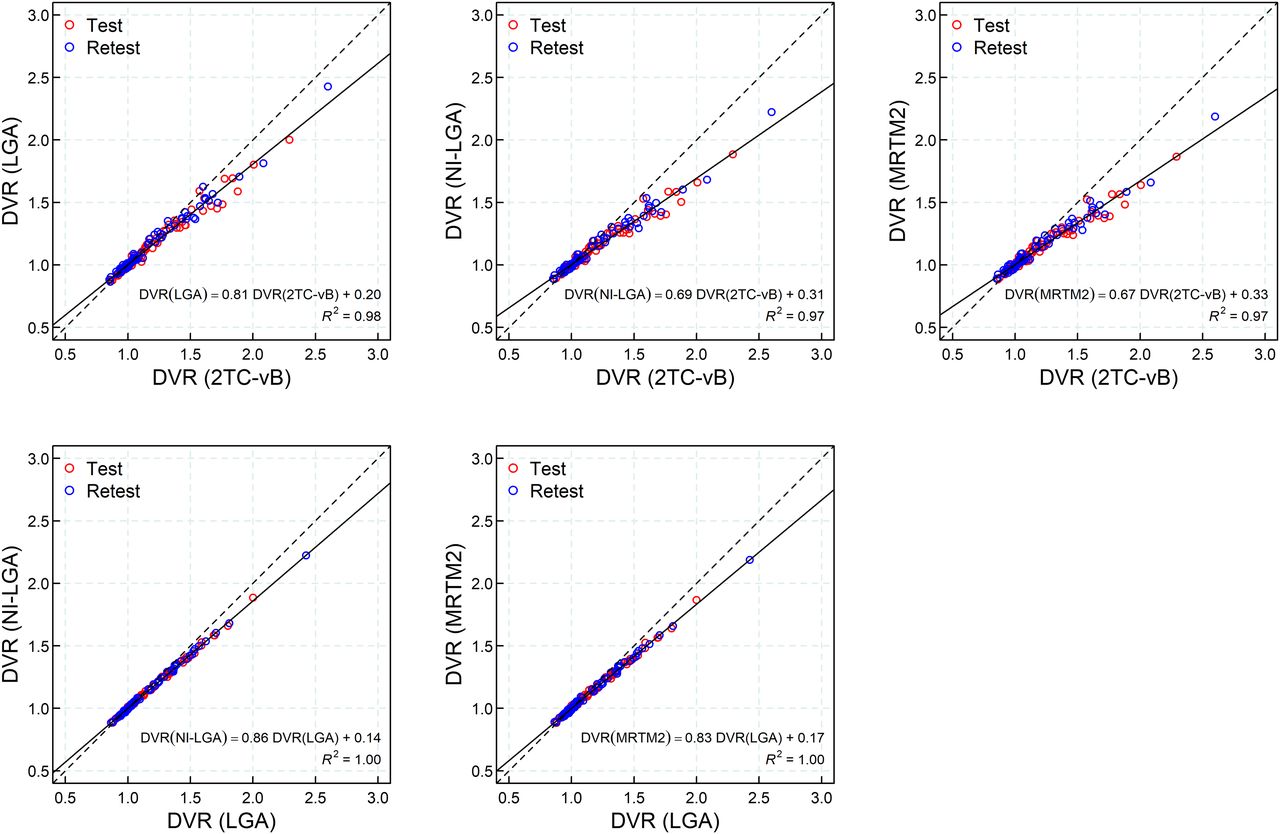
On visual inspection, the 2TC model including the cerebral cortical vascular fraction (vB) fitted the time–activity curves adequately (Fig. 2). Poor fitting to the data was achieved using the 1TC (data not shown). The Akaike weights used as a model selection criterion favored the use of a 2TC model in all regions (Akaike information criterion: −24.02 ± 24.9 [2TC], 28.18 ± 17.36 [2TC, fixed vB = 0.05], 52.21 ± 17.98 [1TC, fixed vB = 0.05], and 79.68 ± 12.43 [1TC]). The 2TC model provided lower Akaike information criterion values in 99.31% of regions in comparison to the 2TC model with fixed vB (vB = 0.05) and in 100% of the regions in comparison to 1TC with or without fixing vB. Therefore, 2TC model fitting with vB fitted (2TC-vB) was used for the successive analysis. Excellent agreement was found between DVR estimated with the 2TC-vB model and LGA (DVR[LGA] = 0.20 + 0.81⋅DVR[2TC-vB], R2 = 0.98) (Fig. 3).
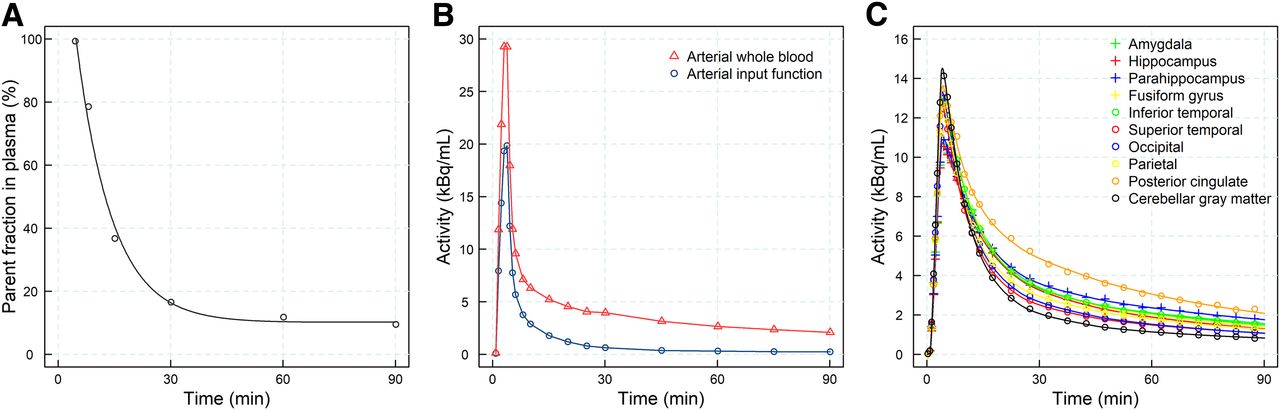
Data from representative AD subject (subject 5). (A) Percentage parent fraction in arterial plasma after intravenous injection of 18F-PI-2620, including biexponential function fit. (B) Metabolite-corrected arterial plasma concentration and arterial whole-blood concentration of 18F-PI-2620. (C) Time–activity curves from selected brain regions with 2TC-vB model fitting.

Regression analysis between DVR obtained using invasive models (2TC-vB and LGA) and DVR obtained using noninvasive kinetic models (NI-LGA and MRTM2). Solid line corresponds to linear regression fitting, and dashed line corresponds to identity line.
Noninvasive Kinetic Models
An excellent correlation in DVR was found between the 2TC-vB model and the noninvasive kinetic models. However, DVR from NI-LGA and MRTM2 underestimated DVR derived from 2TC-vB (DVR[NI-LGA] = 0.31 + 0.69⋅DVR[2TC-vB], R2 = 0.97; DVR[MRTM2] = 0.33 + 0.67⋅DVR[2TC-vB], R2 = 0.97) (Fig. 3).
SUVR
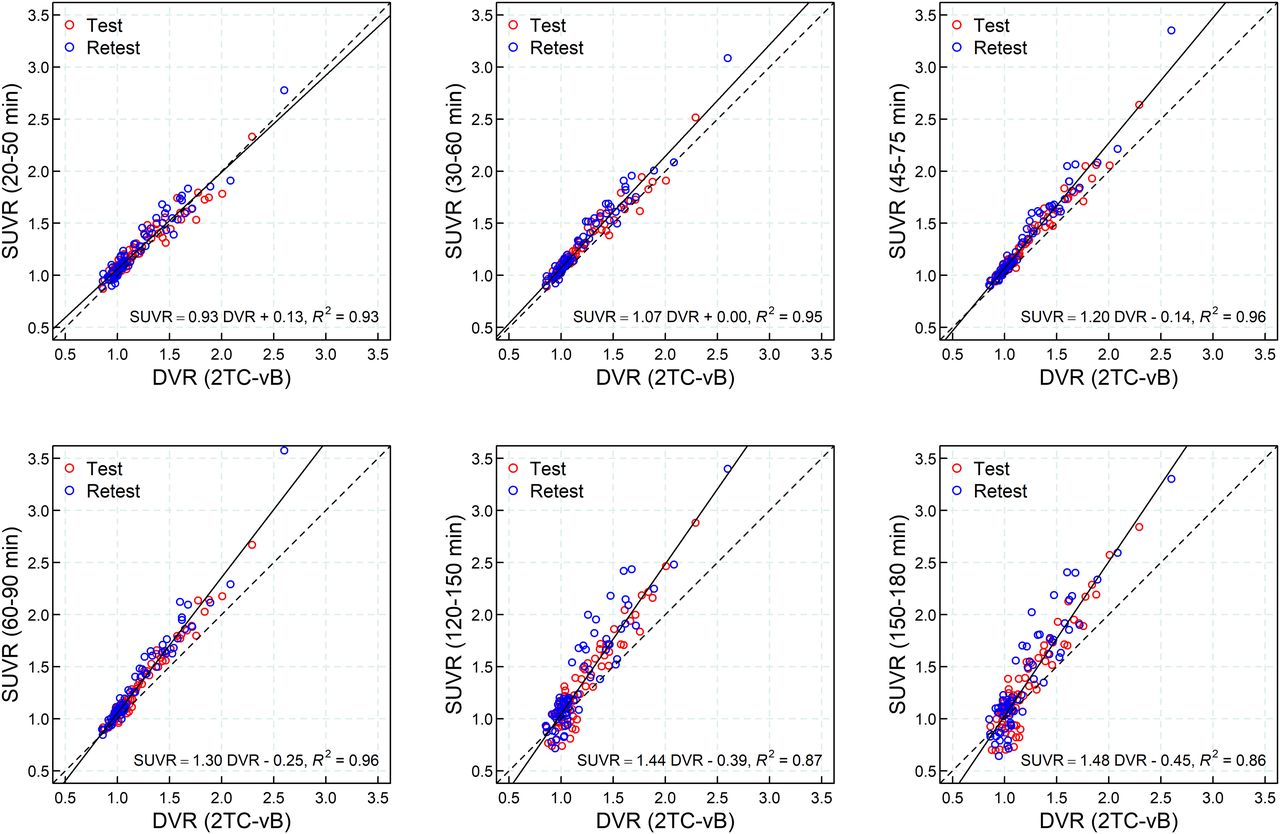
Secular equilibrium was identified on visual inspection at around 40 min after injection in most regions and subjects. In some instances, secular equilibrium was not achieved and SUVR increased steadily during the whole scan (Fig. 4). A strong correlation was found between DVR(2TC-vB) and SUVR for all imaging windows between 30 and 90 min after injection (R2 > 0.95) (Fig. 5).
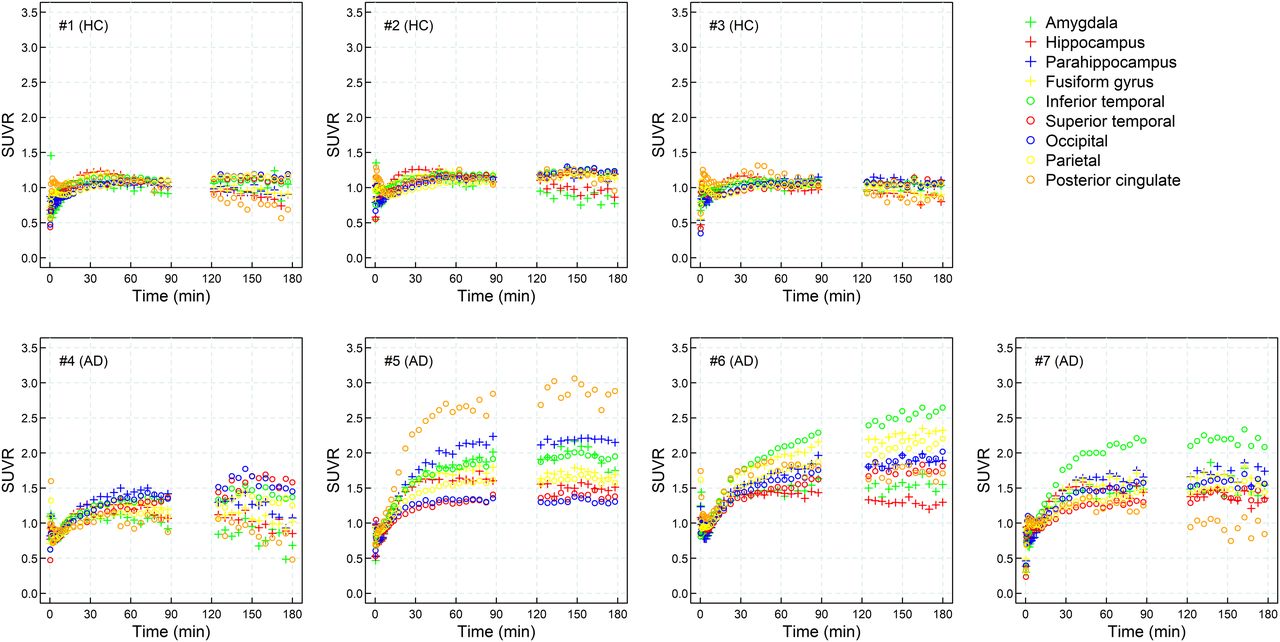
SUVR time curves for all test 18F-PI-2620 PET scans included in study (average of left and right hemispheres).

Regression analysis between DVR obtained using invasive 2TC-vB and SUVR at different imaging windows: 20–50 min, 30–60 min, 45–75 min, 60–90 min, 120–150 min, and 150–180 min. Solid line corresponds to linear regression fitting, and dashed line corresponds to identity line.
TRV, Intraclass Correlation Coefficient, and Effect Size
The elapsed time between the 2 scans was 6 ± 3 d (range, 3–11 d). The lowest median TRV across regions was achieved by means of tracer kinetic models (3.6% DVR[2TC-vB], 3.6% DVR[LGA], 2.8% DVR[NI-LGA], 2.7% DVR[MRTM2]) (Table 2). The minimum TRV for SUVR was achieved at the imaging windows between 20 and 90 min (3.8% [30–60 min], 4.3% [45–75 min], 4.9% [60–90 min]). All methods analyzed showed excellent intraclass correlation coefficients (>0.94) (Table 2). Excellent discrimination between AD subjects and HCs measured by means of the effect size was found (Cohen’s d: 2.75 ± 1.29 DVR[2TC-vB], 3.30 ± 1.83 DVR[LGA], 3.35 ± 1.84 DVR[NI-LGA], 3.32 ± 1.80 DVR[MRTM2]). For SUVR, the maximum effect size was achieved at imaging windows between 30 and 90 min (3.80 ± 2.11 [30–60 min], 3.77 ± 2.19 [45–75 min], 3.73 ± 2.27 [60–90 min]) (Table 2).
Absolute Value of Percentage TRV, Intraclass Correlation Coefficient, and Cohen’s d Across All Regions Analyzed
Shortened Scanning Time
Analysis of SUVR for shortened imaging windows of 25 min (45–70 min after injection), 20 min (50–70 min after injection), and 10 min (55–65 min after injection) showed only small differences from the full 30-min acquisition. Ninety percent of the cases were in the range of −0.83% to 0.84%, −1.06% to 1.49%, and −1.80% to 2.42%, respectively (Supplemental Fig. 6). Analysis of shortened scanning time also showed an acceptable TRV (median of 4.3% [90% quantile, 9.6%] at 30 min, 4.0% [90% quantile, 10.0%] at 25 min, 4.3% [90% quantile, 9.9%] at 20 min, and 4.5% [90% quantile, 11.0%] at 10 min).
DISCUSSION
In this study, the biodistribution and radiation dosimetry of 18F-PI-2620 were estimated from human whole-body PET data. The effective dose of 18F-PI-2620 was within the conventional range of 18F tracer radiation burden and allowed longitudinal PET examinations in the same subject. Additionally, 18F-PI-2620 kinetic properties were characterized and the 2TC-vB model was identified as the optimal full kinetic modeling approach to quantify tau load in the human brain. The validity of noninvasive kinetic modeling and semiquantitative methods was confirmed. The excellent reproducibility of 18F-PI-2620 PET measurements between test and retest scans further substantiated the promising initial clinical data and allows for further clinical investigations in larger studies.
Favorable 18F-PI-2620 tracer kinetics with fast washout from nonaffected areas were observed, and there were no signs of brain-penetrating metabolites or defluorination. DVR estimated using noninvasive kinetic models (NI-LGA and MRTM2) showed an excellent correlation to the invasive 2TC-vB model. This finding allows application of a simple acquisition protocol for kinetic modeling without the need for arterial sampling, thus reducing patient burden. Semiquantitative quantification using SUVR was found to be optimal in the 30- to 90-min imaging window, with a strong correlation to full tracer kinetic quantification and low TRV, large effect size, and good visual discrimination between HC and AD subjects. Outside the 30- to 90-min imaging window, quantification accuracy, effect size, and TRV were impaired. These results suggest that SUVR at the 30- to 90-min imaging window can be used for 18F-PI-2620 PET quantification of tau deposits with a simple protocol avoiding arterial blood sampling and dynamic scanning. The performance of different imaging windows between 30 and 90 min after injection was similar, but scans at 45–75 min after injection provided a good compromise between an early acquisition time after tracer injection, quantification accuracy, effect size, TRV, and visual assessment and can be recommended for static acquisitions. Further analysis of a shortened imaging window showed acceptable accuracy for a 20-min imaging window, which would be a good compromise for image accuracy and patient convenience. A relevant limitation of SUVR is that secular equilibrium was not reached during the whole acquisition in some regions. This potential drawback has also been described for other tau radiotracers (12–14). Although the occasional lack of secular equilibrium will not likely hinder visual assessment, it deserves further study, especially in quantitative analysis of tau deposition for longitudinal assessment.
In all quantitative analyses, the cerebellar gray matter was used as the reference region because of the lack of tau accumulation. However, given the nonspecific uptake in the vermis of some subjects, this area and the surrounding cerebellar cortex had to be removed from the reference region. In some papers, the cerebellar cortex was eroded away from other regions to minimize contamination from other regions, especially the inferior temporal and occipital cortices (12,13). This correction was not applied in our study. A preliminary analysis showed that eroded cerebellar cortex did not provide appreciable quantitative changes but increased the TRV, possibly because erosion reduced the volume of the cerebellar cortex. The need to erode or remove the superior layer of the cerebellar cortex may depend on the subjects included in the study; consequently, the optimal reference region for 18F-PI-2620 deserves further analysis in an expanded sample.
CONCLUSION
Kinetic and quantitative analyses demonstrate specific accumulation of 18F-PI-2620 in cerebral regions known to be affected by tau deposition in AD subjects. Whole-body analyses showed that tracer elimination occurred via both the hepatobiliary and the urinary system, and suitable dosimetry was demonstrated. 18F-PI-2620 exhibits excellent kinetic properties and low TRV. DVR measured using the 2TC-vB model with arterial sampling correlated strongly with DVR measured by NI-LGA, MRTM2, and SUVR. SUVR can be used for 18F-PI-2620 PET quantification of tau deposits, avoiding arterial blood sampling and dynamic scanning. Static 18F-PI-2620 PET scan acquisition in AD patients starting at 45 min after injection provides excellent quantification accuracy, large effect size, and low TRV.
DISCLOSURE
Financial support was provided by Life Molecular Imaging. Andre Mueller, Santiago Bullich, Mathias Berndt, Norman Koglin, Caroline Papin, Susan De Santi, Ludger M. Dinkelborg, and Andrew W. Stephens are employed by Life Molecular Imaging, which funded the clinical study. Audrey Perrotin serves as a consultant for Life Molecular Imaging. Olivier Barret, Jennifer Madonia, Cristian Constantinescu, Christine Sandiego, Caroline Papin, Gilles Tamagnan, John P. Seibyl, and Kenneth Marek were employed by Molecular Neuroimaging, LLC (now Invicro), which was contracted by Life Molecular Imaging to conduct the clinical study. Andrea Pfeifer and Heiko Kroth are employed by AC Immune and hold shares of AC Immune. No other potential conflict of interest relevant to this article was reported.
KEY POINTS
QUESTION: Does 18F-PI-2620 show suitable pharmacokinetics, and can noninvasive modeling and SUVR-based quantification be applied to study tau depositions?
PERTINENT FINDINGS: This clinical study demonstrated suitable pharmacokinetics and dosimetry for 18F-PI-2620. SUVR-based quantification and noninvasive modeling provided similar accuracy, with a low TRV as compared with full tracer kinetics.
IMPLICATIONS FOR PATIENT CARE: Simplified imaging protocols and convenient time windows can be used for reliable 18F-PI-2620 PET quantification, avoiding arterial blood sampling and providing confidence for future longitudinal studies.
Acknowledgments
We thank all patients, their caregivers, and the healthy volunteers who participated in this trial. We are also grateful to the chemistry and clinical translational research staff at Invicro (formerly Molecular Neuroimaging) for their excellent technical assistance.
Footnotes
Published online Nov. 11, 2019.
- © 2020 by the Society of Nuclear Medicine and Molecular Imaging.
REFERENCES
- Received for publication September 6, 2019.
- Accepted for publication November 4, 2019.


