


Abstract
18F-PI-2620 is a PET tracer with high binding affinity for aggregated tau, a key pathologic feature of Alzheimer disease (AD) and other neurodegenerative disorders. Preclinically, 18F-PI-2620 binds to both 3-repeat and 4-repeat tau isoforms. The purpose of this first-in-humans study was to evaluate the ability of 18F-PI-2620 to detect tau pathology in AD patients using PET imaging, as well as to assess the safety and tolerability of this new tau PET tracer. Methods: Participants with a clinical diagnosis of probable AD and healthy controls (HCs) underwent dynamic 18F-PI-2620 PET imaging for 180 min. 18F-PI-2620 binding was assessed visually and quantitatively using distribution volume ratios (DVR) estimated from noninvasive tracer kinetics and SUV ratio (SUVR) measured at different time points after injection, with the cerebellar cortex as the reference region. Time–activity curves and SUVR were assessed in AD and HC subjects, as well as DVR and SUVR correlations and effect size (Cohen’s d) over time. Results: 18F-PI-2620 showed peak brain uptake around 5 min after injection and fast washout from nontarget regions. In AD subjects, focal asymmetric uptake was evident in temporal and parietal lobes, precuneus, and posterior cingulate cortex. DVR and SUVR in these regions were significantly higher in AD subjects than in HCs. Very low background signal was observed in HCs. 18F-PI-2620 administration was safe and well tolerated. SUVR time–activity curves in most regions and subjects achieved a secular equilibrium after 40 min after injection. A strong correlation (R2 > 0.93) was found between noninvasive DVR and SUVR for all imaging windows starting at more than 30 min after injection. Similar effect sizes between AD and HC groups were obtained across the different imaging windows. 18F-PI-2620 uptake in neocortical regions significantly correlated with the degree of cognitive impairment. Conclusion: Initial clinical data obtained in AD and HC subjects demonstrated a high image quality and excellent signal-to-noise ratio of 18F-PI-2620 PET for imaging tau deposition in AD subjects. Noninvasive quantification using DVR and SUVR for 30-min imaging windows between 30 and 90 min after injection—for example, 45–75 min—provides robust and significant discrimination between AD and HC subjects. 18F-PI-2620 uptake in expected regions correlates strongly with neurocognitive performance.
Alzheimer disease (AD) is the leading cause of dementia and a global public health priority (1). Histopathologically, AD is characterized by the presence of extracellular β-amyloid plaques and intracellular hyperphosphorylated tau neurofibrillary tangles. Three 18F-labeled amyloid PET tracers (florbetaben, florbetapir, and flutemetamol) underwent histopathology verification in phase 3 studies and can be used clinically for visualization of β-amyloid neuritic plaques in subjects with cognitive impairment (2–4). More recently, several tau PET tracers have entered the clinical development phase (5). Selective tau imaging not only may provide important information on the neurobiology of AD but also may allow examination of tau accumulation over time and its correlation with cognitive function (5). According to the most recent diagnostic criteria (6), the presence of tau deposition in β-amyloid–positive patients together with a clinical evaluation would allow the establishment of a definite diagnosis of AD before death. Measuring and monitoring tau load and its spread will support the development of disease-modifying therapies.
Beyond its investigation in AD, tau deposition is a key pathologic characteristic of several other neurodegenerative diseases, including progressive supranuclear palsy, corticobasal degeneration, Pick disease, chronic traumatic encephalopathy, and argyrophilic grain disease. Tau fibrils consist of 6 different isoforms, with each variant containing a microtubule-binding domain comprising 3-repeat or 4-repeat regions. Different forms are accumulated in different diseases (7). The same protein sequences can also lead to disease-specific folds of tau filaments, as in AD and chronic traumatic encephalopathy, in which all 6 tau isoforms are present (8,9).
Several tau imaging candidates are currently under investigation and were recently reviewed (10). Currently, most clinical experience has been established with AV1451. Tissue-binding analyses with radiolabeled AV1451 demonstrated selective binding to tangles on AD brain tissue but not in other tauopathies (11). A recent AV1451 cross-sectional analysis reported the accuracy for discriminating AD from other neurodegenerative diseases in patients with established diagnoses (12). Further, an AV1451 longitudinal study in AD subjects showed that the amount and location of tau deposition may have implications for both the spread of tau and the cognitive deterioration that occur over an 18-mo period (13).
However, AV1451 and other first-generation tau PET tracers are limited by off-target binding in several brain regions, including basal ganglia and choroid plexus, hampering evaluation of some key cortical regions. There have been descriptions of off-target binding to monoamine oxidase A for AV1451 (14) and to monoamine oxidase B for THK5351 (15). The presence of monoamine oxidases within several brain regions limits the interpretation of PET imaging results with these tau tracers. These shortcomings stimulated the investigation of next-generation tau PET tracers (16). Among these is 18F-PI-2620, whose discovery, preclinical characterization, and binding to both 3-repeat and 4-repeat tau have recently been described (17). The aim of this study was to translate 18F-PI-2620 into humans to obtain clinical proof of concept for PET imaging of cerebral tau pathology and its ability to discriminate AD subjects from healthy controls (HCs).
MATERIALS AND METHODS
Subjects
Subjects with probable AD and HCs who were more than 50 y old were screened for eligibility. The diagnosis of probable AD was based on the NINCDS/ADRDA (18) and DSM-IV criteria (19), a Clinical Dementia Rating (20) score of at least 0.5 at screening, and a Mini-Mental State Examination (MMSE) (21) score of no more than 28. The main inclusion criteria for HCs were no evidence of cognitive impairment as judged by the investigator, according to the neuropsychological battery, which included a Clinical Dementia Rating score of 0, an AD Assessment Scale-Cognitive Subscale (ADAS-Cog), an MMSE assessment, and no family history of AD or neurologic disease associated with dementia. Using an approved β-amyloid PET tracer, a positive β-amyloid PET status (both visual and quantitative analysis) was required for all AD subjects (within 12 mo), whereas all HCs were β-amyloid–negative. β-amyloid PET SUV ratios (SUVRs) and centiloid scores were calculated as described recently (22–24). The study protocol was reviewed and approved by the New England Institutional Review Board, and the study was conducted in accordance with the Declaration of Helsinki. All participants (or their legal representatives) provided written informed consent to participate in the study.
Radiotracer Preparation
18F-PI-2620 was synthesized using a GE Healthcare TRACERlab FX-FN as described previously (17). 18F-PI-2620 was obtained with 16.7% ± 4.8% radiochemical yield (decay-corrected), more than 99.5% ± 1.5% radiochemical purity, and molar activity of 152.2 ± 49.5 GBq μmol−1 at the end of synthesis. Neuraceq (florbetaben 18F injection) was obtained from Sofie.
Image Acquisition
All subjects completed a dynamic 18F-PI-2620 PET scan within 30 d of screening. A transmission scan was obtained for attenuation correction. Subjects were administered a single dose of 18F-PI-2620 (338.7 ± 20.9 MBq; range, 262.7–359.8 MBq) through a venous catheter followed by a 10-mL saline flush. The mean and SD of the administered mass of PI-2620 were 2.09 ± 1.61 μg (range, 0.79–7.70 μg). Immediately after the injection, continuous dynamic brain imaging was performed for up to 180 min over 2 imaging sessions (0–90 min: 6 × 30 s, 4 × 1 min, 4 × 2 min, and 15 × 5 min; 120–180 min: 12 × 5 min) on a Siemens ECAT EXACT HR+ camera. β-amyloid PET images were acquired according to the prescribing information using the same PET scanner. A T1-weighted MRI scan was acquired as part of the screening on a Siemens Espree 1.5-T to identify and delineate brain anatomic regions of interest (ROIs).
Image Reconstruction
PET images were reconstructed in a 128 × 128 matrix (zoom of 2, pixel size of 2.574 × 2.574 mm) with the ordered-subsets expectation maximization algorithm (4 iterations, 16 subsets) and a post hoc gaussian filter of 5 mm. Corrections for random coincidences, scatter, system dead time, and attenuation were performed as provided by the camera manufacturer.
Blood Sampling
Venous blood samples during 18F-PI-2620 PET imaging were collected from 16 subjects (7 HCs and 9 AD subjects) from an antecubital venous catheter before injection and at 5, 10, 30, and 60 min after injection. Samples were counted to measure activity in the total plasma and whole blood and for parent compound and metabolite analysis. Details on metabolite analysis are provided in a companion article (25). A biexponential function was used to describe the parent fraction:  , where p is percentage parent fraction; t is time after injection, in minutes; and α, τ1, τ2, and t0 are the model parameters.
Image Analysis and Quantification
Reconstructed PET images were processed using SPM12 software (http://www.fil.ion.ucl.ac.uk/spm/doc/), including motion correction and coregistration onto the subject’s MR images. The MR images were segmented into gray matter, white matter, and cerebrospinal fluid. Subsequently, the MRI mages were normalized into the standard Montreal Neurological Institute template and the same transformation was applied to the coregistered PET images and gray matter probability maps. ROIs were defined as the intersection between the standard Automated Anatomic Labeling volume-of-interest template (26) and the normalized gray matter segmentation thresholded at a probability level of 0.2. Cortical ROIs were extracted from the Automated Anatomic Labeling template, including amygdala, hippocampus, parahippocampus, fusiform gyrus, inferior lateral temporal cortex, superior lateral temporal cortex, occipital cortex, parietal cortex, posterior cingulate cortex, thalamus, striatum, and cerebellar gray matter. ROIs for pallidum (extracted from the Automated Anatomic Labeling atlas), choroid plexus (posterior part, manually drawn), and subcortical white matter (centrum semiovale, manually drawn) were delineated on the standard Montreal Neurological Institute space and applied to all subjects. Cerebellar gray matter, excluding vermis and anterior lobe surrounding vermis, was used as the reference region. The average activity concentration (kBq/mL) at each time point was determined for each ROI, and time–activity curves were generated.
Time–activity curves were analyzed using the PMOD software package (version 3.7; PMOD Technologies). The distribution volume ratios (DVRs) were estimated using noninvasive Logan graphical plots (t* = 20 min, k2′ = 0.22 min−1) and cerebellar gray matter as the reference region (27). SUVR at different time points was calculated as the ratio of the mean activity concentration in the target ROI to the mean activity concentration in the reference region ROI. SUVR was determined at six 30-min imaging windows (20–50, 30–60, 45–75, 60–90, 120–150, and 150–180 min after injection) by averaging the SUVR at different time points within each imaging window.
Safety and Tolerability
Safety and tolerability were assessed at all study visits and included blood and urine samples for laboratory tests, electrocardiograms, physical and clinical examinations, and assessments for adverse events.
Statistical Analysis
SUVR data were compared between the AD and HC groups in different ROIs using the Mann–Whitney U test. The effect size between AD and HC subjects was assessed by means of Cohen’s d. DVR and SUVR measures were compared by means of linear regression.
RESULTS
Subject Demographics
In total, 10 HC and 12 AD subjects were included in this analysis. Subject demographics and β-amyloid PET status are presented in Table 1. Mean age was 59.2 ± 7.8 y for HCs and 68.5 ± 9.8 y for AD subjects. Mean MMSE scores in the HC and AD groups were 29 (range, 26–30) and 20.5 (range, 8–28), respectively. In HCs, the mean amyloid PET global SUVR was 1.00 ± 0.04 (range, 0.91–1.04) and the mean centiloid score was 2.05 ± 6.65 (range, −16–5). The AD cases had a mean SUVR of 1.66 ± 0.15 (range, 1.47–1.99) and a mean centiloid score of 101 ± 21 (range, 71–150).
Demographics of Subjects
Safety and Tolerability
There were no adverse or clinically detectable pharmacologic effects from 18F-PI-2620 administration in any of the 22 subjects. No clinically significant changes were observed in vital signs, laboratory values, or electrocardiograms.
Visual Assessment
In HCs, no areas of specific 18F-PI-2620 cerebral uptake were identified visually (Fig. 1), and a consistent pattern of initial uptake and washout was observed throughout. In AD subjects, tracer accumulation was identified in cortical regions involving mainly the temporal and parietal lobes, precuneus, and posterior cingulate cortex. Two AD subjects showed low tracer retention (subjects 18 and 19). Before 20 min after injection, increased nondisplaceable uptake (vascular component) was observed, whereas late scans were noisier, with a complete washout of the tracer (150–180 min). Tracer retention was observed in the pineal gland in 1 aged HC (subject 2). 18F-PI-2620 uptake in the cerebellar vermis was observed in 10 subjects (subjects 1, 3, 5, 7–10, 12, 19, and 21). Variable activity was observed in the substantia nigra of most of the HC and AD subjects. No binding higher than the uptake in the reference region was found in the choroid plexus. Extracerebral uptake was common in the retina and in the venous sinus in early scans. Variable uptake was also seen in the skull, which was not consistent with defluorination. One subject showed meningeal uptake. The anterior maxillary sinuses also showed prominent uptake in some cases. No signs of defluorination (i.e., tracer accumulation in bone) were observed. A comparison of amyloid PET and 18F-PI-2620 PET images from a single subject is shown in Figure 2.

18F-PI-2620 SUVR images (45–75 min) for 2 representative HCs (subjects 1 and 2) and all AD patients (subjects 11–22). Images were normalized to cerebellar gray matter and coregistered to subject’s MR images.
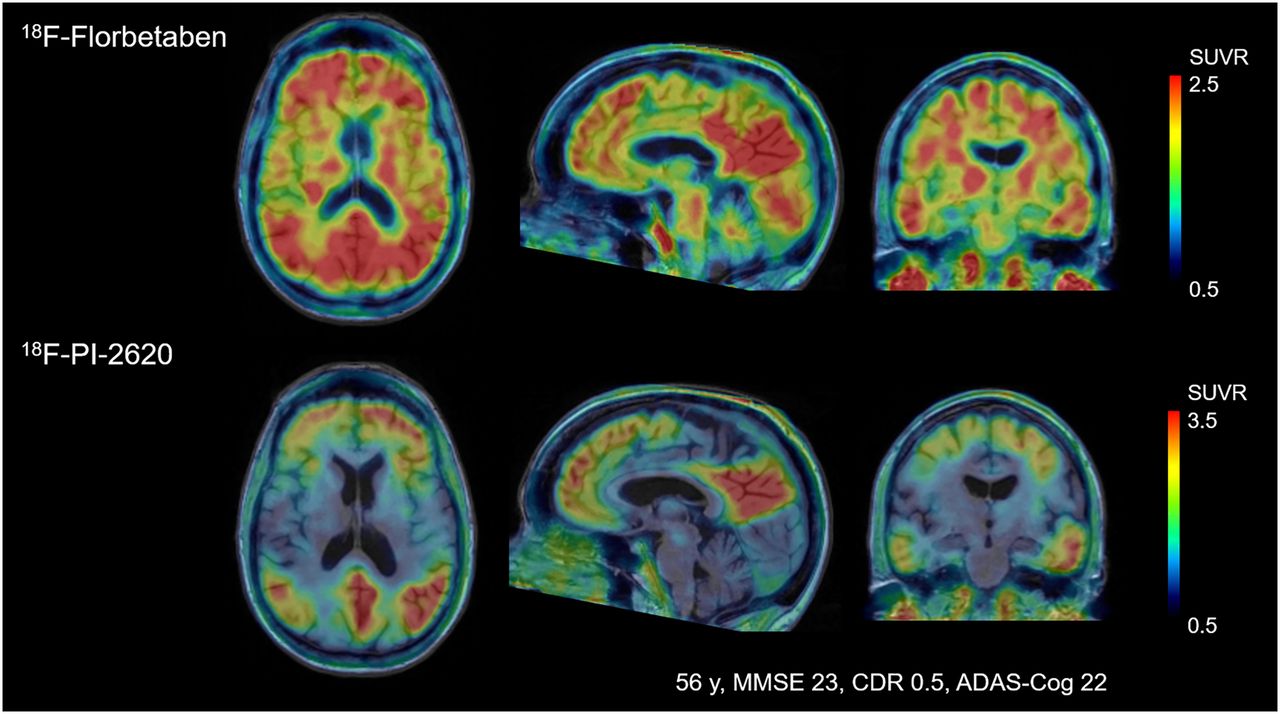
Comparison of florbetaben amyloid PET and 18F-PI-2620 tau PET obtained in same subject. Images were normalized to cerebellar gray matter and coregistered to subject’s MR images. CDR = clinical dementia rating.
Blood Sampling
Venous plasma analysis demonstrated fast clearance of 18F-PI-2620 from the blood. The metabolite pattern for venous blood did not differ from that for arterial blood, as is described in the companion article (25). Unmetabolized parent compound in plasma was reduced to 50.5% ± 12.1% at 10 min after injection, 21.3% ± 8.7% at 30 min after injection, and 14.4% ± 4.9% at 60 min after injection (Supplemental Fig. 1; supplemental materials are available at http://jnm.snmjournals.org).
Time–Activity Curves and SUVR over Time
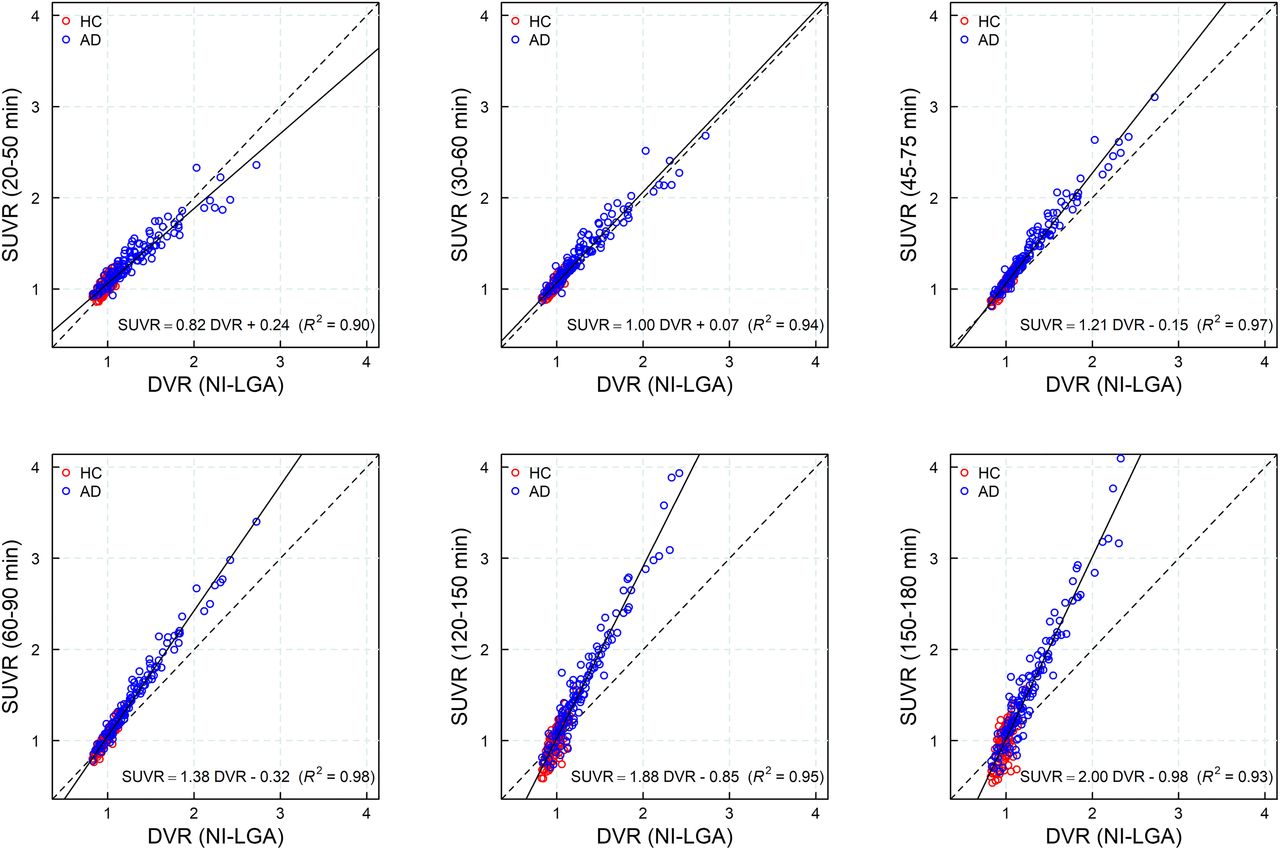
In all subjects, time–activity curves peaked at around 5 min after injection. In HCs, a rapid and uniform washout was observed for the cortex and reference region. In AD subjects, washout was slower than in HCs in those areas where an accumulation of neurofibrillary tangles can be expected. Both HC and AD subjects displayed rapid and similar clearance of the tracer from the reference region and across brain regions devoid of tau. Visual inspection of the SUVR curves revealed that SUVR stabilized at around 40 min after injection for most subjects (n = 18), whereas SUVR continued to increase in some AD subjects (n = 4) until the end of the imaging window at 180 min after injection, without reaching secular equilibrium. Representative time–activity and SUVR curves from 1 HC and 2 AD subjects are shown in Figure 3. A strong correlation was found between the DVR obtained from the noninvasive Logan graphical plot and the SUVR for all imaging windows starting 30 min after injection (R2 > 0.94) (Fig. 4), with increasing slope due to rising SUVR at time points after 60 min after injection.
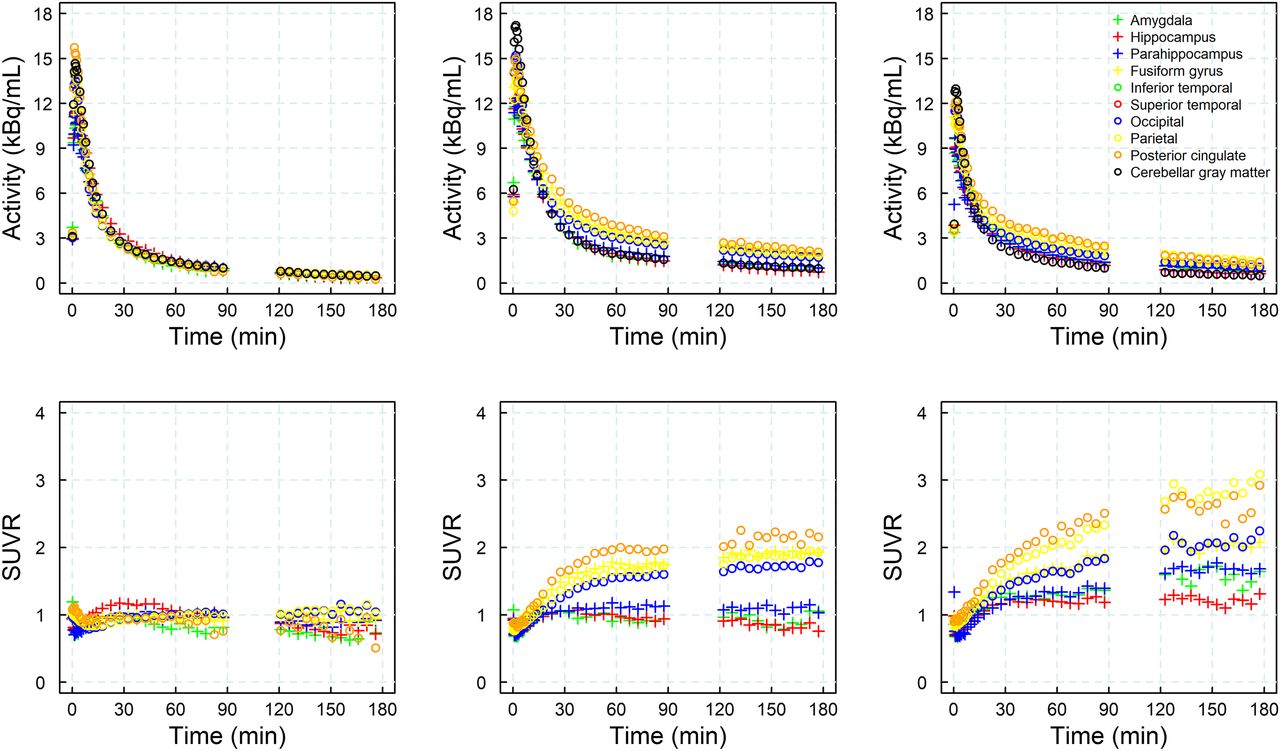
Illustrative time–activity curves (top) and SUVRs (bottom) from selected brain regions in 1 HC (left column, subject 4) and 2 AD subjects (center column, subject 14, and right column, subject 17).

Scatterplot and regression line (solid line) of SUVR at different imaging windows vs. DVR from noninvasive Logan graphical plot (NI-LGA). Dashed line is identity line.
Quantitative Analyses and Effect Size
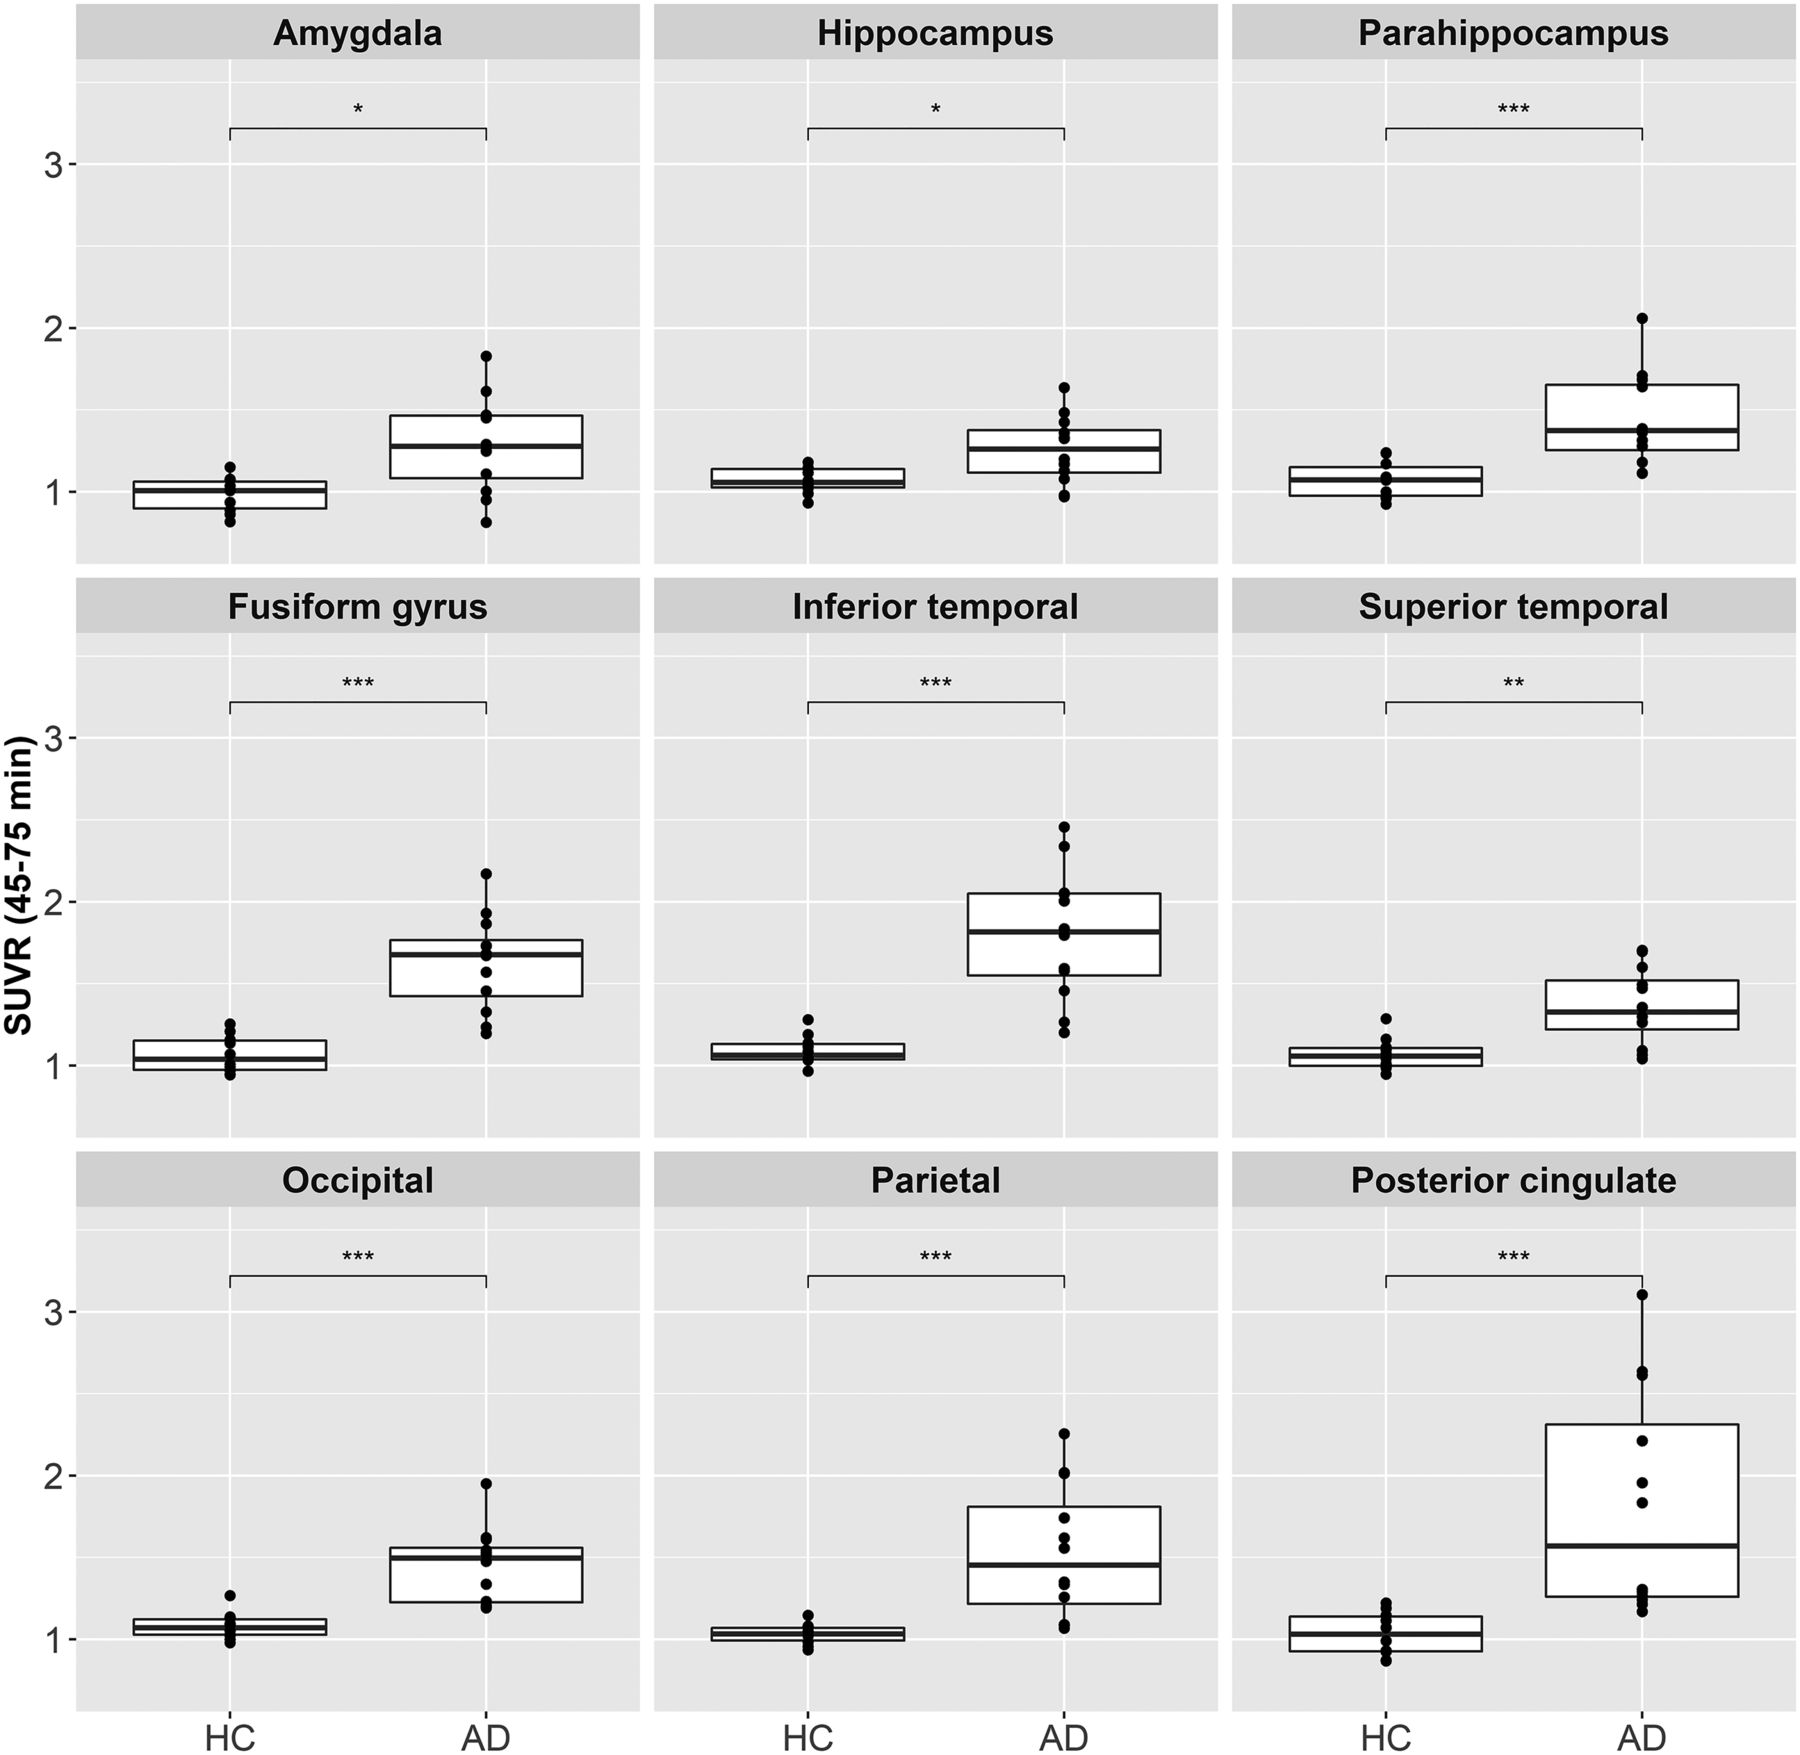
18F-PI-2620 uptake in different cortical regions is shown as SUVR box plots in Figure 5 for all AD and HC subjects. AD subjects showed generally higher SUVRs than HCs, with a variable degree in individual regions. Similar results were obtained from the analyses of the DVR using the noninvasive Logan graphical plot and SUVRs at different imaging windows (Supplemental Table 1). Statistically significant differences between AD and HC subjects were also found using maximum SUVR at different imaging windows (Supplemental Fig. 2). As shown in Table 2, the largest effect sizes to discriminate between AD and HCs using SUVR at 45–75 min after injection were obtained for the fusiform gyrus (Cohen’s d = 2.45), inferior temporal (Cohen’s d = 2.35), and occipital cortices (Cohen’s d = 2.06). DVR and SUVR analyses of subcortical regions did not show statistically significant differences between AD subjects and HCs in most regions and time points. However, increased signal was observed in the pallidum, subcortical white matter, and striatum in SUVR at early time points and only in the pallidum in DVR analysis (Supplemental Table 2).

Box plot of SUVR (45–75 min) at each diagnosis group for different brain regions. *P ≤ 0.05. **P ≤ 0.01. ***P ≤ 0.001.
Effect Size (Cohen’s d) for DVR and SUVR Comparing AD Subjects and HCs
Correlation with Cognition
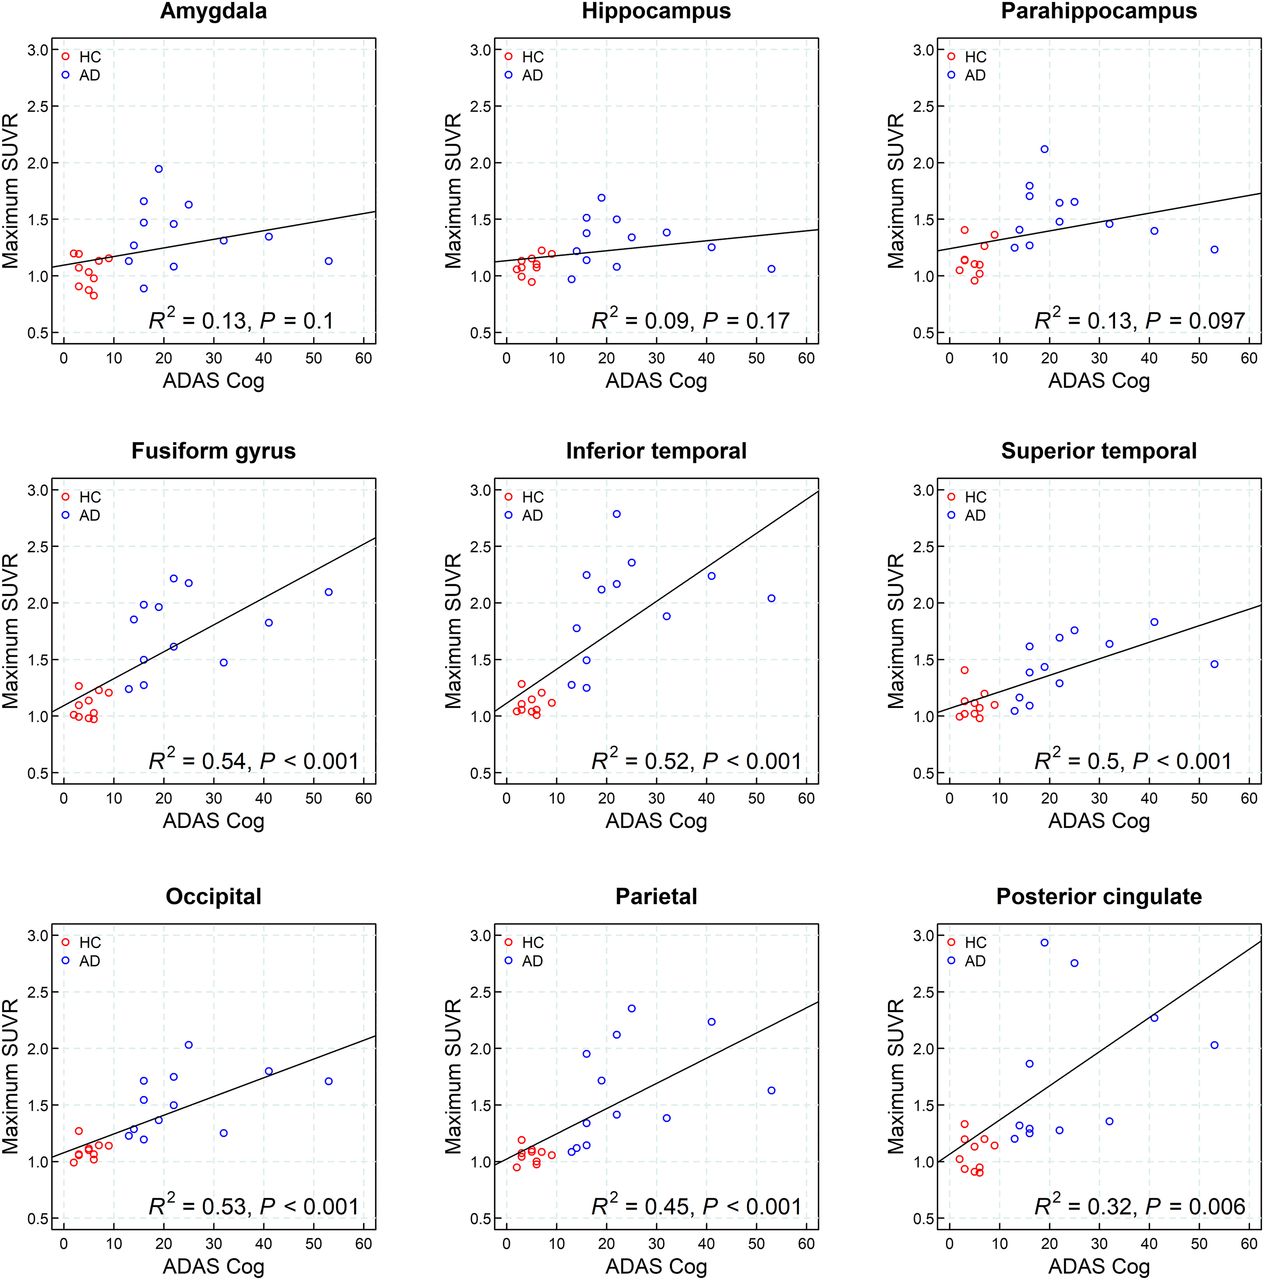
A correlation analysis of 18F-PI-2620 uptake in individual brain regions and ADAS-Cog is shown in Figure 6. A significant correlation of 18F-PI-2620 SUVR at 45–75 min after injection with the ADAS-Cog measurements was observed for the following regions: fusiform gyrus, inferior lateral temporal cortex, superior lateral temporal cortex, occipital cortex, and parietal cortex, with correlation coefficients between 0.45 and 0.54. A significant correlation with MMSE was found in the same regions but with lower correlation coefficients (Supplemental Fig. 3).

Correlation analysis of 18F-PI-2620 uptake at 45–75 min after injection in individual brain regions (maximum SUVR from left or right hemisphere) and ADAS-Cog.
DISCUSSION
The present study showed accumulation of 18F-PI-2620 in regions known to have tau deposition in β-amyloid–positive clinically probable AD subjects. HC subjects showed very low 18F-PI-2620 accumulation, and AD subjects could be clearly distinguished. As such, the 18F-PI-2620 human data obtained in this study are consistent with the tracer characteristics described preclinically in terms of target binding, pharmacokinetics, and off-target binding (17). This is an improvement over the first-generation tau agents, in which off-target binding may confound visual and quantitative assessments and may limit the ability to specifically image tau pathology, such as in the mesial-temporal regions.
The highest uptake of 18F-PI-2620 was observed in the fusiform gyrus, inferior temporal regions, and occipital regions in AD subjects. The spatial distribution observed here parallels neuropathologic data reporting tau spread from the entorhinal cortex through the inferior-lateral temporal and medial parietal areas to the neocortex (28). The intersubject variability in the distribution and density of tracer uptake in AD subjects observed in this study is consistent with previous tau PET imaging studies (12,29–31).
Both HC and AD subjects showed high initial brain uptake and rapid clearance of 18F-PI-2620 from the reference region and across brain regions devoid of tau. The washout was slower in AD subjects than in HCs in areas where an accumulation of neurofibrillary tangles can be expected. 18F-PI-2620 showed the fastest tracer clearance pattern described for tau PET agents to date. Rapid and complete washout from the cerebellar reference regions provides the opportunity for an early and robust SUVR assessment. SUVR curves over time suggest a plateau occurring around 40 min after injection in most of the AD subjects and regions analyzed, with resulting SUVRs of up to 4.0 in abnormal regions, whereas HCs demonstrated low and stable SUVRs, generally around 1.0 in the same regions over time. For some patients, secular equilibrium was not reached over the 180-min acquisition period, resulting in a continued increase in signal as also reported for another tau PET tracer (32). Measurable signal was observed in the basal ganglia of AD subjects by group analysis. This was driven by 3 subjects with increased uptake in the basal ganglia and also significant neocortical tracer uptake (subjects 13, 17, and 20). Two recent autopsy studies have shown tau deposition in the basal ganglia of subjects with advanced AD (Braak V/VI) (33,34). As such, uptake in subcortical regions in advanced AD is not unexpected and should not occur in the absence of significant neocortical uptake.
The kinetics of tracer uptake described in this study indicate that 18F-PI-2620 has a broad imaging window starting as early as 30 min after injection. The strong correlation and linearity observed between SUVR and DVR indicate that SUVR is a good proxy for DVR. PET scans performed within the time frame of 30–90 min provide excellent quantification accuracy with a strong correlation between SUVR and full tracer kinetic quantification, a large effect size, and optimal visual assessment in AD as described in the companion article in more detail (25). For example, scans acquired at 45–75 min after injection provide a good compromise and can be recommended for static acquisitions.
A significant correlation between cognitive measurements (ADAS-Cog and MMSE) and tracer uptake in neocortical ROIs was found. A trend between ADAS-Cog and tracer uptake in mesial-temporal regions was observed. However, given the lower tau accumulation in these regions and the small sample size, the trend did not reach statistical significance. This finding is consistent with the hypothesis that tau accumulation begins in mesial-temporal regions but does not reach high levels in these regions. Rather, after a certain level of accumulation, tau may cross the temporal sulcus into the fusiform gyrus and inferior temporal lobe. Of note, the statistical significance of the correlation between neocortical regions and cognition was lost when the HCs were removed from the analysis, probably as a result of the very small number of remaining subjects. ADAS-Cog and MMSE are global measurements of cognition; episodic memory tests and more detailed neuropsychologic instruments may provide more insight into the correlation between tau load in specific brain regions and specific cognitive functions.
Limitations of this study are the small number of subjects, the mean age difference between subject groups, and the cross-sectional aspect of the study. These limitations need to be addressed in future studies with longitudinal follow-up and larger subject groups.
CONCLUSION
The results from this first-in-humans study showed increased uptake of 18F-PI-2620 in AD subjects compared with HCs. The tracer was safe and well tolerated. Comparing β-amyloid–negative HCs with AD subjects who have amyloid positivity and different levels of cognitive impairment, we observed prominent and significant tracer uptake in regions expected to accumulate abnormal tau aggregates. Notable with 18F-PI-2620 is the very fast brain uptake and clearance from nontarget regions, which allows for imaging windows of around 60 min. SUVR provides a reasonable approximation of DVR, especially before 90 min, and the rapid clearance allows the possibility of full dynamic imaging in a clinically relevant period. Additional studies with larger numbers of subjects and involving other tauopathies are needed to further characterize and validate this tracer.
DISCLOSURE
Financial support was provided by Life Molecular Imaging. Andre Mueller, Santiago Bullich, Mathias Berndt, Norman Koglin, Caroline Papin, Susan De Santi, Ludger M. Dinkelborg, and Andrew W. Stephens are employed by Life Molecular Imaging, which funded the clinical study. Audrey Perrotin serves as a consultant for Life Molecular Imaging. Olivier Barret, Jennifer Madonia, Caroline Papin, Gilles Tamagnan, John P. Seibyl, and Kenneth Marek were employed by Molecular Neuroimaging, LLC (now Invicro), which was contracted by Life Molecular Imaging to conduct the clinical study. Andrea Pfeifer and Heiko Kroth are employed by AC Immune and hold shares of AC Immune. No other potential conflict of interest relevant to this article was reported.
KEY POINTS
QUESTION: Does 18F-PI-2620 show suitable brain uptake and clearance in humans and retention in AD patients?
PERTINENT FINDINGS: Clinical proof of concept was obtained for 18F-PI-2620 for visualizing areas with suspected tau pathology in AD patients, with fast clearance from nonaffected regions, high image quality, and low off-target binding. 18F-PI-2620 uptake correlated strongly with cognitive function.
IMPLICATIONS FOR PATIENT CARE: 18F-PI-2620 may help to better track and understand tau pathophysiology, disease progression and improve diagnosis in neurocognitive impairment.
Acknowledgments
We thank all patients, their caregivers, and the healthy volunteers who participated in this trial. We are also grateful to the chemistry and clinical translational research staff at Invicro (formerly Molecular Neuroimaging LLC) for their excellent technical assistance.
Footnotes
Published online Nov. 11, 2019.
- © 2020 by the Society of Nuclear Medicine and Molecular Imaging.
REFERENCES
- Received for publication September 6, 2019.
- Accepted for publication November 4, 2019.


Jump to section
Related Articles
Cited By...
- In Vivo Head-to-Head Comparison of [18F]GTP1 with [18F]MK-6240 and [18F]PI-2620 in Alzheimer Disease
- Assessment and staging of A/T/N with a single dynamic [18F]PI-2620 recording
- Diagnostic Reference Levels in PET Imaging at Chulabhorn Hospital, Thailand
- Quantitative PET imaging and modeling of molecular blood-brain barrier permeability
- Cortical Tau Aggregation Patterns associated with Apraxia in Alzheimer's Disease
- One-Year Longitudinal Changes in Tau Accumulation on [18F]PI-2620 PET in the Alzheimer Spectrum
- [18F]PI-2620 Binding Patterns in Patients with Suspected Alzheimer Disease and Frontotemporal Lobar Degeneration
- Fibril Paint to detect Amyloids and determine Fibril Length
- PRedicting the EVolution of SubjectIvE Cognitive Decline to Alzheimers Disease With machine learning: the PREVIEW study protocol
- Individual regional associations between A{beta}-, tau- and neurodegeneration (ATN) with microglial activation in patients with primary and secondary tauopathies
- Stacked binding of a small molecule PET tracer to Alzheimers tau paired helical filaments
- Multimodality Imaging in Primary Progressive Aphasia
- An optimized reference tissue method for quantification of tau protein depositions in diverse neurodegenerative disorders by PET with 18F-PM-PBB3 (18F-APN-1607)
- TauIQ: A Canonical Image Based Algorithm to Quantify Tau PET Scans
- In vivo visualization of propagating {alpha}-synuclein pathologies in mouse and marmoset models by a bimodal imaging probe, C05-05
- Correlation of Alzheimer Disease Neuropathologic Staging with Amyloid and Tau Scintigraphic Imaging Biomarkers
- Evaluation of Dosimetry, Quantitative Methods, and Test-Retest Variability of 18F-PI-2620 PET for the Assessment of Tau Deposits in the Human Brain