


Visual Abstract

Abstract
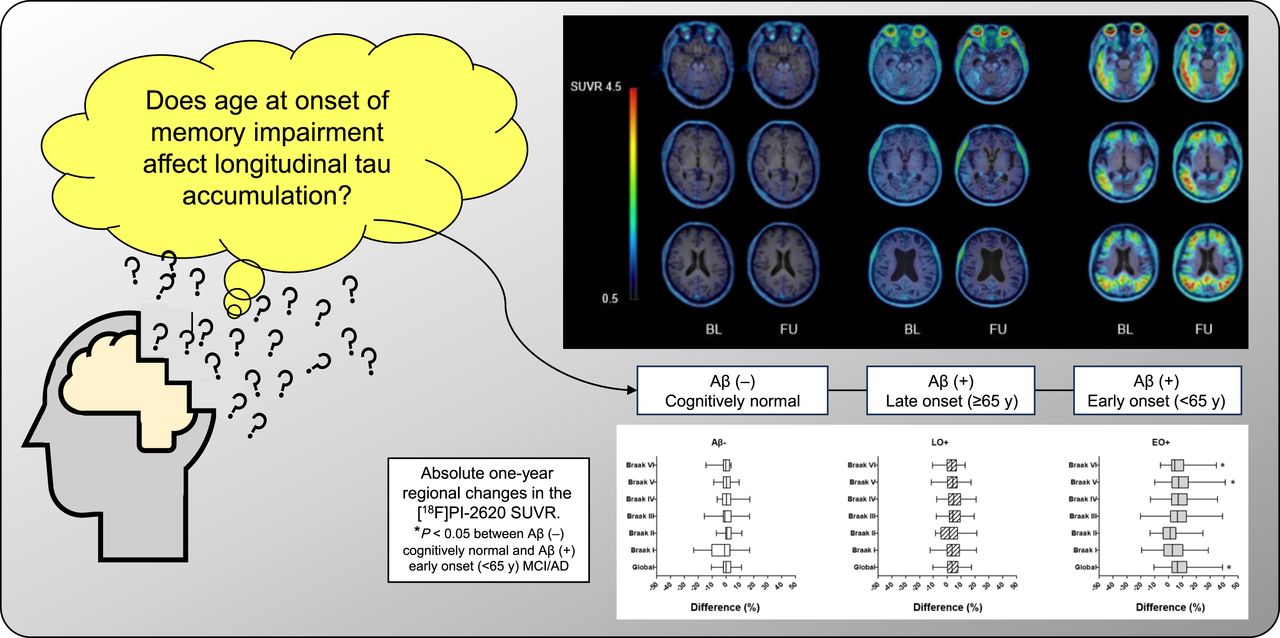
We investigated the longitudinal changes in cortical tau accumulation and their association with cognitive decline in patients in the Alzheimer disease (AD) continuum using 2-(2-([18F]fluoro)pyridin-4-yl)-9H-pyrrolo[2,3-b:4,5c′]dipyridine ([18F]PI-2620) PET. Methods: We prospectively enrolled 52 participants (age, 69.7 ± 8.4 y; 18 men and 34 women): 7 with normal cognition, 28 with mild cognitive impairment, and 17 with AD. They all completed the [18F]PI-2620 and [18F]florbetaben PET, MRI, and neuropsychologic tests at baseline and, excepting the [18F]florbetaben PET, at the 1-y follow-up. Amyloid-β (Aβ) PET images were visually scored as positive (+) or negative (−). Patients on the AD continuum, including Aβ+ mild cognitive impairment and AD, were classified into early-onset (EO+) (<65 y old) or late-onset (LO+) (≥65 y old) groups. [18F]PI-2620 PET SUV ratios (SUVRs) were determined by calculating the cerebral–to–inferior cerebellar ratio. Cortical volumes were calculated using 3-dimensional T1-weighted MRI. The correlation between tau accumulation progression and cognitive decline was also investigated. Results: The global [18F]PI-2620 PET SUVRs were 1.04 ± 0.07 in 15 Aβ− patients, 1.18 ± 0.21 in 20 LO+ patients (age, 76.7 ± 3.8 y), and 1.54 ± 0.38 in 17 EO+ patients (age, 63.4 ± 5.4 y; P < 0.001) at baseline. The global SUVR increased over 1 y by 0.05 ± 0.07 (3.90%) and 0.13 ± 0.22 (8.41%) in the LO+ and EO+ groups, respectively, whereas in the Aβ− groups, it remained unchanged. The EO+ group showed higher global and regional tau deposition than did the Aβ− and LO+ groups (P < 0.05 for each) and rapid accumulation in Braak stage V (0.15 ± 0.25; 9.10% ± 12.27%; P = 0.016 and 0.008), Braak stage VI (0.08 ± 0.12; 7.16% ± 10.06%; P < 0.006 and 0.005), and global SUVR (P = 0.013) compared with the Aβ− group. In the EO+ group, the changes in SUVR in Braak stages II–VI were strongly correlated with the baseline and changes in verbal memory (P < 0.03). The LO+ group showed higher tau accumulation in Braak stage I–IV areas than did the Aβ− group (P < 0.001 for each). In the LO+ group, the change in SUVR in Braak stages III and IV moderately correlated with the change in attention (P < 0.05), and the change in SUVR in Braak stages V and VI moderately correlated with the change in visuospatial function (P < 0.005). Conclusion: These findings suggest that [18F]PI-2620 PET can be a biomarker to provide regional and chronologic information about tau pathology in the AD continuum.
Dementia is a heterogeneous group of progressive and degenerative brain pathologies clinically characterized by deterioration in memory, learning, orientation, language, comprehension, and judgment. Alzheimer disease (AD) is the most common cause of dementia (1). Age is the most prominent biologic risk factor. Patients with AD are often classified into early-onset AD (EOAD) and late-onset AD (LOAD) groups, with 65 y as the cutoff age (2). EOAD occurs in approximately 10% of the patients with AD, with the first symptoms appearing in the age range of 30–65 y (3).
The neuropathologic hallmarks of AD brains include extracellular accumulation of diffuse and neuritic amyloid-β (Aβ) plaques, frequently surrounded by dystrophic neurites, and intraneuronal accumulation of hyperphosphorylated tau protein neurofibrillary tangles (4). Although some studies report widespread pathology extending outside the medial temporal lobe in younger patients (5), the overall pathology of EOAD and LOAD patients is similar, making it difficult to distinguish between the two.
The tau radiotracers for PET imaging developed in the past decade enable in vivo visualization and quantification of pathologic tau protein in AD. Cross-sectional tau PET imaging revealed tracer accumulation patterns similar to those reported in postmortem studies (6). Patients with EOAD typically show an extensive tau pathology distribution and burden when presenting with Aβ-positive (+) PET, whereas patients with LOAD yield a distinct tau retention pattern, predominantly confined to the temporal lobe (7). These preliminary findings indicated that the onset age might be an important contributor to AD heterogeneity, highlighting the potential that tau PET has in capturing phenotypic variations across patients with AD.
Longitudinally, patients with EOAD showed a faster cognitive decline than those with LOAD and faster widespread thinning of association cortices (8), took longer for an AD diagnosis to be reached, and had a higher frequency of 2 apolipoprotein ε4 alleles. However, both groups showed similar cognitive and global responses to cholinesterase inhibitor treatment and longitudinal outcomes, including activities-of-daily-living capacities and time from diagnosis to nursing home placement (9). However, studies on how longitudinal tau accumulation influences these changes are lacking.
Cross-sectionally, 2-(2-([18F]fluoro)pyridin-4-yl)-9H-pyrrolo[2,3-b:4,5-c′]dipyridine ([18F]PI-2620), a second-generation tau PET tracer, demonstrated a high tau aggregate image quality and excellent signal-to-noise ratio in patients with AD (7,10). This tracer has the pyrrolo[2,3-b:4,5-c′]dipyridine core that strongly binds to aggregated tau and significantly reduces monoamine oxidase A binding properties compared with pyrido[4,3-b]indole derivatives. Its negative log of half-maximal inhibitory concentration was 8.5 ± 0.1 in the competition assay to tau aggregates, but it showed low binding properties to Aβ, monoamine oxidase A, and monoamine oxidase B as off-target binding tests. An autoradiography study showed specific binding to pathologic misfolded tau on AD brain sections but no specific tracer binding in the brain slices from nondemented donors (11). The tracer demonstrated no nonspecific binding in the basal ganglia and showed no uptake in non–tau-driven neurodegenerative disorders, including semantic variant primary progressive aphasia (12). [18F]PI-2620 accumulation in the globus pallidus internus can detect progressive supranuclear palsy in patients (13,14). [18F]PI-2620 showed higher distribution volume ratios in patients with Aβ+ corticobasal syndrome than in the controls in several cortical target regions and could serve as a differential diagnosis tool (15).
This study tracked longitudinal tau accumulation in patients with EOAD and LOAD using [18F]PI-2620 PET to better understand the dynamic interactions between tau accumulation and Aβ, neurodegeneration, and cognitive decline over time.
MATERIALS AND METHODS
Eligibility and Overall Study Design
We prospectively enrolled cognitively normal controls (NCs) and patients with mild cognitive impairment (MCI) or AD. NCs were 40–85 y old with no evidence of cognitive impairment by history and the Seoul Neuropsychological Screening Battery (SNSB), which is one of the standardized neuropsychologic test batteries widely used in Korea and assesses 5 cognitive domains: attention, memory, language, visuospatial function, and frontal/executive function (16), with a Mini-Mental State Examination (MMSE) score within 1 SD of the sex-, age-, and education-specific norm and a score of 0 on the clinical dementia rating (CDR). Patients with MCI met the criteria of Petersen et al. (17). Patients with AD were more than 40 y old and met the probable AD criteria following the National Institute on Aging–Alzheimer’s Association guidelines (18). Subjects with structural lesions such as territorial infarctions, intracranial hemorrhage, psychologic disease, non-AD tauopathy, Parkinson disease, or cerebrovascular disease were excluded. Subjects with at least 2 immediate family members diagnosed with AD were also excluded. Subjects treated before the screening visit with any investigational medicinal product, including tau-targeted treatment, were excluded.
The subjects underwent [18F]PI-2620 PET to evaluate tau accumulation, [18F]florbetaben PET to establish Aβ status (Aβ+ or Aβ negative [−]), MRI, neuropsychiatric testing, and safety evaluations at baseline. All tests were repeated after 1 y except [18F]florbetaben PET. We collectively classified Aβ+ MCI and Aβ+ AD into late-onset (LO) and early-onset (EO) groups with the cutoff at the age of 65 y (19–21).
This study was approved by the Institutional Review Board of Asan Medical Center before it began, and all subjects signed an informed consent form. The study was registered at http://www.clinicaltrials.gov (NCT 03903211).
Radiopharmaceutical Synthesis of [18F]PI-2620
[18F]PI-2620 synthesis was described before (12); briefly, it was synthesized using a modified Trasis AllinOne automatic chemistry module according to published methods (11) with minor modifications (22). The overall radiochemical non–decay-corrected yield was 8.0% ± 5.2% (n = 39), and the total preparation time was 75 ± 5.0 min, including high-performance liquid chromatography purification and formulation. The radiochemical purity and molar activity were 99.9% ± 0.2% and 91.8 ± 45.7 GBq/μmol, respectively.
PET Imaging
We acquired brain PET scans for all participants using a Discovery 690, 710, or 690 Elite PET/CT scanner (GE Healthcare). The same scanner was used at baseline and after 1 y for [18F]PI-2620 PET imaging. Scans were performed 60–90 min after intravenous injection of 259 ± 25.9 MBq of [18F]PI-2620 for tau detection and 90–110 min after intravenous injection of 300 ± 30 MBq of [18F]florbetaben for Aβ detection. The 3-dimensional PET images were reconstructed with a voxel size of 2.0 × 2.0 × 3.27 mm using the ordered-subsets expectation maximization algorithm (iterations, 4; subsets, 16; postreconstruction smoothing applied using a gaussian kernel of 4 mm in full width at half maximum).
Quantitative Analysis for PET
[18F]florbetaben PET scans were assessed visually by 2 nuclear medicine physicians (who were masked to the clinical information) using a binary classification (+ or −) as recommended (23).
For [18F]PI-2620 PET, each participant’s PET image was rigidly coregistered to that participant’s magnetization-prepared rapid gradient-echo data using Statistical Parametric Mapping software, version SPM12 (Wellcome Trust Centre for Neuroimaging, University College London), in MATLAB R2013a (MathWorks). Cortical gray matter/white matter parcellation was performed using FreeSurfer, version 6.0 (Harvard University; http://surfer.nmr.mgh.harvard.edu), as described by Thomas et al. (24). The Desikan–Killiany–Tourville atlas was used to define the regions of interest for the PET Braaklike stages (25) and to perform high-resolution gyral parcellation using FreeSurfer (26). The global SUV ratio (SUVR) was calculated by combining all of the volumes of interest of Braak stages I–VI. The ratio of region-based voxelwise (24) partial-volume effect (PVE) to 7-mm smoothed PET (27) coregistered onto MR images was used for quantification and voxel-based PVE correction of the PET images. PVE correction was performed using the symmetric geometric transfer matrix approach (28) in PETsurfer, a submodule of FreeSurfer (29,30). The region-based voxelwise PVE correction method, which requires high-resolution anatomic segmentation and accurate point-spread function measurements, combines the advantages of the geometric transfer matrix method and voxelwise corrections to generate accurate PVE-corrected images.
The mean SUVR of [18F]PI-2620 PET was calculated for each volume of interest and normalized to the inferior cerebellum (cerebellar crus b–X) as a reference. To better measure the mean uptake in the reference, we conducted spatial normalization of the coregistered [18F]PI-2620 PET images as mentioned above (coregistered onto T1-weighted MR images) to the Montreal Neurological Institute space, which is achieved using the spatial normalization parameters that align the corresponding MR image with the Montreal Neurological Institute T1-weighted MRI template and FreeSurfer-based cerebellum gray matter mask, combined with a spatially unbiased atlas template of the cerebellum (SUIT; MATLAB), to generate an individual FreeSurfer mask-based gray matter–specific inferior cerebellum mask (using the SUIT mask), as defined on the template space of Baker et al. (31). Finally, we applied morphologic erosion to this cerebellum gray matter mask to better handle the potential tissue misclassification in volumetric MRI as well as misalignment (or misregistration) between PET and volumetric MR images.
Acquisition and Analysis of MRI
MRI was performed with a 3.0-T system (Achieva; Philips). To evaluate the cortical volume, a high-resolution anatomic 3-dimensional volume image was obtained using a 3-dimensional gradient-echo T1-weighted sequence with the following parameters: repetition time, 9.9 ms; echo time, 4.6 ms; flip angle, 8°; field of view, 224 mm; matrix, 224 × 224; and slice thickness, 1 mm with no gaps. Images were analyzed using FreeSurfer software, and MRI parcellation was performed as described above.
Statistical Analysis
SPSS Statistics version 21.0 (IBM) and SAS version 9.4 (SAS Institute Inc.) were used for statistical analysis of the demographic data. The ×2 test and a correction for multiple comparisons with the Bonferroni method were used to compare categoric variables. For the comparisons of continuous demographic data and SNSB, we used an ANOVA model with a Bonferroni post hoc test. The performance on SNSB was compared between groups using a linear mixed model with sex as a covariate and the Bonferroni method for correcting multiple comparisons. We primarily analyzed longitudinal changes in SNSB and the global and regional (Braak stages I–VI) SUVRs with linear mixed-effect models with sex and the time interval between baseline and follow-up as fixed factors and subject as a random factor under the assumption that the intercepts can differ between subjects. A generalized linear mixed-effect repeated-measures analysis was performed with 1 fixed factor, a Braak stage region, and a random subject effect to account for within-subject correlations. The response variable was the annual percentage of change in SUVR. We present bar plots with the mean percentage of change in the SUVR across Braak stages and indicate the statistical significance derived from the paired difference tests from the repeated-measures model. The annual change in [18F]PI-2620 SUVR was calculated as the difference between the values at follow-up and baseline, and the annual percentage of the change was calculated as [SUVR follow-up − SUVR baseline]/SUVR baseline × 100. Multiple linear regression analysis was performed for the Aβ+ group versus the Aβ− group and age for the difference in the SUVR. Partial correlation analyses between CDR–sum of boxes, MMSE, cognitive function of attention, memory, language, visuospatial function, and frontal/executive function and the SUVR of [18F]florbetaben and [18F]PI-2620 and the cortical volume were performed with sex as a covariate.
P values of less than 0.05 were considered statistically significant.
RESULTS
Participants
Sixty-nine participants underwent baseline [18F]PI-2620 PET scans (11 NC, 33 with MCI, and 25 with AD), of which 46 were Aβ+ (1 NC, 23 with MCI, and 22 with AD). Fifty-five participants completed both baseline and 1-y follow-up [18F]PI-2620 PET scans. One patient was excluded because the MRI was of insufficient quality to be analyzed by FreeSurfer. Of the remaining 54 participants (age, 69.7 ± 8.4 y; 15 men and 39 women), 52 were categorized as Aβ− (15; 7 NC and 8 MCI), LO+ (20; 9 MCI and 11 AD), or EO+ (17; 11 MCI and 6 AD) for analysis. One Aβ+ NC and 1 Aβ− AD patient were excluded. The participants’ demographic, clinical, and imaging characteristics are summarized in Table 1.
Clinical and Cognitive Assessments
SNSB
As shown in Table 2, both the LO+ and EO+ participants showed a significant deterioration in global cognitive function as determined by CDR, CDR–sum of boxes, and MMSE and deterioration in language (K-Boston Naming Test), visuospatial function (Rey Complex Figure Test copy), verbal (Seoul Verbal Learning Test–Delayed Recall) and visual (Rey Complex Figure Test–Delayed Recall) memory, and frontal/executive function (Controlled Oral Word Association Test: supermarket) compared with Aβ− participants (P < 0.001 vs. P = 0.040).
Baseline Demographics and Clinical Characteristics
Compared with LO+, EO+ showed worse performance on language (P = 0.046). Both LO+ and EO+ participants were stable on visual memory at the follow-up, whereas the Aβ− participants showed improvement (P = 0.028 and 0.009, respectively).
Baseline [18F]florbetaben Uptake in Aβ−, LO+, and EO+
The global [18F]florbetaben SUVRs in the Aβ−, LO+, and EO+ groups were 1.23 ± 0.11, 1.72 ± 0.22, and 1.77 ± 0.20, respectively. LO+ and EO+ groups showed similar global Aβ deposition, but the deposition was higher than that of the Aβ− group (P < 0.001). A moderate correlation between the SUVR of the baseline Aβ ([18F]florbetaben) and that of tau ([18F]PI-2620) is present in the Aβ− group (r = 0.581; P = 0.04) but not in the LO+ and EO+ groups, as presented in Supplemental Table 1a (supplemental materials are available at http://jnm.snmjournals.org).
Baseline and Longitudinal Changes in [18F]PI-2620 Uptake
Some examples of baseline and follow-up [18F]PI-2620 PET images are shown in Figure 1. Baseline and 1-y follow-up [18F]PI-2620 SUVRs of the Aβ−, LO+, and EO+ groups are shown in Table 3 (the data were not corrected for a PVE [non-PVE]). Data corrected for PVE are presented in Supplemental Table 2.

Representative [18F]PI-2620 PET images of Aβ−, LO+, and EO+ at baseline (BL) and at 1-y follow-up (FU). SB = sum of boxes; SVLT-DR = Seoul Verbal Learning Test–Delayed Recall.
SUVRs of [18F]PI-2620 in Aβ−, LO+, and EO+ Groups
The baseline global [18F]PI-2620 SUVRs in the Aβ−, LO+, and EO+ groups were 1.04 ± 0.07, 1.18 ± 0.21, and 1.54 ± 0.38, respectively (P < 0.001). The LO+ group showed higher tau accumulation in Braak stage I–IV areas than did the Aβ− group (P < 0.001 for each). The EO+ group showed higher tau accumulation in the Braak stage I–VI areas than did the Aβ− group (P < 0.001 for each).
During the 1-y follow-up, the global cortical SUVRs of the LO+ and EO+ groups increased by 0.05 ± 0.07 (3.90% ± 6.30%) and 0.13 ± 0.22 (8.41% ± 11.89%), respectively. The EO+ group showed a statistically significant increase during follow-up in Braak stage V (0.15 ± 0.25; 9.10% ± 12.27%; P = 0.01), Braak stage VI (0.08 ± 0.12; 7.16% ± 10.06%; P < 0.001), and global SUVR (P = 0.01) compared with the Aβ− group. The annual SUVR changes by Braak staging are shown in Figure 2 for non-PVE and in Supplemental Figure 1 for PVE. Absolute and relative 1-y regional changes in the [18F]PI-2620 SUVR are shown in Figure 3 for non-PVE.

One-year changes in [18F]PI-2620 SUVR by Braak staging region (data were not corrected for PVE). Aβ− is NC and MCI; LO−, Aβ+ is LO MCI and AD (≥65 y); EO+, Aβ+ is EO MCI and AD (<65 y). B = baseline; F = follow-up.

Absolute (A) and relative (B) 1-y regional changes in [18F]PI-2620 SUVR. *P < 0.05 between Aβ− and EO+. FU = follow-up; BL = baseline.
Longitudinal change in the [18F]PI-2620 SUVR in the cerebellum and off-target binding on the putamen and pallidum are shown in Supplemental Table 3. There were no significant differences in [18F]PI-2620 in the cerebellum (P = 0.265). The pallidum showed an increased uptake in the LO+ group compared with the EO+ group (1.22 ± 0.19 vs. 1.11 ± 0.12; P = 0.003) but with no significant longitudinal change.
[18F]PI-2620 Uptake, Age, Cognition, and Atrophy
Multiple linear regression analysis showed that the changes in [18F]PI-2620 SUVR were significantly associated with Aβ+ and age globally (unstandardized coefficients, 0.092 for Aβ+ and −0.005 for age; P = 0.029 and 0.017, respectively) and in Braak stages IV–VI (Fig. 4).

Individual trajectories of age and SUVR change. Multiple linear regression analysis of Aβ+ group vs. Aβ− group and age shows change in [18F]PI-2620 SUVRs. B = unstandardized coefficients.
In the Aβ− group, the baseline [18F]PI-2620 SUVR of Braak stages III and IV correlated with visuospatial function (r = 0.616 and 0.682; P < 0.05 for each). The baseline SUVR of Braak stage VI correlated with the change in MMSE, language, and visual memory (r = 0.663, 0.645, and 0.687; P < 0.05 for each). The changes in SUVR in Braak stages I–VI and the global SUVR correlated with baseline attention, visuospatial function, and the changes in attention and frontal/executive function, as shown in Supplemental Table 1a. The baseline hippocampal volume (Braak stage II) correlated with the baseline CDR–sum of boxes (r = −0.594; P < 0.05). The baseline cortical volume of Braak stages IV–VI and the global cortical volume strongly correlated with the baseline verbal and visual memory (P < 0.05). The progression of hippocampal atrophy (Braak stage II) moderately to strongly correlated with the change in MMSE, language, and visual memory (P < 0.05).
In the LO+ group, the baseline SUVR of Braak stages IV–VI moderately correlated with the difference in MMSE (P < 0.05) as shown in Supplemental Table 1b. The change in SUVR of Braak stages III and IV moderately correlated with the change in attention (P < 0.05). The change in SUVR of Braak stages V and VI moderately correlated with the change in visuospatial function (P < 0.05). The baseline hippocampal volume moderately correlated with the baseline SUVR of Braak stages III and V (P < 0.05).
In the EO+ group, the baseline SUVR of Braak stage VI and the global SUVR moderately to strongly correlated with the baseline visuospatial and frontal/executive functions (P < 0.05) as shown in Supplemental Table 1c. The change in SUVR of Braak stages V and VI strongly correlated with the baseline and change in verbal memory (P < 0.005). The baseline cortical volume of Braak stage I moderately to strongly correlated with the baseline SUVR of Braak stages III and V and the global SUVR (P < 0.05). The differences in the cortical volume of Braak stages V and VI and the global cortical volume strongly correlated with the baseline frontal/executive function and the baseline SUVR of Braak stage IV.
DISCUSSION
This study used [18F]PI-2620 PET to identify a tau deposition pattern and longitudinal accumulation, which differed between the LO+ and EO+ groups. This study identified tau accumulation by [18F]PI-2620 PET, with the EO+ group showing rapid accumulation globally and in Braak stage V and VI areas, correlating with the patients’ verbal memory deterioration. At the 1-y follow-up, global SUVRs of the LO+ and EO+ groups increased by 0.05 ± 0.07 (3.90% ± 6.30%) and 0.13 ± 0.22 (8.41% ± 11.89%), respectively. These results are comparable with previous longitudinal tau accumulation studies in patients with AD (32,33).
Previously reported uncorrected 18F-flortaucipir ([18F]AV-1451) PET values for annual global tau accumulation changes ranged between 0.02 (0.8%) in Aβ+ MCI patients and 0.04 (2.5%) in Aβ+ AD patients (32). The non-PVE 6-(fluoro-18F)-3-(1H-pyrrolo[2,3-c]pyridin-1-yl)isoquinolin-5-amine ([18F]MK-6240) PET values increased at the 1-y follow-up by 0.05 in Aβ+ MCI patients and 0.12 in Aβ+ AD patients (33).
[18F]AV-1451 and [18F]MK-6240 PET detected a more widespread tau accumulation in the parietooccipital cortex and hippocampus of patients with Aβ+ EOAD than with Aβ+ LOAD, compatible with results of this study (19,34,35). We showed a more rapid tau accumulation in the Braak stage III–V areas in the EO+ group than in the LO+ group. Although longitudinal changes in tau accumulation in this group were not yet established for autosomal dominant AD, it was reported that tau accumulation rates among carriers were most rapid in the parietal neocortex (∼9%/y), as seen by [18F]AV-1451 PET in the COLBOS biomarker study (36). These results support the different contributions of tau and amyloid to the onset and progression of EOAD and LOAD. LOAD is believed to affect complex, heterogeneous groups and to be caused by multiple genetic and environmental factors through diverse pathways (37–39).
The higher proportion of hypertension, diabetes mellitus, and hyperlipidemia in the LO+ group than in the EO+ group in this study partly explains the LOAD diverse pathologic processes other than Aβ. The LO+ and EO+ groups had similar global or regional Aβ SUVRs. However, the groups differed in their baseline global and regional (Braak stage I–VI areas) tau. These results suggested that tau might be a better biomarker than Aβ to explain the pathophysiology and progression in the EO+ group. Unlike EOAD and LOAD, studies with [18F]AV-1451 showed no difference in cortical tau binding between EO and LO MCI (19). It is currently unknown whether these differences are due to the small samples studied or differences between the tau tracers used.
On the basis of this fact, we hypothesized that the interaction between amyloid and tau would differ between EO MCI and EOAD because EO MCI precedes EOAD and progresses to it. Tábuas-Pereira et al. reported that the clinical presentation, apolipoprotein E subtype, and cerebrospinal fluid biomarkers of EO and LO MCI were biologically indistinguishable (21). Furthermore, they found no difference in their conversion rates to AD. However, the patients’ amyloid status was not evaluated, and that study was conducted before tau PET became available, so its interpretation was limited. The CREDOS study revealed that the visuospatial memory scores of EO MCI and verbal memory scores of LO MCI were significant predictors of AD conversion, suggesting a right-predominant pathology in EO MCI and a left-predominant pathology in LO MCI (20). Studies with PET biomarkers showed differences between these 2 groups, with EO MCI showing hypometabolism in brain regions vulnerable to mild AD (40). Therefore, we divided the Aβ+ participants into LO+ and EO+ groups on the basis of the age of memory impairment onset.
The changes in [18F]PI-2620 SUVR were significantly associated with Aβ+ and age on multiple linear regression analysis. This association suggested that not only Aβ presence but also age is associated with longitudinal tau accumulation, especially in advanced Braak stages, although the small number of subjects in the Aβ−, LO+, and EO+ groups prevented us from confirming this possibility.
As in previous work, [18F]PI-2620 maintained a high-quality PET image and an excellent signal-to-noise ratio when imaging tau deposition in AD (7,10). In this study, [18F]PI-2620 SUVR indicated longitudinal tau accumulation in Braaklike regions in the LO+ and EO+ groups without significant off-target binding in the basal ganglia, cerebellum, choroid plexus, or meninges. As shown in Supplemental Table 3, uptake in the putamen, pallidum, and cerebellum was low, with no significant longitudinal accumulation. This could be an advantage over [18F]MK-6240, which is limited in longitudinal assessments because of the highly variable signal in the meninges at the subject level, and [18F]AV-1451, which has difficulties in quantifying hippocampal uptake due to choroid plexus uptake (32,41).
This study had several limitations. First, the classification criteria for EO+ and LO+ groups were not well established. The age-at-onset criterion to classify EOAD and LOAD is well known, but using it to define EO and LO MCI has not yet been well established. Second, the follow-up might have been too short to detect significant changes in cognitive function, cortical volume, and conversion to AD in patients with MCI. However, at the same time, it is also advantageous to be able to show differences between groups with only a short follow-up of 1 y. Third, conducting the study during the coronavirus disease 2019 pandemic caused patients to drop out and made follow-up visits challenging. Last, tau distribution and accumulation changes were not confirmed pathologically.
CONCLUSION
This study identified tau accumulation by [18F]PI-2620 PET, with the EO+ patients showing rapid accumulation globally and in Braak stage V and VI areas, correlating with their verbal memory deterioration. The LO+ patients showed tau deposition within Braak stage IV and relatively slow progression, which correlated with their attention and visuospatial functions. These findings suggest that [18F]PI-2620 could be a potential biomarker for selecting tau-targeted therapies and monitoring their effects.
KEY POINTS
QUESTION: Does age at onset affect tau accumulation?
PERTINENT FINDINGS: Compared with the Aβ− group, the EO MCI and AD groups showed rapid accumulation globally and in Braak stage V and VI areas on [18F]PI-2620 PET.
IMPLICATIONS FOR PATIENT CARE: These findings suggest that [18F]PI-2620 could be a potential biomarker for selecting tau-targeted therapies and monitoring their effects.
DISCLOSURE
This research was supported by Life Molecular Imaging GmbH (formerly Piramal Imaging GmbH), Berlin, Germany, and grants from the Korea Health Technology R&D Project through the Korea Health Industry Development Institute (KHIDI), funded by the Ministry of Health & Welfare, Republic of Korea (grants HI14C2768, HR18C0016, and HU22C0031). No other potential conflict of interest relevant to this article was reported.
Footnotes
Published online Feb. 1, 2024.
- © 2024 by the Society of Nuclear Medicine and Molecular Imaging.
REFERENCES
- Received for publication May 21, 2023.
- Accepted for publication December 8, 2023.


