
Main menu

  • Home
  • Content
    • Current
    • Ahead of print
    • Past Issues
    • JNM Supplement
    • SNMMI Annual Meeting Abstracts
    • Continuing Education
    • JNM Podcasts
  • Subscriptions
    • Subscribers
    • Institutional and Non-member
    • Rates
    • Journal Claims
    • Corporate & Special Sales
  • Authors
    • Submit to JNM
    • Information for Authors
    • Assignment of Copyright
    • AQARA requirements
  • Info
    • Reviewers
    • Permissions
    • Advertisers
  • About
    • About Us
    • Editorial Board
    • Contact Information
  • More
    • Alerts
    • Feedback
    • Help
    • SNMMI Journals
  • SNMMI
    • JNM
    • JNMT
    • SNMMI Journals
    • SNMMI

User menu

  • Subscribe
  • My alerts
  • Log in
  • My Cart

Search

  • Advanced search
Journal of Nuclear Medicine
  • SNMMI
    • JNM
    • JNMT
    • SNMMI Journals
    • SNMMI
  • Subscribe
  • My alerts
  • Log in
  • My Cart
Journal of Nuclear Medicine

Advanced Search

  • Home
  • Content
    • Current
    • Ahead of print
    • Past Issues
    • JNM Supplement
    • SNMMI Annual Meeting Abstracts
    • Continuing Education
    • JNM Podcasts
  • Subscriptions
    • Subscribers
    • Institutional and Non-member
    • Rates
    • Journal Claims
    • Corporate & Special Sales
  • Authors
    • Submit to JNM
    • Information for Authors
    • Assignment of Copyright
    • AQARA requirements
  • Info
    • Reviewers
    • Permissions
    • Advertisers
  • About
    • About Us
    • Editorial Board
    • Contact Information
  • More
    • Alerts
    • Feedback
    • Help
    • SNMMI Journals
  • View or Listen to JNM Podcast
  • Visit JNM on Facebook
  • Join JNM on LinkedIn
  • Follow JNM on Twitter
  • Subscribe to our RSS feeds
Research ArticleOncology

Understanding Changes in Tumor Texture Indices in PET: A Comparison Between Visual Assessment and Index Values in Simulated and Patient Data

Fanny Orlhac, Christophe Nioche, Michaël Soussan and Irène Buvat
Journal of Nuclear Medicine March 2017, 58 (3) 387-392; DOI: https://doi.org/10.2967/jnumed.116.181859
Fanny Orlhac
1Imagerie Moléculaire In Vivo, IMIV, CEA, INSERM, CNRS, Université Paris-Sud, Université Paris Saclay, CEA-SHFJ, Orsay, France; and
  • Find this author on Google Scholar
  • Find this author on PubMed
  • Search for this author on this site
Christophe Nioche
1Imagerie Moléculaire In Vivo, IMIV, CEA, INSERM, CNRS, Université Paris-Sud, Université Paris Saclay, CEA-SHFJ, Orsay, France; and
  • Find this author on Google Scholar
  • Find this author on PubMed
  • Search for this author on this site
Michaël Soussan
1Imagerie Moléculaire In Vivo, IMIV, CEA, INSERM, CNRS, Université Paris-Sud, Université Paris Saclay, CEA-SHFJ, Orsay, France; and
2Department of Nuclear Medicine, AP-HP, Avicenne Hospital, Bobigny, France
  • Find this author on Google Scholar
  • Find this author on PubMed
  • Search for this author on this site
Irène Buvat
1Imagerie Moléculaire In Vivo, IMIV, CEA, INSERM, CNRS, Université Paris-Sud, Université Paris Saclay, CEA-SHFJ, Orsay, France; and
  • Find this author on Google Scholar
  • Find this author on PubMed
  • Search for this author on this site
  • Article
  • Figures & Data
  • Supplemental
  • Info & Metrics
  • PDF
Loading

Article Figures & Data

Figures

  • Tables
  • Additional Files
  • FIGURE 1.
    • Download figure
    • Open in new tab
    • Download powerpoint
    FIGURE 1.

    Process for creating sphere models. σ = SD.
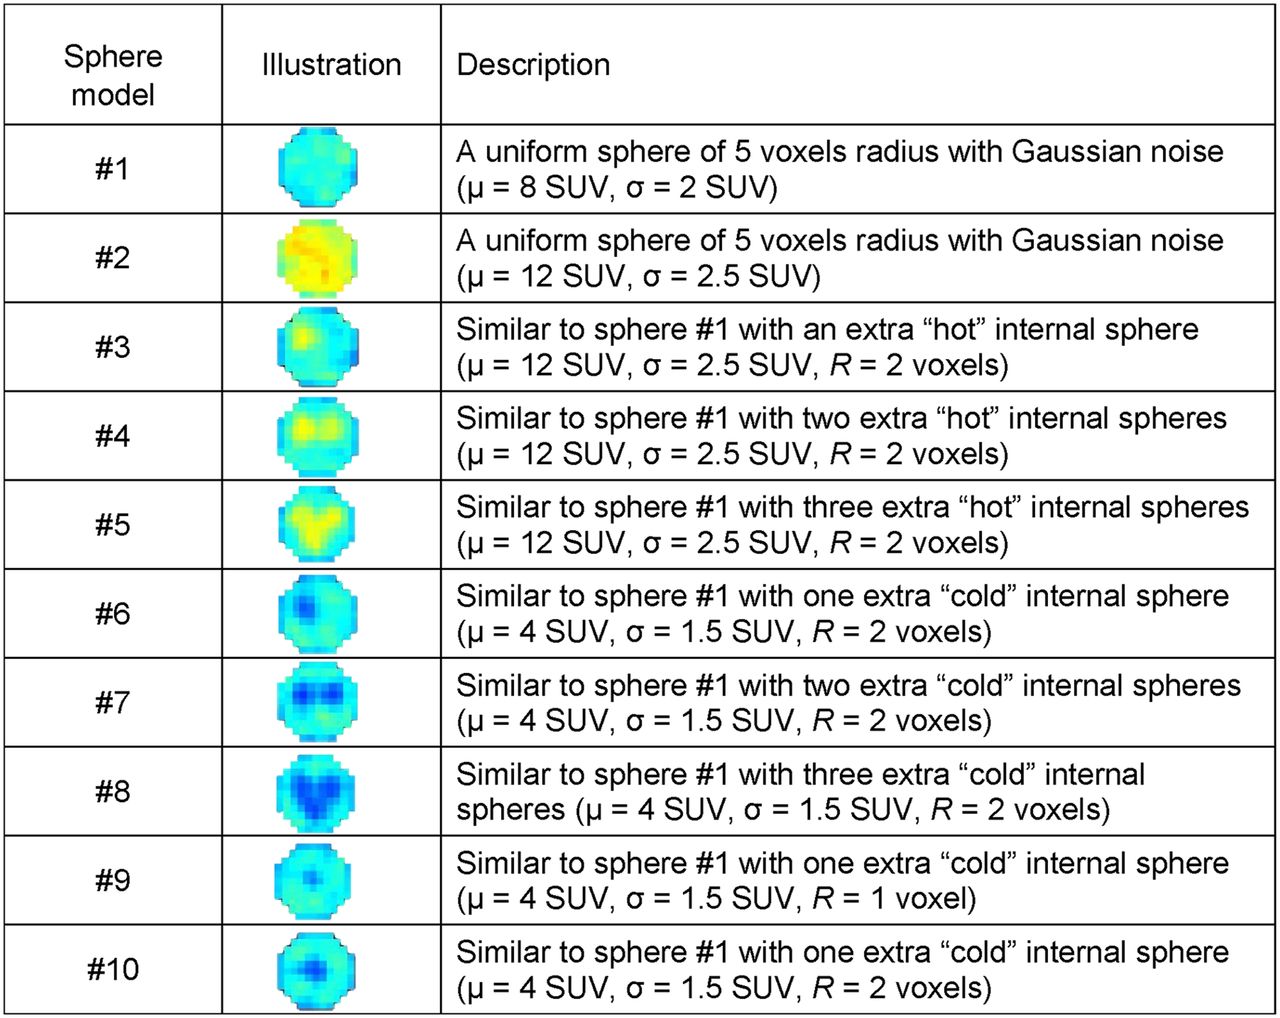
  • FIGURE 2.
    • Download figure
    • Open in new tab
    • Download powerpoint
    FIGURE 2.

    Example of 10 sphere models with edge effects. σ = SD; R = radius of internal sphere.

  • FIGURE 3.
    • Download figure
    • Open in new tab
    • Download powerpoint
    FIGURE 3.

    Plots of homogeneity (A), entropy (B), HGZE (C), and LGZE (D) for 10 sphere models with edge effects (mean and SD over 20 replicates).

  • FIGURE 4.
    • Download figure
    • Open in new tab
    • Download powerpoint
    FIGURE 4.

    Box plots of homogeneity (A), entropy (B), HGZE (C), and LGZE (D) for 10 sphere models and 54 breast tumors without and with VOI erosion of 1 voxel. *P < 0.05, Wilcoxon test. **P < 0.01, Wilcoxon test.

Tables

  • Figures
  • Additional Files
    • View popup
    TABLE 1

    Summary of Texture Index Changes as Function of Type of Heterogeneity in Sphere Models

    First texture index familySecond texture index familySUVs
    ChangeHomogeneity LREEntropy SRELGZEHGZESUVmaxSUVmean
    Increasing average uptake (1 vs. 2)—+—+++
    Including hypersignal inserts (1 vs. 3, 4, 5)—+—+++
    Including hyposignal inserts (1 vs. 6, 7, 8)—++—Not sensitive—
    Making hyposignal insert larger (1 vs. 9, 10)—++—Not sensitive—
    Changing location of hyposignal (6 vs. 10)Little to no sensitivityLittle to no sensitivityLittle to no sensitivityLittle to no sensitivityLittle to no sensitivityLittle to no sensitivity
    Removing edge effect+——+Little to no sensitivity+
    Using smaller voxels+—Little to no sensitivityLittle to no sensitivityLittle to no sensitivityLittle to no sensitivity
    • View popup
    TABLE 2

    Percentage of Breast Tumor Pairs with Less Than 5 mL of Volume Difference and Satisfying Various Conditions

    TestPercentage of pairs satisfying condition
    Homogeneity (t1) > homogeneity (t2) and LRE (t1) > LRE (t2)93.5
    Entropy (t1) > entropy (t2) and SRE (t1) > SRE (t2)91.5
    Homogeneity (t1) > homogeneity (t2) and entropy (t1) < entropy (t2)91.5
    Homogeneity (t1) > homogeneity (t2) and SRE (t1) < SRE (t2)95.0
    Entropy (t1) > entropy (t2) and LRE (t1) < LRE (t2)91.0
    SRE (t1) > SRE (t2) and LRE (t1) < LRE (t2)97.5
    HGZE (t1) > HGZE (t2) and LGZE (t1) < LGZE (t2)97.5

Additional Files

  • Figures
  • Tables
  • Supplemental Data

    Files in this Data Supplement:

    • Supplemental Data
PreviousNext
Back to top

In this issue

Journal of Nuclear Medicine: 58 (3)
Journal of Nuclear Medicine
Vol. 58, Issue 3
March 1, 2017
  • Table of Contents
  • Table of Contents (PDF)
  • About the Cover
  • Index by author
Print
Download PDF
Article Alerts
Sign In to Email Alerts with your Email Address
Email Article

Thank you for your interest in spreading the word on Journal of Nuclear Medicine.

NOTE: We only request your email address so that the person you are recommending the page to knows that you wanted them to see it, and that it is not junk mail. We do not capture any email address.

Enter multiple addresses on separate lines or separate them with commas.
Understanding Changes in Tumor Texture Indices in PET: A Comparison Between Visual Assessment and Index Values in Simulated and Patient Data
(Your Name) has sent you a message from Journal of Nuclear Medicine
(Your Name) thought you would like to see the Journal of Nuclear Medicine web site.
Citation Tools
Understanding Changes in Tumor Texture Indices in PET: A Comparison Between Visual Assessment and Index Values in Simulated and Patient Data
Fanny Orlhac, Christophe Nioche, Michaël Soussan, Irène Buvat
Journal of Nuclear Medicine Mar 2017, 58 (3) 387-392; DOI: 10.2967/jnumed.116.181859

Citation Manager Formats

  • BibTeX
  • Bookends
  • EasyBib
  • EndNote (tagged)
  • EndNote 8 (xml)
  • Medlars
  • Mendeley
  • Papers
  • RefWorks Tagged
  • Ref Manager
  • RIS
  • Zotero
Share
Understanding Changes in Tumor Texture Indices in PET: A Comparison Between Visual Assessment and Index Values in Simulated and Patient Data
Fanny Orlhac, Christophe Nioche, Michaël Soussan, Irène Buvat
Journal of Nuclear Medicine Mar 2017, 58 (3) 387-392; DOI: 10.2967/jnumed.116.181859
Twitter logo Facebook logo LinkedIn logo Mendeley logo
  • Tweet Widget
  • Facebook Like
  • Google Plus One
Bookmark this article

Jump to section

  • Article
    • Abstract
    • MATERIALS AND METHODS
    • RESULTS
    • DISCUSSION
    • CONCLUSION
    • DISCLOSURE
    • Footnotes
    • REFERENCES
  • Figures & Data
  • Supplemental
  • Info & Metrics
  • PDF

Related Articles

  • Radiomics in PET/CT: More Than Meets the Eye?
  • This Month in JNM
  • PubMed
  • Google Scholar

Cited By...

  • Prognostic Value of 18F-FDG PET Using Texture Analysis in Cardiac Sarcoidosis
  • Experimental Multicenter and Multivendor Evaluation of the Performance of PET Radiomic Features Using 3-Dimensionally Printed Phantom Inserts
  • 89Zr-Immuno-PET: Toward a Noninvasive Clinical Tool to Measure Target Engagement of Therapeutic Antibodies In Vivo
  • Optimized Feature Extraction for Radiomics Analysis of 18F-FDG PET Imaging
  • A Postreconstruction Harmonization Method for Multicenter Radiomic Studies in PET
  • Radiomics in PET/CT: More Than Meets the Eye?
  • Google Scholar

More in this TOC Section

Oncology

  • The diagnostic role of 68Ga-DOTATATE PET/CT in the detection of neuroendocrine tumors
  • Utility of bone scans in patients with RCC
  • Disseminated xanthogranulomatous oophoritis mimicking malignancy on 18F-fluorodeoxyglucose positron emission tomography/computed tomography
Show more Oncology

Translational

  • Quantitative Total-Body Imaging of Blood Flow with High-Temporal-Resolution Early Dynamic 18F-FDG PET Kinetic Modeling
  • [99mTc]Tc-MY6349 Probe for Trop2-Targeted SPECT Imaging: From Preclinical to Pilot Clinical Study
  • Imaging Diverse Pathogenic Bacteria In Vivo with 18F-Fluoromannitol PET
Show more Translational

Similar Articles

Keywords

  • texture analysis
  • tumor heterogeneity
  • PET
  • oncology
SNMMI

© 2025 SNMMI

Powered by HighWire