


Abstract
The use of texture indices to characterize tumor heterogeneity from PET images is being increasingly investigated in retrospective studies, yet the interpretation of PET-derived texture index values has not been thoroughly reported. Furthermore, the calculation of texture indices lacks a standardized methodology, making it difficult to compare published results. To allow for texture index value interpretation, we investigated the changes in value of 6 texture indices computed from simulated and real patient data. Methods: Ten sphere models mimicking different activity distribution patterns and the 18F-FDG PET images from 54 patients with breast cancer were used. For each volume of interest, 6 texture indices were measured. The values of texture indices and how they changed as a function of the activity distribution were assessed and compared with the visual assessment of tumor heterogeneity. Results: Using the sphere models and real tumors, we identified 2 sets of texture indices reflecting different types of uptake heterogeneity. Set 1 included homogeneity, entropy, short-run emphasis, and long-run emphasis, all of which were sensitive to the presence of uptake heterogeneity but did not distinguish between hyper- and hyposignal within an otherwise uniform activity distribution. Set 2 comprised high-gray-level-zone emphasis and low-gray-level-zone emphasis, which were mostly sensitive to the average uptake rather than to the uptake local heterogeneity. Four of 6 texture indices significantly differed between homogeneous and heterogeneous lesions as defined by 2 nuclear medicine physicians (P < 0.05). All texture index values were sensitive to voxel size (variations up to 85.8% for the most homogeneous sphere models) and edge effects (variations up to 29.1%). Conclusion: Unlike a previous report, our study found that variations in texture indices were intuitive in the sphere models and real tumors: the most homogeneous uptake distribution exhibited the highest homogeneity and lowest entropy. Two families of texture index reflecting different types of uptake patterns were identified. Variability in texture index values as a function of voxel size and inclusion of tumor edges was demonstrated, calling for a standardized calculation methodology. This study provides guidance for nuclear medicine physicians in interpreting texture indices in future studies and clinical practice.
An increasing number of studies focus on the characterization of tumor heterogeneity based on texture analysis from CT, MRI, ultrasound images, and, since 2009, PET images (1). The calculation of tumor heterogeneity indices from medical images offers the benefits of being noninvasive, accounting for the whole tumor, and being repeatable during treatment. These indices, if proven, could be used to reliably identify the existence of subpopulations of cells with distinct genomic alterations and could guide the choice of treatment, especially for targeted therapeutics (2). In PET, several retrospective studies suggest that texture indices reflect tumor heterogeneity and predict treatment response or patient survival whereas other studies underline the limitations of these indices (3–9). In addition, the interpretation of texture index values derived from PET images has never been reported, and texture indices have been investigated only in retrospective studies (10). A practical use of texture indices would benefit from a better understanding of which value they take as a function of the spatial distribution of the metabolic activity in the tumor.
The purpose of this study was thus to investigate how texture index values vary as a function of the macroscopic activity distribution, based on simulated sphere models and real patient tumors, in an attempt to help nuclear medicine physicians interpret texture index values.
MATERIALS AND METHODS
Numeric Model
To investigate the variations of texture indices as a function of uptake heterogeneity, we created numeric models of spheres as described in Figure 1. An arbitrary voxel size of 4 mm was used, similar to that frequently used in clinical PET. We first simulated a uniform background uptake with an SUV of 1 affected by gaussian noise (SD of 0.25, negative values set to 0). In that background, we inserted a sphere of 6-voxel radius with an SUV of 8. We then created arbitrary variations of this uniform sphere (Fig. 2). Spheres 1 (mean of distribution [μ] = 8, SD = 2) and 2 (μ = 12, SD = 2.5) had homogeneous uptake of different levels. Spheres 3–10 included internal macro metabolic heterogeneities, either as cold spheric subregions coarsely modeling hypometabolic areas (such as necrotic zones in a tumor on 18F-FDG PET) or as hot spheric subregions that could correspond to clones of the most 18F-FDG–avid cells on 18F-FDG PET. All images were smoothed using a gaussian filter to model a 7-mm PET image resolution. We analyzed the sphere images using 2 volumes of interest (VOIs): the first was a sphere of 5-voxel radius so that the sphere edges were included in the VOI, whereas the second was a sphere of 4 voxels in which the edges were excluded. Finally, the same spheres were created with a voxel size of 2 mm and analyzed with a spheric VOI of 10-voxel radius. To characterize the variability of the measurements, all 10 sphere models were simulated 20 times.

Process for creating sphere models. σ = SD.
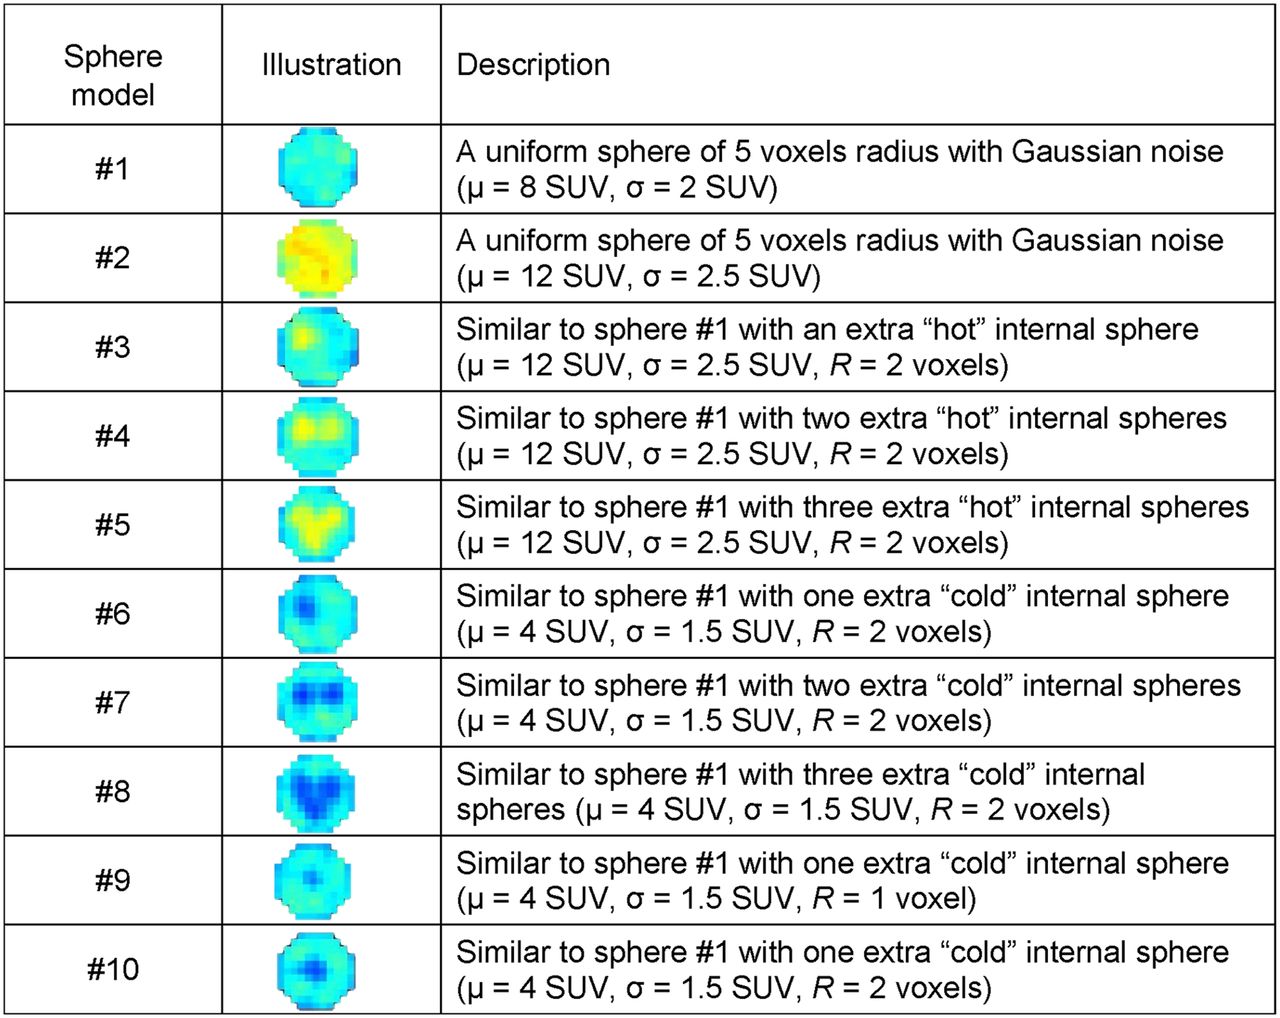
Example of 10 sphere models with edge effects. σ = SD; R = radius of internal sphere.
Patients and PET Acquisitions
To compare the observations made in spheres and in patient tumors, we retrospectively investigated primary breast lesions from 54 patients. The patient cohort and imaging protocol were described previously (5,11). The Institutional Review Board approved this retrospective study, and the requirement to obtain informed consent was waived (Ile-de-France X). PET images were expressed in SUVs normalized by the patient body weight. The lesions were segmented as described by Nestle et al. (12). After this step, an erosion of 1 voxel was performed to study the sensitivity of indices to information at the edge of the tumor VOI.
Visual Assessment of Patient Data
All lesions were reviewed independently by 2 nuclear medicine physicians (readers 1 and 2) separating lesions into 2 groups: homogeneous or heterogeneous. The readers received no instructions on how to define homogeneous and heterogeneous lesions. They were masked to clinical information and to the classification of the other reader. The images were presented to the readers in the same order and with the same color scale set between 0 SUV units and twice the SUVmean in the noneroded tumor VOI (SUVmean), as this always provided a color range visually suitable for assessing uptake heterogeneity.
Simulated Tumors Based on Real Lesions
To study the sensitivity of texture indices to hypo- and hypermetabolic regions in patient images, we created artificial tumors based on the real breast lesions using: Eq. 1where I(x) was the initial intensity of voxel x in the PET images and C(x) was the intensity of voxel x in the artificial tumor. Negative C(x) values were set to 0.
These artificial tumors were the negative of the original tumors, where highly metabolic voxels in the original tumors (e.g., with an SUV of 18) became low-metabolism voxels (with an SUV of 20 − 18 = 2 in our example) and vice versa, while retaining the spatial correlation of voxel values present in the original tumor images (Supplemental Fig. 1; supplemental materials are available at http://jnm.snmjournals.org).
Texture Analysis
In each VOI (for each sphere model, each primary tumor, and each artificial tumor), SUVmax and SUVmean were calculated. For texture index calculation, the VOI voxel intensities were resampled using 64 discrete values between 0 and 20 SUVs, corresponding to a sampling bin width of 0.3 SUVs (6,7).
Texture indices were deduced from 3 texture matrices: the cooccurrence matrix, the gray-level run length matrix, and the gray-level zone length matrix. Six texture indices (homogeneity, entropy, short-run emphasis (SRE), long-run emphasis (LRE), low gray-level zone emphasis (LGZE), and high gray-level zone emphasis (HGZE); Supplemental Table 1) were calculated using LIFEx software (http://www.lifexsoft.org). These 6 indices were the most robust with respect to the segmentation method in each texture correlation group (5).
Statistical Analysis
We investigated the texture index values in the 10 simulated spheres, with and without edge effects and with a voxel size of 4 and 2 mm, using Wilcoxon tests for comparison.
In patients, the interobserver agreement in the assessment of tumor heterogeneity was evaluated using Cohen к statistics. The ability of each parameter to distinguish between homogeneous and heterogeneous lesions as defined by the 2 readers was assessed using Wilcoxon tests. To investigate the direction of texture index changes, we selected pairs (t1, t2) of lesions with less than a 5-mL difference in metabolic volume. We computed the number of pairs with, for example, homogeneity (t1) > homogeneity (t2) and LRE (t1) > LRE (t2). We performed this test for homogeneity and LRE, entropy and SRE, homogeneity and entropy, homogeneity and SRE, entropy and LRE, SRE and LRE, and HGZE and LGZE.
To study the impact of uptake on texture index values, we computed the correlation between texture indices extracted from real lesions and those extracted from artificial tumors using the Spearman correlation coefficient. Finally, we investigated the difference in texture index values between lesions segmented with and without an erosion of 1 voxel using the Wilcoxon test. P values of less than 0.05 were interpreted as statistically significant.
RESULTS
Sphere Models
Texture Indices as a Function of Heterogeneity Type
The plots of texture index, SUVmax, and SUVmean as a function of the sphere models with edge effects show the change in the various indices as a function of simulated heterogeneity (Fig. 3 and Supplemental Fig. 2), with 4 types of texture index behavior: homogeneity and LRE varied similarly, as well as entropy and SRE, whose variations correlated negatively with those of homogeneity and LRE. LGZE varied in an opposite way to HGZE, and their variations were different from those of the other 4 texture indices.

Plots of homogeneity (A), entropy (B), HGZE (C), and LGZE (D) for 10 sphere models with edge effects (mean and SD over 20 replicates).
Homogeneity, LRE, entropy, and SRE identified sphere 1 as the most homogeneous among the models, with texture index values always being higher or lower than in any other sphere (Fig. 3 and Supplemental Fig. 2).
When inserts were included in sphere 1, homogeneity and LRE decreased and entropy and SRE increased whatever the uptake of the inserts (lower or higher than that of the rest of the sphere), and the decrease or increase was related to the number or size of the inserted spheres. The texture indices of this first index family, including homogeneity, LRE, entropy, and SRE, did not distinguish hyper- from hyposignal in the inserts, unlike HGZE and SUVmean. These latter indices decreased when low-signal inserts were included in the large sphere and increased when high-signal inserts were included, and these changes also depended on the number or size of the inserts. LGZE varied in an opposite direction to HGZE. LGZE and HGZE can thus be seen as belonging to a second texture index family.
When comparing spheres 1 (μ = 8) and 2 (μ = 12), the value of homogeneity, LRE, and LGZE decreased, whereas entropy, SRE, HGZE, SUVmax, and SUVmean increased.
No texture index was sensitive to the location of the inserts (centered in sphere 10 and at the periphery in sphere 6).
Edge Effects
The most homogeneous sphere model (sphere 1) yielded homogeneity of 0.45 ± 0.01 (average over the 20 replicates ± 1 SD), LRE of 1.55 ± 0.04, entropy of 1.87 ± 0.04, SRE of 0.895 ± 0.005, HGZE of 559 ± 10, and LGZE of 0.00192 ± 0.00004 when the edges were included in the ROI (Fig. 3 and Supplemental Fig. 2). In VOIs eroded by 1 voxel, sphere 1 exhibited a more homogeneous pattern, with homogeneity of 0.52 ± 0.01 (+14.3%), LRE of 1.68 ± 0.05 (+8.4%), entropy of 1.58 ± 0.04 (−15.2%), SRE of 0.870 ± 0.008 (−2.8%), HGZE of 722 ± 18 (+29.1%), and LGZE of 0.00145 ± 0.00004 (−24.6%) (Supplemental Fig. 3). Including the sphere edge for texture index calculation therefore changed the absolute value of texture index, but the variation in texture index as a function of uptake pattern remained similar. According to Wilcoxon testing, all indices except SUVmax were significantly different when calculated from the noneroded and eroded VOI (Fig. 4 and Supplemental Fig. 4).

Box plots of homogeneity (A), entropy (B), HGZE (C), and LGZE (D) for 10 sphere models and 54 breast tumors without and with VOI erosion of 1 voxel. *P < 0.05, Wilcoxon test. **P < 0.01, Wilcoxon test.
Between spheres 1 and 5 with sphere edge included, homogeneity, LRE, and LGZE decreased by 19.2%, 14%, and 15.6%, respectively, whereas entropy, SRE, and HGZE increased by 21.5%, 4.0%, and 29.7%, respectively. When edges were excluded, entropy, SRE, and HGZE increased by 34.8%, 6.8%, and 31.9%, respectively, between spheres 1 and 5 whereas the other texture indices decreased: homogeneity (−27.2%), LRE (−20.9%), and LGZE (−21.1%). The difference in texture index values between sphere 1 with edge effects and sphere 1 without edge effects was lower than the difference between spheres 1 and 5 (both with and without edge effects) except for LGZE (Fig. 3 and Supplemental Figs. 2 and 3).
Influence of Voxel Size
Noneroded sphere 1 exhibited a more homogeneous pattern with the 2-mm voxel size than with the 4-mm voxel size: homogeneity of 0.61 ± 0.01 (+35.5%), LRE of 2.9 ± 0.1 (+85.8%), entropy of 1.58 ± 0.04 (−15.7%), SRE of 0.785 ± 0.009 (−12.3%), HGZE of 560 ± 11 (+0.1%), and LGZE of 0.00188 ± 0.00004 (−1.7%). The use of smaller voxels did not change the variations in texture indices as a function of the sphere model (Supplemental Fig. 5).
Table 1 summarizes the changes in texture indices and conventional indices depending on the sphere model.
Summary of Texture Index Changes as Function of Type of Heterogeneity in Sphere Models
Patient Data
The noneroded mean breast tumor volume was 43.0 ± 51.1 mL (range, 5.0–316.7 mL).
Comparison Between Sphere Model and Patient Data
The box plots of texture indices for the sphere models and patient data show that the sphere models led to texture index values similar to those encountered in patient tumors, although the variability in texture indices in our 10 spheres was less than that observed in the patients (Fig. 4 and Supplemental Fig. 4).
To study the relevance of the texture index variations identified from sphere models, we had 199 pairs of breast lesions with a difference in metabolic volume lower than 5 mL. Table 2 shows that homogeneity and LRE varied in the same direction in 93.5% of the pairs whereas entropy and SRE varied in the same direction in 91.5% of the pairs. Homogeneity and LRE varied in an opposite direction to entropy and SRE in 91%–97.5% of pairs. HGZE and LGZE varied in opposite directions in 97.5% of lesion pairs.
Percentage of Breast Tumor Pairs with Less Than 5 mL of Volume Difference and Satisfying Various Conditions
Texture Indices Versus Visual Heterogeneity Assessment
Interobserver agreement (Cohen к) was 0.765 (P < 0.01) for classifying lesions into 2 groups: heterogeneous (n = 30 for reader 1 and n = 34 for reader 2) or homogeneous (n = 24 for reader 1 and n = 20 for reader 2). The consensus interpretation yielded 19 homogeneous and 29 heterogeneous lesions. All indices significantly differed between the 2 lesion groups, except SRE and LRE, with P values of 0.07 and 0.08, respectively, on Wilcoxon testing (Supplemental Table 2). Heterogeneous lesions exhibited a higher value than homogeneous lesions for entropy, SRE, HGZE, SUVmax, SUVmean, and metabolic volume. Conversely, homogeneity, LRE, and LGZE were higher in homogeneous lesions than in heterogeneous ones.
To study the impact of uptake values on texture indices, we plotted indices computed from the artificial tumors as a function of the same indices computed from the real lesions (Supplemental Fig. 6). By definition, the values of homogeneity, LRE, entropy, and SRE (first family) were identical for the artificial and real lesions. Inversely, HGZE and LGZE were negatively correlated (r = −1 for HGZE and r = −0.99 for LGZE), as well as SUVmax (r = −0.68) and SUVmean (by definition).
Edge Effects
The values of entropy and LGZE were significantly higher in the noneroded breast tumors than in the same tumors with an erosion of 1 voxel (Fig. 4 and Supplemental Fig. 4). Conversely, HGZE was significantly higher in eroded tumors. When we eroded the lesions with 1 voxel, entropy, SRE, and LGZE decreased by −10.1%, −0.4%, and −42.4%, respectively, whereas the other texture indices increased: homogeneity (11.7%), LRE (0.9%), and HGZE (44.3%).
DISCUSSION
In this study, to help nuclear medicine physicians understand texture index values in a clinical setting, we showed how different texture indices vary as a function of uptake pattern based on numeric models and patient lesions.
Using sphere models and real tumors, we found that texture indices varied consistently with visual assessment of uptake heterogeneity, unlike a previous study (13) that found the so-called homogeneity textural index to be highest in tumors that were visually assessed as the most heterogeneous (Fig. 2 of Tixier et al. (13)). In our sphere models, the sphere that was the most homogeneous (Fig. 2, sphere 1) was identified as such by all texture indices (Fig. 3 and Supplemental Fig. 2). This was also true for the patient tumors. For instance, in Supplemental Table 2, homogeneous lesions had a higher value of homogeneity and LGZE and a lower value of entropy and HGZE than did the visually heterogeneous lesions. As expected, entropy, which reflects disorder (14), varies in an opposite direction to homogeneity, whereas in a previous study (15) these 2 indices surprisingly varied in the same directions. The reason for these different results is the SUV resampling step used for texture index calculation. We rescaled the SUVs in the VOI to between 0 and 20 whatever the SUVmax in the VOI (called absolute resampling (7)), whereas in most articles (13,15), resampling was performed between the minimum SUV and SUVmax in the VOI (called relative resampling). As shown in Supplemental Fig. 7, when relative resampling was used, the variations in texture indices were counterintuitive: sphere 3 was identified as the most homogeneous sphere by the first family of texture indices whereas sphere 1 was the most homogeneous by construction. Also, LGZE increased and HGZE decreased when a hypersignal was added (sphere 3 vs. 1). Similarly, in patient data (Supplemental Table 3), lesions classified as homogeneous by the physicians exhibited a lower value for the homogeneity index than did heterogeneous lesions. This finding shows that absolute resampling not only reduces the dependency of texture indices on the tumor volume, enhances tissue discrimination based on texture indices, and increases the correlation of texture indices with SUV (7) but also yields variations in texture indices consistent with the visual assessment.
Our results suggest that different texture indices reflect different types of visual heterogeneity. Simulated spheres show that texture indices from the first family (homogeneity, entropy, SRE, and LRE) are not sensitive to the fact that the heterogeneity is caused by a hypo- or hypersignal, unlike HGZE and LGZE (Fig. 3 and Supplemental Fig. 2). The changes in texture index as a function of sphere model were partly validated using the real breast lesions, by analyzing pairs of tumors and checking that when a texture index was greater in one lesion than in another, this difference was also reflected by another texture index (Table 2). The comparison of artificial and real lesions confirms that texture indices from the first family were immune to the nature of the heterogeneity (hypo- or hypersignal). This result is also consistent with our previous investigation of the biologic meaning of texture indices (16). In that investigation, we demonstrated that texture indices of the first family measured from autoradiography images were sensitive to the cell pattern seen on a histologic slice, whereas texture indices from the second family were mostly sensitive to cell density. The identification of these 2 families of texture index might explain why different texture indices may be useful in different settings. For instance, the high-gray-level-run emphasis index (which behaves similarly to HGZE (5)) better assessed invasive breast cancer aggressiveness than homogeneity and entropy (11). Yet, in esophageal cancer, entropy was significantly correlated with the T and N stage (17), could distinguish malignant tumors in bone and soft-tissue lesions (18), and was associated with overall survival in non–small cell lung cancer patients (19).
Several studies (3–5,20–24) investigated the robustness of texture indices as a function of various parameters (Supplemental Table 4). Given that there is no consensus on the most accurate tumor segmentation method, the robustness of texture indices as a function of the tumor delineation has to be known. For example, 4 studies demonstrated that entropy was either slightly (5,23,24) or moderately (20) influenced by the segmentation method. Our results also showed the impact of including edges in the VOI used to calculate the texture indices. Including the tumor edges did not change the way each texture index varied from one sphere to another (Fig. 3 and Supplemental Figs. 2 and 3) but significantly changed the value of the texture index. For instance, for sphere 1, entropy was 1.58 without edge effects versus 1.87 with edge effects. This finding underlines the difficulty of comparing texture index values reported in different articles using different tumor delineation methods. When the tumor region was eroded by 1 voxel, the heterogeneity was reduced (Fig. 4 and, Supplemental Fig. 4), with lower entropy and higher homogeneity than for the initial VOI, and the difference in texture index values between spheres 1 and 5 was higher for eroded VOI than for noneroded VOI. Using patient data, the texture index values were significantly different for entropy, LGZE, and HGZE between the 2 tumor segmentations (with and without erosion). This suggests that using tight contours around the tumors may make different tumor metabolic patterns more easily distinguishable using texture indices than when using loose tumor delineation. Another factor affecting texture index values is voxel size. Indeed, the same uptake pattern is seen as more homogenous by texture indices with a voxel size of 2 mm (Supplemental Fig. 5) than with a voxel of 4 mm (Fig. 3 and Supplemental Fig. 2). This is consistent with our previous observations (16): autoradiography images (voxel size, 50 × 50 × 20 μm) exhibited a more homogenous texture than preclinical PET images (voxel size, 388 × 388 × 796 μm). Using the simulated spheres, we demonstrated that homogeneity and LRE were the most variable with voxel size, with an increase of 35.5% and 85.5%, respectively, between sphere 1 described with voxels of 2 and 4 mm, whereas entropy and SRE were less influenced and LGZE and HGZE were robust to voxel size change (Supplemental Table 4). These results call for a precise description of all parameters that might affect texture index values in publications, so that texture index values can be compared and ultimately be used in prospective studies.
Overall, among the 6 investigated texture indices, compiling previously published results with ours regarding the impact of voxel size and edge effects, entropy appeared to be the most robust with respect to all parameters listed in Supplemental Table 4, with a low variability for 11 criteria and a moderate variability for 5.
Although our numeric sphere models were simple, the observations made from these models were extremely consistent with what was measured in patient tumors. The use of these simple models made it possible to fully control several parameters (volume, SUV, type of heterogeneity, location of inserts) whereas this was not possible in real tumors. By combining observations made from these models and from real lesions, the interpretation of texture indices could be clarified. Our work is a first attempt to contribute to a better understanding of the meaning and interpretation of texture indices under specific conditions, but given the variability of texture index values as a function of the parameters listed in column 2 of Supplemental Table 4, extra work is still needed to define reference texture index values required for using texture indices in prospective studies.
In radiomics (25), it is assumed that image features can also reflect tumor characteristics that may not be visually assessed. These characteristics still certainly reflect some underlying biologic processes. In addition to the visual interpretation of image-derived features addressed here, efforts should thus be pursued to elucidate their microscopic biologic meaning as initiated previously (16,26).
CONCLUSION
Using simulated and patient data, we showed how texture index values vary as a function of uptake pattern. We demonstrated that texture indices can reflect heterogeneous uptake and identified 2 families of texture index, consistent with previous observations on the biologic relevance of texture indices. The texture index values observed in our simulations were within the range observed in patient breast tumors, and the changes in texture index values as a function of the uptake pattern or edge effects observed in the simulations were consistent with those observed in real tumors. This study provides guidance for nuclear medicine physicians in using and interpreting texture indices in future studies and clinical practice.
DISCLOSURE
This work is supported by the “Lidex-PIM” project funded by the IDEX Paris-Saclay, ANR-11-IDEX-0003-02. No other potential conflict of interest relevant to this article was reported.
Footnotes
Published online Oct. 6, 2016.
- © 2017 by the Society of Nuclear Medicine and Molecular Imaging.
REFERENCES
- Received for publication July 28, 2016.
- Accepted for publication September 12, 2016.


Jump to section
Related Articles
Cited By...
- Prognostic Value of 18F-FDG PET Using Texture Analysis in Cardiac Sarcoidosis
- Experimental Multicenter and Multivendor Evaluation of the Performance of PET Radiomic Features Using 3-Dimensionally Printed Phantom Inserts
- 89Zr-Immuno-PET: Toward a Noninvasive Clinical Tool to Measure Target Engagement of Therapeutic Antibodies In Vivo
- Optimized Feature Extraction for Radiomics Analysis of 18F-FDG PET Imaging
- A Postreconstruction Harmonization Method for Multicenter Radiomic Studies in PET
- Radiomics in PET/CT: More Than Meets the Eye?