


Article Figures & Data
Figures
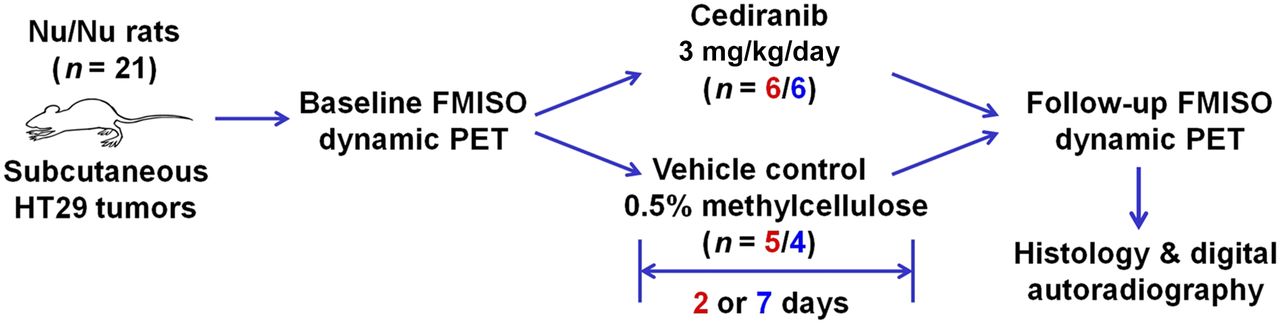
- FIGURE 1.
Experimental schematic. Animals bearing colorectal carcinoma xenografts were imaged with dynamic 18F-FMISO PET at baseline and subsequently randomized into cediranib and vehicle groups. After completion of treatment, second dynamic 18F-FMISO PET scan was obtained, followed by ex vivo analysis of tumor specimens.
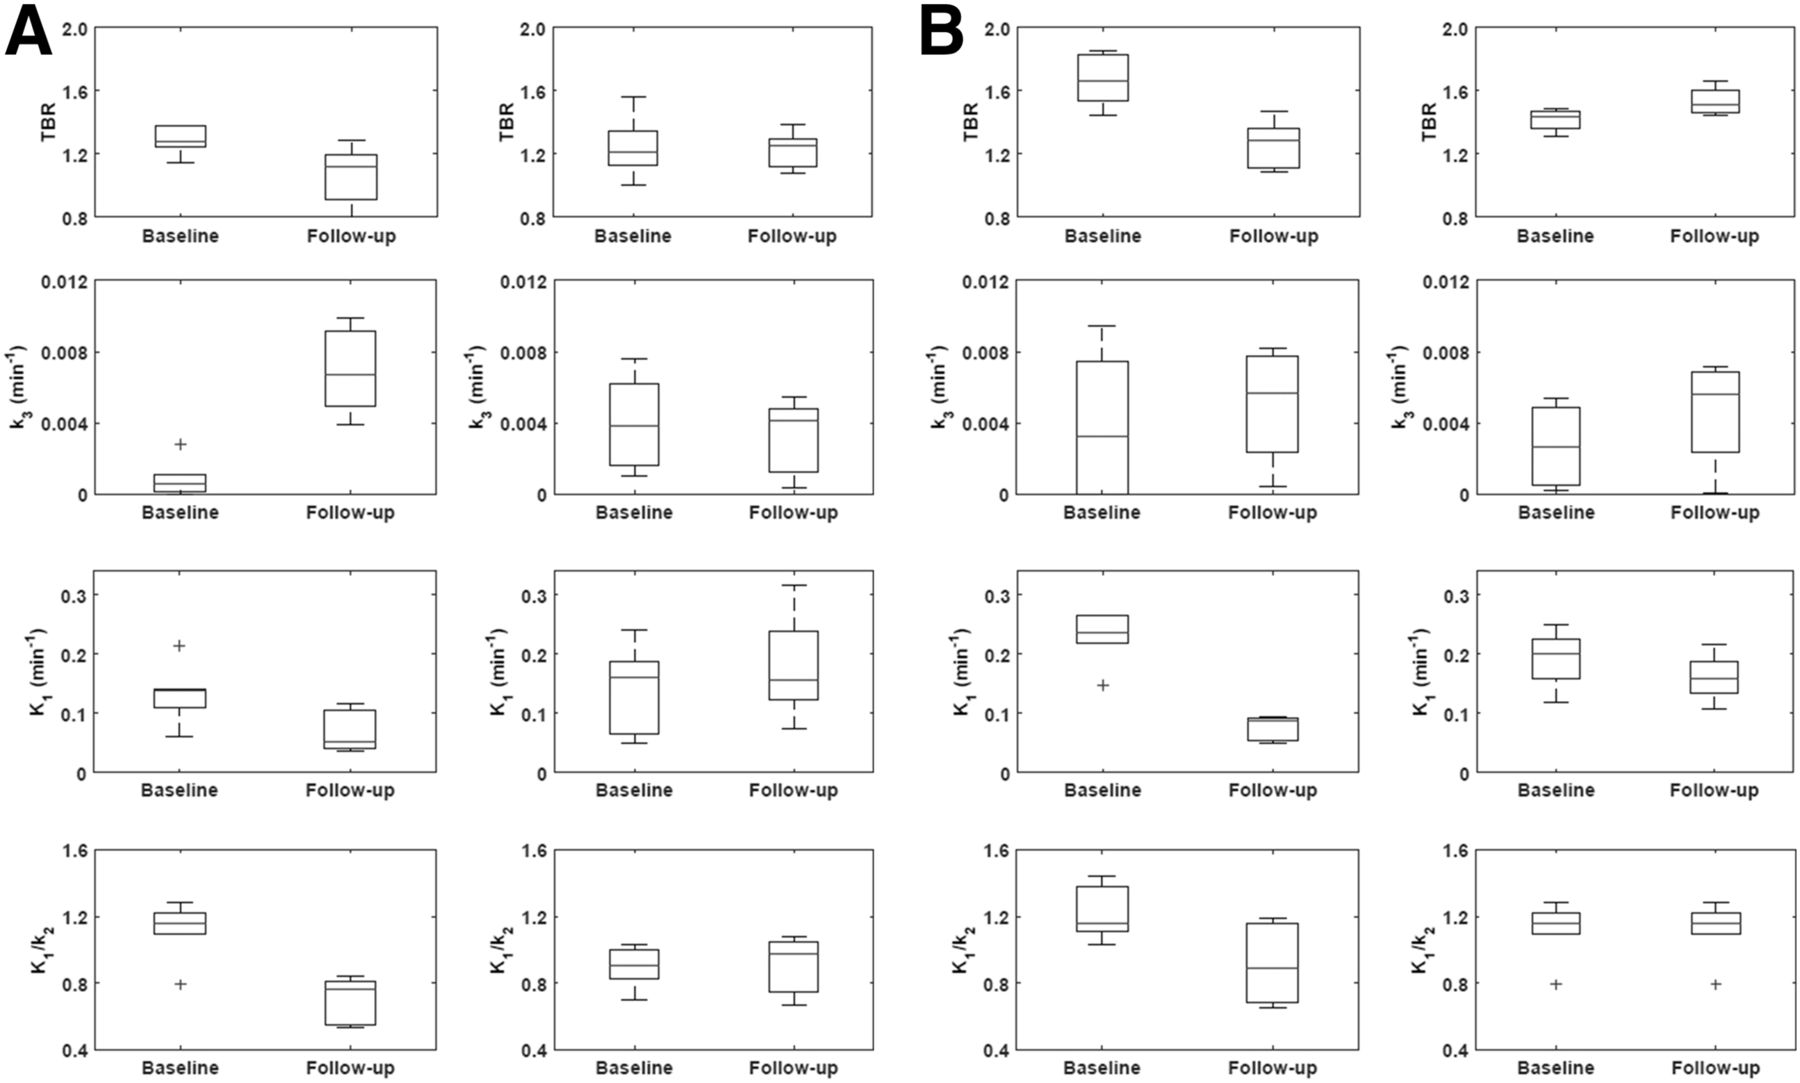
- FIGURE 2.
(A) Box-and-whisker plots summarizing mean intratumor values of TBR, k3, K1, and K1/k2 for animals treated 2 d with cediranib (left panels) or 2 d with vehicle (right panels). (B) Corresponding plots for animals treated for 7 d with cediranib (left panels) or 7 d with vehicle (right panels).
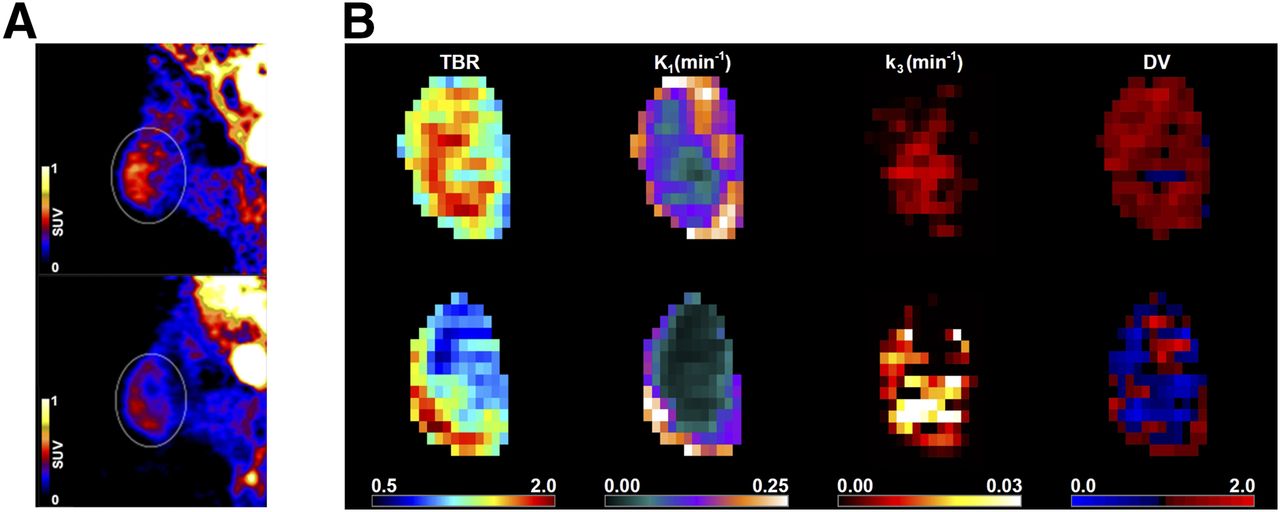
- FIGURE 3.
(A) Single-slice, midtumor PET images obtained 90 min after injection from representative animal in 7-d cediranib group at baseline (left) and after treatment (right). (B) Intratumor voxelwise maps (coronal view) derived from dynamic PET images of same animal at baseline (top row) and after treatment (bottom row). DV = distribution volume.
- FIGURE 4.
(A) Correlation between k3 and TBR, two surrogate markers of tumor hypoxia, for representative animal in 7-d cediranib group. Pearson r between k3 and TBR changed substantially, from 0.65 on baseline scan (blue) to −0.45 at follow-up (red), whereas T* increased from 22 to 60 min, respectively. (B) Corresponding scatterplot for representative animal in 2-d vehicle group. Pearson r between k3 and TBR changed only slightly, from 0.85 on baseline scan (blue) to 0.73 at follow-up (red), whereas T* remained relatively unchanged (27 and 29 min, respectively).
- FIGURE 5.
Hematoxylin and eosin (H&E), digital autoradiography (DAR), and immunofluorescence (IF) (green = pimonidazole, blue = Hoechst 33342) analysis of ex vivo tumor sections. Upper and lower zoom regions are indicated on whole-mount hematoxylin and eosin images. (A) Tumors in the cediranib group showed viable central regions positive for pimonidazole but lacking 18F-FMISO uptake (black arrows). (B) Tumors in the vehicle group showed strong correspondence between pimonidazole staining and 18F-FMISO uptake in both central and peripheral regions.


Tables
- TABLE 1
Tumor Volume, SUVmean, and SUVmax Before and After Treatment with Cediranib or Vehicle for 2 or 7 Days
Volume (mm3) SUVmean SUVmax Length of treatment Before After Before After Before After 2 d Cediranib (n = 6) 330 ± 63 345 ± 53 0.52 ± 0.04 0.39 ± 0.08 0.96 ± 0.09 0.73 ± 0.18 P 0.67 0.01* 0.03* Vehicle (n = 5) 526 ± 378 518 ± 422 0.53 ± 0.05 0.49 ± 0.07 1.05 ± 0.15 1.00 ± 0.20 P 0.98 0.11 0.36 7 d Cediranib (n = 6) 700 ± 297 604 ± 248 0.56 ± 0.17 0.38 ± 0.08 0.99 ± 0.32 0.71 ± 0.19 P 0.56 0.01 0.01* Vehicle (n = 4) 577 ± 556 931 ± 982 0.58 ± 0.18 0.52 ± 0.21 1.07 ± 0.31 0.92 ± 0.46 P 0.55 0.40 0.30 ↵* Statistically significant.
- TABLE 2
18F-FMISO Kinetic Modeling Before and After Treatment with Cediranib or Vehicle for 2 or 7 Days
K1 (min−1) k3 (min−1) K1/k2 TBRmean T* (min) Length of treatment Before After Before After Before After Before After Before After 2 d Cediranib (n = 6) 0.13 ± 0.05 0.07 ± 0.03 0.0009 ± 0.0011 0.0069 ± 0.0023 1.12 ± 0.17 0.71 ± 0.13 1.28 ± 0.09 1.06 ± 0.20 44 ± 12 58 ± 25 P 0.02* <0.01* <0.01* 0.03* 0.24 Vehicle (n = 5) 0.14 ± 0.08 0.17 ± 0.09 0.0040 ± 0.0027 0.0032 ± 0.0022 0.90 ± 0.13 0.91 ± 0.18 1.24 ± 0.20 1.22 ± 0.12 40 ± 21 29 ± 14 P 0.46 0.62 0.51 0.87 0.39 7 d Cediranib (n = 6) 0.24 ± 0.07 0.08 ± 0.02 0.0039 ± 0.0039 0.0050 ± 0.0032 1.21 ± 0.16 0.91 ± 0.23 1.66 ± 0.16 1.27 ± 0.15 25 ± 6 55 ± 7 P <0.01* 0.60 0.02* <0.01* <0.01* Vehicle (n = 4) 0.19 ± 0.05 0.16 ± 0.04 0.0027 ± 0.0026 0.0046 ± 0.0032 1.18 ± 0.15 1.14 ± 0.19 1.42 ± 0.07 1.53 ± 0.10 32 ± 6 34 ± 4 P 0.40 0.39 0.78 0.11 0.65 ↵* Statistically significant.
Supplemental Data
Files in this Data Supplement:


