


Abstract
Glioblastoma multiforme (GBM) is the most common and aggressive primary brain tumor. This aggressiveness is in part attributed to the closely interrelated phenomena tumor hypoxia and angiogenesis, although few in vivo data exist in human brain tumors. This work aimed to study hypoxia and angiogenesis, in vivo and in situ, in patients admitted with GBM using multimodal imaging. Methods: Twenty-three GBM patients were assessed by 18F-fluoromisonidazole (18F-FMISO) PET and conventional and perfusion MRI before surgery. The level and location of hypoxia (18F-FMISO uptake, evaluated by tumor-to-blood [T/B] ratio), vascularization (cerebral blood volume [CBV]), and vascular permeability (contrast enhancement after gadolinium injection) were analyzed. The spatial relationship between tumor hypoxia and angiogenesis was assessed by an overlap analysis of the volume of 18F-FMISO uptake and the volumes of the high CBV regions and the contrast-enhancement regions. Results: A significant correlation was found between hypoxia and hypervascularization, especially for their maximum values (volume of maximal tumor hypoxia vs. relative CBV: r = 0.61, P = 0.002) and their volumes (hypoxia vs. hypervascularization: r = 0.91, P < 0.001). A large proportion of the high CBVs collocated with hypoxia (81.3%) and with contrast enhancement (46.5%). Conclusion: These results support the hypothesis of a tight association between hypoxia and angiogenesis. Our results suggest that there is insufficient tumor oxygenation in human GBM, despite increased tumor vascularization.
Glioblastoma multiforme (GBM) is the most common primary brain tumor and one of the most aggressive forms of cancer in humans, with an estimated incidence of 2–3/100,000 in Europe and North America (1). Glioblastoma is particularly resistant to antitumor treatments, with a high rate of rapid recurrence and short survival (12–15 mo) (2,3).
GBM is typically characterized by a central necrosis aspect surrounded by heterogeneous contrast enhancement (CE) after gadolinium injection on MRI (4,5). These imaging features are supported by 2 pathophysiologic phenomena: tumor hypoxia and angiogenesis (6). Hypoxia induces the expression of several genes involved in angiogenesis, proliferation and survival, anaerobic metabolism, pH regulation, and migration of tumor cells (7). Angiogenesis is one of the most important consequences of the hypoxic signal, which leads to an increased vascularization that favors tumor nutrition and growth (8,9). Furthermore, these tumors are heterogeneous, both between different patients and within the tumor itself (10). Therefore, an imaging approach is well suited for the characterization of the different tumor compartments.
PET is currently considered to be the most appropriate imaging method for assessing tumor hypoxia (8). This method sensitively and quantitatively estimates local concentrations of radioactive molecules, such as nitroimidazole derivatives labeled with 18F, used as markers of hypoxia. Among the nitroimidazole derivatives already synthesized, 18F-fluoromisonidazole (18F-FMISO) is the most used and studied radiotracer in human brain tumors. These compounds exclusively accumulate in hypoxic viable cells after reduction reactions in the absence of oxygen, necrotic cells lacking the necessary enzymatic activity (8,11,12). This uptake is detected when pO2 is less than 10 mm Hg (13).
MRI plays an increasingly important role in the in vivo characterization of tumor vascularization, representative of the extent of angiogenesis. Perfusion MRI (through the use of the first pass of a contrast agent, also called dynamic susceptibility contrast MRI) assesses changes in tumor microvascularization. The intensity of the signal is dependent on the concentration of gadolinium (Gd) in the vessels, and the number and diameter of the vessels (14). Image postprocessing can determine several parameters including the relative cerebral blood volume (rCBV) in each slice and for each voxel.
Experimental data have shown a strong link between hypoxia and angiogenesis (7,15,16). Although it is widely acknowledged that tumor angiogenesis is triggered by hypoxia, few data exist of this association in vivo in human GBM. A recent multicenter study found that pretreatment abnormal tumor vasculature (as measured by MRI) and hypoxia (as measured by 18F-FMISO PET) were associated with worse survival in patients with newly diagnosed GBM (17). Specifically, they found that increased tumor perfusion, vascular volume, vascular permeability, and hypoxia are negative prognostic markers, all of which can be measured safely and reliably using MRI and 18F-FMISO PET (17).
This work sought to study, in vivo and in situ, the spatial relationship between hypoxia and angiogenesis in GBM using 18F-FMISO PET imaging and advanced MRI techniques. The purpose of the work was to characterize the relationships between hypoxia and angiogenesis markers with quantitative multiparametric and qualitative spatial analysis.
MATERIALS AND METHODS
Patient Population
Patients were included between October 2010 and May 2012, in the University Hospital of Caen, Caen, France. The study was approved by the ethics committee CPP (Comité de Protection des Personnes) Nord-Ouest III and AFSSAPS (Agence française de sécurité sanitaire des produits de santé) and registered under EUDRACT no. 2009-015543-16 and ClinicalTrials.gov NCT01200134. All the patients signed an informed consent form.
Patients with a presumed diagnosis of glioblastoma underwent an MRI in the University Hospital of Caen and a 18F-FMISO PET at the Cyceron Biomedical imaging platform (Caen, France) within the same week. The patients then underwent surgical resection or biopsy. The diagnosis of glioblastoma was established by an experienced neuropathologist of the University Hospital of Caen, according to the World Health Organization 2007 criteria.
18F-FMISO PET Examination
18F-FMISO radiotracer was produced by the LDM-TEP group (UMR 6301 ISTCT) as previously described (18). Images were acquired using a GE Healthcare Discovery RX VCT HD scanner (CYCERON Biomedical Imaging Platform, spatial resolution of 6 mm in full width at half maximum), 2 h (120.95 ± 2.77 min) after radiotracer injection at a dose of 5 MBq/kg. Blood samples were taken immediately before and after image acquisition (duration of scan, 20 min), and the mean value was used for tumor-to-blood (T/B) ratio. The attenuation-corrected images were reconstructed with an ordered-subset expectation maximization 2-dimensional algorithm (9 subsets and 2 iterations) and filtered in 3 dimensions with a Butterworth filter. For image normalization and quantification, we used the T/B method (T/B = radiotracer fixation in tumor [kBq/mL]/measured mean blood activity [kBq/mL]) as described elsewhere (19).
MRI Examination
MRI was performed on a GE Healthcare Signa HDxt 1.5T machine. The following MRI sequences were used: standard anatomic sequences, including axial T1-weighted and axial fluid-attenuated inversion recovery (FLAIR) sequences (24 slices; slice spacing, 5.5; pixel resolution, 0.47 × 0.47 mm; repetition time [TR]/echo time [TE], 450/11 ms for T1-weighted and 9,602/150 ms for FLAIR); a dynamic susceptibility contrast first-pass perfusion sequence; and a 3-dimensional T1-weighted sequence (124 slices; slice spacing, 1.5; pixel resolution, 1.01 × 1.01 mm; TR/TE, 14/3 ms).
For the perfusion sequence, dynamic T2* gradient-echo weighted images were acquired immediately before, during, and after the first pass of the gadolinium intravenous contrast, injected at a dose of 0.1 mmol/kg (14 slices, 35 repetitions; slice spacing, 7 mm; pixel resolution, 2.19 × 2.19 mm; TR/TE, 2,280/60 ms). Then a 3-dimensional T1-weighted sequence was used to evaluate gadolinium enhancement (T1Gd sequence) as a reflection of vessel permeability. The cerebral blood volume (CBV) maps were computed with ImageJ software (National Institutes of Health, 2013), according to the method published by Collet et al. (20).
Image Processing and Parameter Calculation
MRI sequences and CBV maps were coregistered with 18F-FMISO PET images with trilinear interpolation, rigid matching, and normalized mutual information using PMOD software (version 3.1; PMOD Technologies Ltd., 2010).
Three regions of interest (ROIs) were manually delimited at the tumor site on MRI: radiologic necrosis region, corresponding to the central hypointensity on T1Gd sequences, considered a zone of macroscopic necrosis; classic tumor region, representing the tumor areas limited by the signal hyperintensity on T1Gd sequences, including the radiologic necrosis region; and total tumor region, corresponding to all the areas of hyperintensity on FLAIR sequences, including the classic tumor region (Fig. 1). Thereafter, 2 other ROIs were calculated from the previous 3: exclusive FLAIR region, consisting of the FLAIR hyperintensity beyond the T1Gd hyperintensity (total tumor region – classic tumor region), considered a region of brain edema and invasion; and CE region (classic tumor region – radiologic necrosis region). The latter is the region of gadolinium leakage due to the abnormal vascular permeability (12,14,21). An ROI was defined in contralateral healthy cerebral parenchyma (in the normal-appearing white matter) for creation of normalized CBV values (rCBV) and volumes segmentation. These different ROIs were transposed onto all modalities (Fig. 1).

Delimitation of different ROIs. T1Gd images (A) were used to calculate the following ROIs: classic tumor region (B, cyan), radiologic necrosis region (T1Gd central hyposignal; B, magenta), and, by subtraction, CE region (C). FLAIR images (D) were used to calculate the total tumor region (D, yellow) and exclusive FLAIR region (D, region between yellow and cyan). ROIs have been transposed on modalities (E and F) for calculating parameters. Then, a semiautomatic segmentation was performed for high-CBV (G) and –18F-FMISO uptake (H) volumes.
Next, the following parameters were calculated for each tumor and each ROI: first, mean (rCBVmean) and maximal (rCBVmax) relative CBV, defined as the ratio between mean or maximal CBV of a tumor ROI and the mean CBV of the contralateral ROI (22); and second, T/Bmean, and T/Bmax, defined as mean and maximal values of T/B of a tumor ROI.
To assess the spatial relationships between the ROIs, a comparison was made between the volume of 18F-FMISO uptake and tumor volumes corresponding to the areas of high CBV and CE. The following volumes were established using semiautomatic segmentation. Hypoxic tumor volume is the volume obtained after thresholding the 18F-FMISO images by the contralateral 95 centile. Thus, the tumor pixels were considered hypoxic when their value was higher than the values of 95% of pixels of the normal brain tissue (contralateral ROI) (Fig. 1). Hypervascularized tumor volume is the volume resulting from thresholding CBV maps by the contralateral 95 centile, with suppression of pixels corresponding to normal cerebral vessels, anatomically identified on the T1Gd sequences in brain fissures (Fig. 1). The volume of maximal tumor hypoxia results from thresholding the 18F-FMISO images by the tumor 95 centile (total tumor regions), that is, corresponding to 5% of the most intense pixels (most hypoxic) within the tumor. The volume of maximal tumor vascularization is the volume corresponding to 5% of the most intense pixels on the CBV maps (most vascularized) within the tumor. And last, the permeable tumor volume is the volume of the zone of abnormal vascular permeability, calculated from the CE regions.
Statistical Analysis
Data are expressed as mean ± SD. Comparisons between quantitative variables were performed using simple linear regression tests and associations sought with Pearson correlation tests. Comparisons of categoric variables were performed using ANOVA and the Student t test for paired samples. The statistical significance threshold was a P value of 0.05. All statistical analyses were performed using JMP software (SAS Institute Inc., 2012). The spatial relations were evaluated with an object-based colocalization analysis with measure of overlap rates between the volumes. To present this graphically, a Venn diagram was performed using a JMP add-in.
RESULTS
Patients
Twenty-three patients were included (5 women and 18 men), with a mean age of 61.4 y (range, 28–79 y). All the patients had a confirmed diagnosis of glioblastoma (World Health Organization grade IV) after surgical biopsy or resection.
Hypoxic Profile of Tumors with 18F-FMISO PET Imaging
All GBM patients presented 18F-FMISO uptake, with a T/Bmean in total tumor regions of 1.17 ± 0.22 (vs. 1.04 ± 0.16 in the contralateral normal brain tissue, P < 0.001). Hypoxic tumor volumes presented wide variations between patients, with a mean of 52.06 ± 38.23 cm3. Across all the tumors, 45% of the hypoxic volume was localized in the CE region, 40% in the exclusive FLAIR region, and 15% in the radiologic necrosis region. Maximal tumor hypoxia showed a significantly different distribution, with 61% of this volume localized in the CE region and only 8% within the exclusive FLAIR region, but with 31% in the radiologic necrosis region. Figure 2 shows an illustrative case of hypoxia localization.

Right occipital glioblastoma. (A) MRI T1Gd sequence, illustrating typical appearance of glioblastoma with peripheral hypersignal reflecting extravasation of gadolinium, associated with central hyposignal (radiologic necrosis). (B) FLAIR sequence showing hyperintensity that far exceeds volume of CE. (C) 18F-FMISO PET image (T/B) revealing significant uptake within tumor. Yellow outline shows automatic thresholding by contralateral 95 centile, which yielded hypoxic tumor volume. (D) CBV map also shows widespread tumor vascularization. Cyan outline represents threshold by contralateral 95 centile, which has produced hypervascularized tumor volume. (E) Representation of different volumes on T1Gd sequence after coregistration of all modalities. White area represents CE compartment, and brown zone represents exclusive FLAIR region. (F–H) Automatic thresholding on same images of C, D, and E of volume of maximal tumor hypoxia (F) and volume of maximal tumor vascularization (G) by tumoral 95 centile (5% of most intense pixels).
Vascularization Profile of Tumors with MRI
Two patients could not be included in CBV analysis (no perfusion MRI available). For the other 21 patients, CBV was significantly higher in the tumor than the contralateral side (0.13 ± 0.05 vs. 0.10 ± 0.03, P < 0.001), resulting in an rCBVmean in total tumor regions of 1.41 ± 0.31. Hypervascularized tumor volume was on average 26.35 ± 18.9 cm3. The permeable tumor volume was 30.15 ± 26.25 cm3. Concerning the localization of hypervascularization zones within the tumor, 46% was within the CE region, 39% in the exclusive FLAIR region, and 15% in the radiologic necrosis region. Maximal tumor vascularization showed a similar distribution, with 54% within the CE region, 32% within the exclusive FLAIR region, and 14% in the radiologic necrosis region. Figure 2 shows an illustrative case of the localization of hypervascularization zones.
Relationship Between Hypoxia and Angiogenesis
Quantitative Analysis
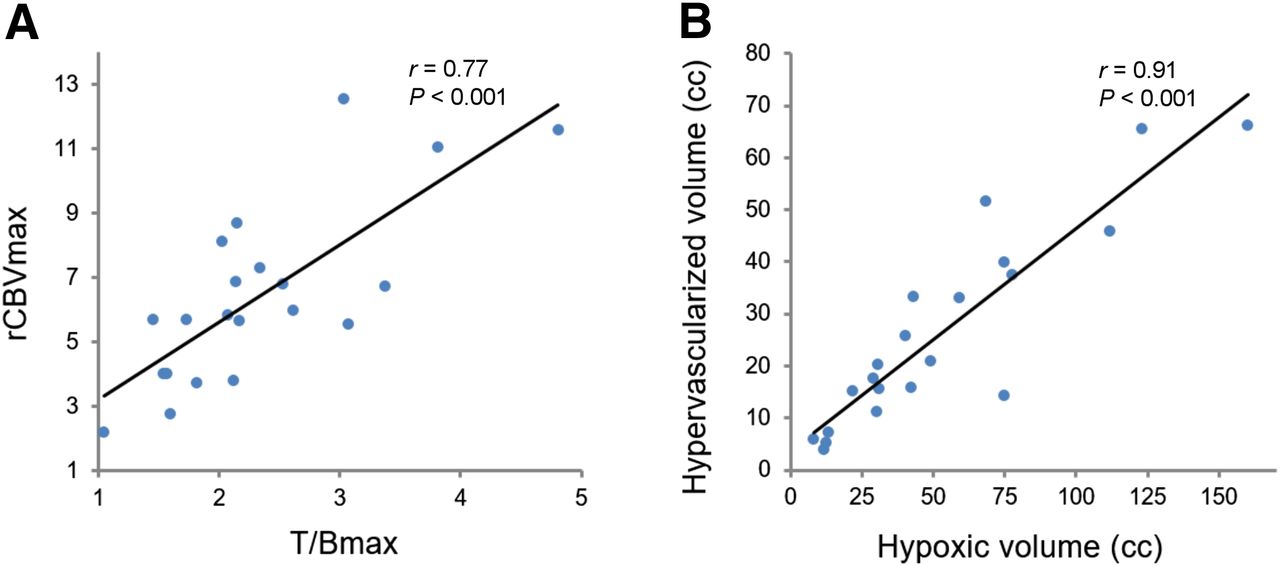
Given the finding that a considerable fraction of 18F-FMISO uptake and high CBV was located outside the CE region, an analysis was performed on the relationships between the degree of hypoxia and vascularization in total tumor regions. The classic tumor volume (CE and radiologic necrosis regions together) was evaluated separately. There was a positive correlation between the maximum values of hypoxia and vascularization within the entire tumor (T/Bmax vs. rCBVmax: r = 0.61, P = 0.002). The correlation was similar when the classic tumor region was assessed (r = 0.77, P < 0.001; Fig. 3 A). There was a positive correlation between T/Bmean and rCBVmean (r = 0.57, P = 0.007) within the hypervascularized tumor volume.

Scatterplot with linear regression lines illustrating relationship between uptake of 18F-FMISO and vascularization. (A) Correlation between maximum values of 18F-FMISO uptake expressed as T/B and rCBV in glioblastomas (classic tumor volume). (B) Relationship between hypoxic tumor volume (18F-FMISO uptake thresholded by contralateral 95 centile) and hypervascularized tumor volume (high CBV thresholded by contralateral 95 centile).
Finally, there was a strong positive correlation between hypoxic tumor volumes and hypervascularized tumor volumes (r = 0.91, P < 0.001; Fig. 3B) and permeable tumor volumes (r = 0.93, P < 0.001). All correlations are shown in Table 1.
Correlation Between Different Imaging Parameters (18F-FMISO PET and MRI)*
Spatial Analysis
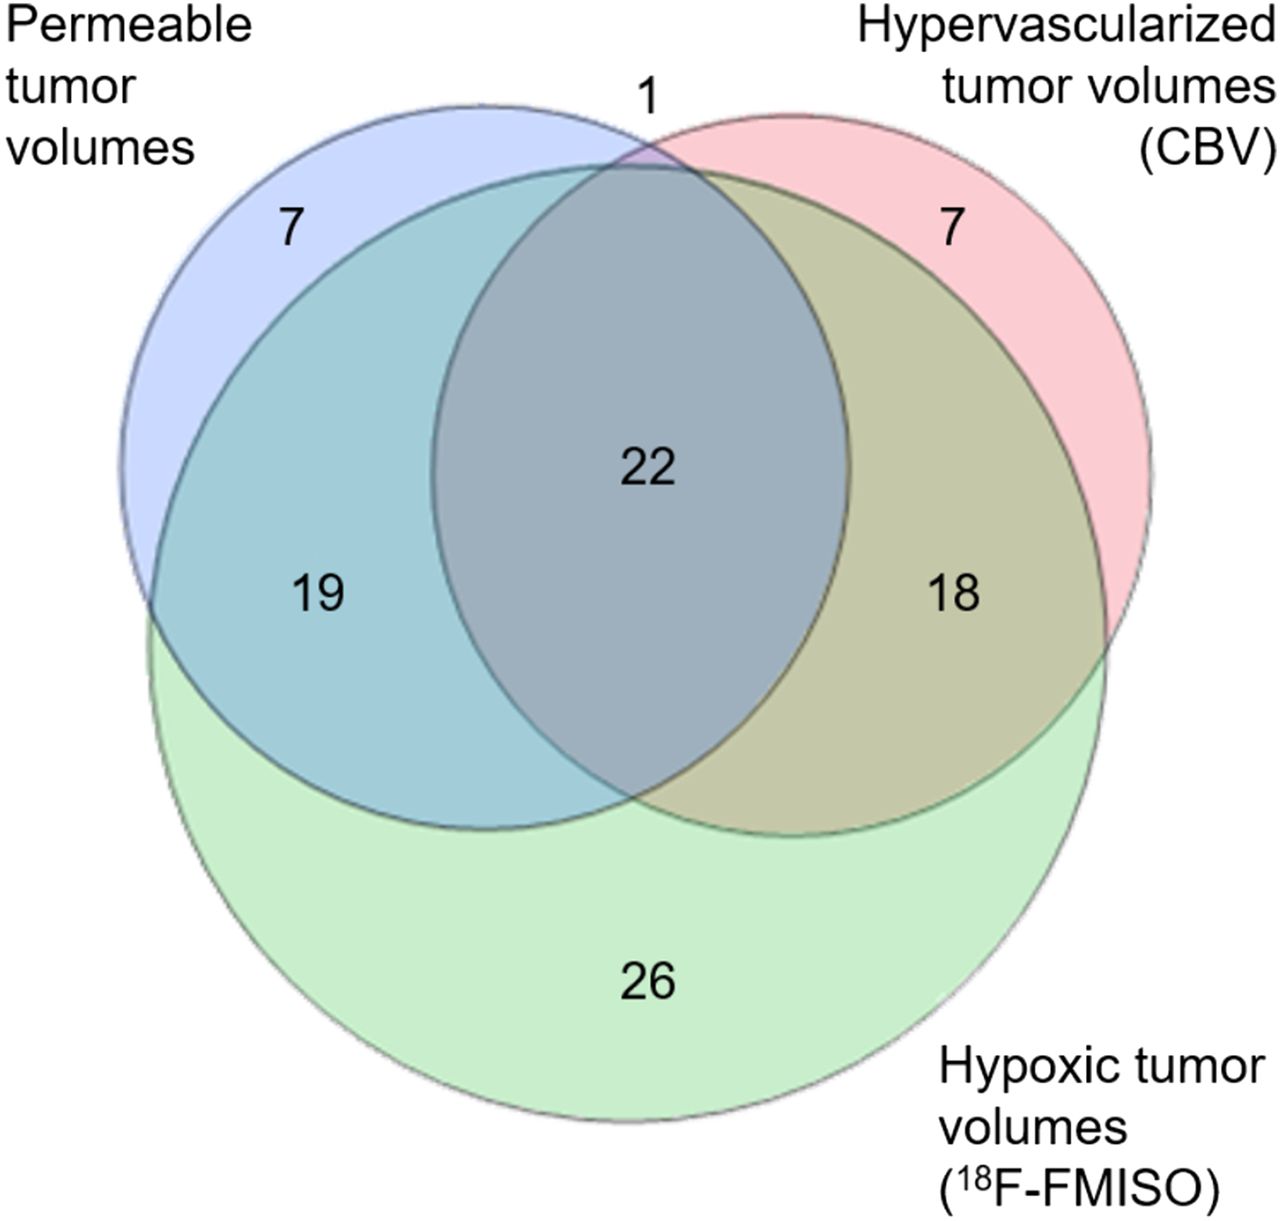
To understand the spatial relationships between hypoxia and angiogenesis, volume overlap analysis was performed, taking into account the size and location of volumes of hypoxia, hypervascularization, and permeability, within each tumor. When hypoxic and hypervascularized tumor volumes were compared, there was a large colocalization, with a mean overlap of 18F-FMISO uptake zone by zone of high CBV of 49%. In other terms, nearly 50% of hypoxic tumor volumes were covered by hypervascularized tumor volumes. Inversely, more than 80% of hypervascularized volumes were covered by hypoxic volumes. Overlap zones were seen to largely encompass the areas of maximal hypoxia, because on average 68% of volumes of maximal tumor hypoxia were covered by hypervascularized volumes. Conversely, only 18% of maximal tumor hypoxia coincides with the volume of maximal vascularization. Table 2 shows the overlap rates between the volumes of tumor hypoxia and hypervascularization, as well as these volumes compared with the permeability volume. Figure 4 illustrates these results using a Venn diagram, which shows the relationship and proportion between the sets of tumor volumes (the area of the circles is proportional to the mean value of the tumor volumes, and the common areas are proportional to the overlap rates between volumes).
Mean Overlap Rate Between Hypoxic, Hypervascularized, and Permeable Tumor Volumes

Venn diagram representing relationship between hypoxic (18F-FMISO uptake), hypervascularized (high CBV), and permeable (CE) tumor volumes of study population. Numbers and colored areas indicate proportions between different volumes and overlap rates (Table 2). There is greater volume of 18F-FMISO uptake, with large overlap with both CBV and permeable tumor volume. There is also overlap between hypervascularized and permeable tumor volumes, corresponding to almost 50% of these volumes.
DISCUSSION
Our study is the first, to our knowledge, to analyze the spatial relationship between 18F-FMISO PET and CBV maps in GBM, before surgery. Moreover, we examine vascularization and hypoxia within the different tumor compartments (i.e., infiltration area, CE, radiologic necrosis) and demonstrate the tight interrelations between hypoxia and angiogenesis in GBM. The analysis of the association between imaging parameters demonstrated a strong positive correlation between tumor vascularization and hypoxia, both in terms of volumes and intensity, particularly for maximum values. This is intriguing when considering that the most vascularized tumors should have the higher oxygen supply and therefore less hypoxia. However, blood vessels in glioblastomas are structurally and functionally abnormal, responsible for an ineffective perfusion and leading to tumor hypoxia (9,14,23,24).
Indeed, the study conducted by Brühlmeier et al. (25) on 11 patients showed 18F-FMISO uptake in both hypo- and hyperperfused tumor regions, suggesting that hypoxia may develop independently of tumor perfusion, estimated by 15O-H2O PET.
A second hypothesis could be that the hypoxic zones might not be located in the same areas as hypervascularization zones, given the intratumoral heterogeneity of glioblastoma. To test this hypothesis, a spatial analysis was conducted on the localization of 18F-FMISO uptake and CBV maps. Our results showed an important overlap between hypervascularization and hypoxic zones.
When the different tumor compartments are analyzed more precisely, some interesting results were also observed. Hypoxia, as assessed by its maximum values (T/Bmax, volume of maximal tumor hypoxia), tends to be greater toward the center of the tumor. A higher proportion of intense hypoxia was observed in the CE region and even in the central radiologic necrosis region, with only a small proportion found beyond the classic tumor region. Conversely, the CBV tends to be higher in the periphery, with a substantial proportion of high CBV values (30% of the volume of maximal tumor vascularization) verified beyond the classic tumor region. This suggests that in the exclusive FLAIR region, angiogenesis is marked by effective tumor vascularity, with less permeability (no CE) and more oxygenation (less 18F-FMISO uptake), possibly evolving secondarily into a typical abnormal vascularization with tumor growth. Hypoxia is known to induce the expression of angiogenic factors, such as vascular endothelial growth factor (VEGF), leading to vascular proliferation to combat the low oxygen availability (8). Our data indicate that while in some regions vascularization is effective for oxygen supply (zones without overlap between hypervascularization and hypoxia), in most of the tumor, angiogenesis is abnormal and insufficient to reverse hypoxia. Histopathologic analysis of GBM often shows immature nonfunctional blood vessels, with regions of arteriovenous shunts and thrombosis (9,14,23,24).
Some practical inferences can be derived from the compartments analysis. First, tumor hypoxia and hypervascularization were more frequent and intense in the CE region (abnormal vascular permeability zone), which strengthens the link between these 2 phenomena. Second, it also confirms that the CE region, which is most frequently the treatment target zone of glioblastomas whether by surgery or radiotherapy, does not represent the only active area of the tumor. Indeed, hypoxia and angiogenesis occur beyond this region, along with well-documented brain tumor invasion. Finally, the presence of 18F-FMISO uptake and hypervascularized zones within the central area of necrosis illustrates the lack of specificity of the radiologic necrosis definition. This area, often heterogeneous, also comprises viable and active cells. Therefore, multimodal imaging could provide a better characterization of the classic macroscopic radiologic necrosis.
In the literature, we found only 4 studies that assessed the relationship between hypoxia and angiogenesis in glioblastomas using in vivo noninvasive imaging techniques. Swanson et al. (12) assessed the relationship between the uptake of 18F-FMISO and CE area (T1G) in 11 patients with GBM. They found a significant correlation only when the surface areas of the hypoxic volume and the CE volume were compared.
In another study, Cher et al. (26) studied the link between the uptake of 18F-FMISO with the uptake of 18F-FDG and molecular markers of hypoxia and angiogenesis in 15 patients with glioma (7 GBM). These authors were able to demonstrate a significant correlation between hypoxia in PET imaging and the expression of VEGF receptor 1, but not with that of VEGF. However, later Kawai et al. (27) demonstrated a significant but weak correlation between the expression of VEGF and the 18F-FMISO uptake in newly diagnosed high-grade glioma, including 18 glioblastomas.
Recently, Gerstner et al. (17) conducted a multicenter study to determine the prognostic value of the 18F-FMISO PET and perfusion MRI parameters in patients with newly diagnosed GBM. In a secondary analysis, they explored the correlation between vascular parameters in MRI and the 18F-FMISO PET uptake in 42 GBM patients. There was a positive correlation between elevated CBF and the hypoxic volume. However, some limitations of this study prevent further analysis. Imaging studies were performed after surgery, thus the numerous postoperative artifacts and smaller tumor volumes, more sensitive to partial-volume effects, may hinder image evaluation. In addition, different PET scanners and MRI machines used in different centers and the dynamic susceptibility contrast MRI analysis limited to the enhancing tumor regions precludes an accurate comparison between the parameters of hypoxia and angiogenesis.
Our study is the only one to date assessing the spatial relationship in vivo between hypoxia and angiogenesis in GBM patients using 18F-FMISO PET and perfusion MRI performed preoperatively. Nevertheless, it has some limitations. The number of patients is still limited, although this is one of the largest series of glioblastomas analyzed by multimodal imaging so far described. Furthermore, it should be noted that our study focused on hypoxia and angiogenesis with their spatial relationship at a given time, but their temporal relationship cannot be determined.
CONCLUSION
This study confirms, in vivo, through noninvasive multimodal imaging, the hypoxic and angiogenic hallmark of human glioblastomas and indicates interdependence between these 2 phenomena. Tumors with higher uptake of 18F-FMISO are generally tumors with higher CBV and volume of CE.
In contrast, tumor hypervascularization as assessed by the CBV on MRI in glioblastomas is not necessarily a source of effective tissue oxygenation and appears instead to be the result of abnormal tumor angiogenesis.
DISCLOSURE
This study was funded by the “Institut National Du Cancer” (INCA). No other potential conflict of interest relevant to this article was reported.
Acknowledgments
We thank Sarah Kabani for editing the manuscript.
Footnotes
Published online Jun. 8, 2017.
- © 2017 by the Society of Nuclear Medicine and Molecular Imaging.
REFERENCES
- Received for publication January 12, 2017.
- Accepted for publication March 22, 2017.


Jump to section
Related Articles
Cited By...
- Simultaneous Mapping of Vasculature, Hypoxia, and Proliferation Using Dynamic Susceptibility Contrast MRI, 18F-FMISO PET, and 18F-FLT PET in Relation to Contrast Enhancement in Newly Diagnosed Glioblastoma
- Monitoring Oxygenation Levels Deep in the Tumor Core: Noninvasive Imaging of Hypoxia, Now in Real-Time 3D
- Association between Tumor Acidity and Hypervascularity in Human Gliomas Using pH-Weighted Amine Chemical Exchange Saturation Transfer Echo-Planar Imaging and Dynamic Susceptibility Contrast Perfusion MRI at 3T