


Abstract
Neocortical atrophy reduces PET signal intensity, potentially affecting the diagnostic efficacy of β-amyloid (Aβ) brain PET imaging. This study investigated whether partial-volume effect correction (PVEC), adjusting for this atrophy bias, improves the accuracy of 18F-florbetaben Aβ PET. Methods: We analyzed 18F-florbetaben PET and MRI data obtained from 3 cohorts. The first was 10 patients with probable Alzheimer disease (AD) and 10 age-matched healthy controls (HCs), the second was 31 subjects who underwent in vivo imaging and postmortem histopathology for Aβ plaques, and the third was 5 subjects who underwent PET and MRI at baseline and 1 y later. The imaging data were coregistered and segmented. PVEC was performed using the voxel-based modified Müller-Gärtner method (PVELab, SPM8). From the PET data, regional and composite SUV ratios (SUVRs) with and without PVEC were obtained. In the MRI data, mesial temporal lobe atrophy was determined by the Scheltens mesial temporal atrophy scale and gray matter volumes by voxel-based morphometry. Results: In cohort 1, PVEC increased the effect on AD-versus-HC discrimination from a Cohen d value of 1.68 to 2.0 for composite SUVRs and from 0.04 to 1.04 for mesial temporal cortex SUVRs. The PVEC-related increase in mesial temporal cortex SUVR correlated with the Scheltens score (r = 0.84, P < 0.001), and that of composite SUVR correlated with the composite gray matter volume (r = −0.75, P < 0.001). In cohort 2, PVEC increased the correlation coefficient between mesial temporal cortex SUVR and histopathology score for Aβ plaque load from 0.28 (P = 0.09) to 0.37 (P = 0.03). In cohort 3, PVEC did not affect the composite SUVR dynamics over time for the Aβ-negative subject. This finding was in contrast to the 4 Aβ-positive subjects, in 2 of whom PVEC changed the composite SUVR dynamics. Conclusion: The influence of PVEC on 18F-florbetaben PET data is associated with the degree of brain atrophy. Thus, PVEC increases the ability of 18F-florbetaben PET to discriminate between AD patients and HCs, to detect Aβ plaques in the atrophic mesial temporal cortex, and potentially to evaluate changes in brain Aβ load over time. As such, the use of PVEC should be considered for quantitative 18F-florbetaben PET scans, especially in assessing patients with brain atrophy.
The relatively low spatial resolution of PET may result in partial-volume effects (PVEs), particularly in small, irregularly shaped brain structures such as the cortical gray matter, which may have a thickness of up to only 4 mm. Although PET imaging accurately measures tracer concentration, the PVE distorts the true signal and degrades quantitative accuracy. PVE refers to 2 technical restrictions in PET imaging. The first is the discrete sampling resolution of the image, which causes a 3-dimensional blurring in the data. The detector design limits the spatial resolution and causes a small source to spill out into a larger, less intense signal. The second is that the limited sampled-image voxel size causes multiple types of tissue to be included within a single voxel (tissue-fraction effect). Although PVE biases every structure, the amount of PVE is object-dependent and certainly affects the regional signal maximum of structures smaller than 2.5 times the full width at half maximum of the PET scanner used (1). There are several methods to account for the first PVE confound (anatomy-based (2,3), deconvolution-based (4), wavelet-based (5,6), reconstruction-based (7)), and the tissue-fraction effect can be addressed by the modified Müller-Gärtner approach (8).
Neurodegenerative disorders, and especially Alzheimer disease (AD), are characterized by progressive brain atrophy in several regions (e.g., mesial temporal cortex (9,10)). The volume of these brain structures, especially gray matter, decreases, and they therefore become more susceptible to PVEs. In the presence of atrophy, the PET measurement of tracer uptake can thus be biased and can diminish (in the case of hot-spot imaging, such as with β-amyloid [Aβ] tracers) or overemphasize (in the case of cold-spot imaging, such as with 18F-FDG) apparent disease patterns. With regard to Aβ PET imaging, a sufficient PVE correction (PVEC) that indeed allows correcting for the effect of brain atrophy should in principle increase diagnostic accuracy.
It was the aim of this study to systematically address this hypothesis. We performed PVEC of Aβ PET data obtained after the administration of 18F-florbetaben, a novel Aβ-targeted PET tracer recently approved for routine clinical use. The effect of PVEC on the diagnostic capability of 18F-florbetaben was assessed in 3 different scenarios. In the first, the effect of PVEC on the ability of 18F-florbetaben PET to differentiate between patients with AD and healthy controls (HCs) was investigated, assuming that a PVEC capable of correcting for atrophy should increase discrimination of this hot-spot tracer between atrophic AD and nonatrophic HC brain. The second scenario investigated the correlation between in vivo regional 18F-florbetaben uptake and postmortem histopathologically determined Aβ plaque load. The region chosen was the mesial temporal cortex, as it is most severely affected by atrophy in AD (9,10). We hypothesized that PVEC of the PET images would increase the correlation between tracer uptake and Aβ plaque load. The third scenario explored the effect of PVEC on intraindividual changes in tracer uptake over time, assuming that atrophy progresses in AD brain and that an atrophy-correcting PVEC should allow more accurate evaluation of time-dependent changes in brain Aβ load.
MATERIALS AND METHODS
Study Population
To investigate the effect of PVEC on the diagnostic potential of Aβ PET in the 3 scenarios, the 18F-florbetaben PET datasets of 3 cohorts were analyzed. Cohort 1 was from a phase 0 proof-of-mechanism trial (11) and included 10 patients with probable AD (8 men and 2 women; mean age ± SD, 69 ± 7 y) and 10 age- and sex-matched HCs (8 men and 2 women; mean age, 67 ± 8 y). The PET data of 9 of the AD patients and of 1 of the HCs were visually evaluated as Aβ-positive. Cohort 2 (20 men and 11 women; mean age, 82 ± 9 y) was from a recent multicenter phase 3 trial investigating 18F-florbetaben PET versus postmortem histopathology (12). Cohort 3 was from a single center in the same trial as cohort 2 and included 5 subjects (1 Aβ-negative [an 80-y-old man] and 4 Aβ-positive [2 men and 2 women; mean age, 75 ± 10 y]) for whom baseline and 1-y follow-up scans were available. All these trials were approved by the respective ethics committees and radiation protection authorities. All studies were conducted according to the Declaration of Helsinki, and all subjects signed an informed consent form.
PET Data Acquisition
For cohorts 1 and 3, single-center 18F-florbetaben PET data were obtained using an ECAT Exact HR+ scanner (Siemens Healthcare). For cohort 2, multicenter PET data were acquired on 8 different PET scanners with different full widths at half maximum (Table 1). All PET data were corrected for radioactive decay, dead time, attenuation, and scatter. The PET data frames 70–90 min after injection (13) (for cohort 1) or 90–110 min after injection (for cohorts 2 and 3) were combined and reconstructed by standard algorithms.
Spatial Resolutions of the Different PET Scanners Used on Cohort 2
MRI Data Acquisition and Analysis
For cohort 1, MRI was performed with a 1.5-T Magnetom Symphony scanner (Siemens Healthcare) using a standardized 3-dimensional T1-weighted volumetric magnetization-prepared rapid-acquisition gradient echo sequence with a voxel size of 0.9 × 0.9 × 1.5 mm. On these data, atrophy was assessed using the Scheltens mesial temporal atrophy scale (9). For cohort 2, only 25 of the 31 MRI datasets were of sufficient quality for adequate gray matter segmentation and PVEC. For cohort 3, MRI was performed with a 1.5-T Symphony scanner (Siemens Healthcare) using a T1-weighted 3-dimensional fast low-angle shot sequence with a voxel size of 0.9 × 0.9 × 1.5 mm. To evaluate the degree of mesial temporal lobe atrophy, these data were also scored using the Scheltens scale.
PVEC Method
The PVEC data were processed using a previously described method (14). In short, the MR images were resampled to an isotropic voxel size of 1 mm. Afterward, PVElab, version 2012 (15), and its processing pipeline were used to correct the PET data for PVEs. The PET data were coregistered to the MR data followed by reslicing, segmentation of MR data, MNI-based atlas labeling, and voxelwise PVEC based on a method that combines the PVEC approach of Müller-Gärtner (3) with a modification proposed by Rousset et al. (8), who applied a different way of calculating white matter signals (16): instead of using the mean value of the eroded white matter segmentation, the value was computed after correcting for spill-in and spill-out effects, resulting in a true white matter value. Although assuming homogeneous white matter uptake, the method of Müller-Gärtner corrects for both the loss of gray matter activity (spill-out into non–gray matter) and the gain in gray matter activity (spill-in from white matter). The respective PET scanner full widths at half maximum used to determine the point spread function were based on the National Electrical Manufacturers Association NU 2-2001 standards (Table 1).
PET Data Analysis
PMOD, version 3.4 (PMOD Technologies Ltd.), was used to apply MRI-directed hand-drawn (cohorts 1 and 2) regions of interest (ROIs) or the anatomic automatic-labeling ROI atlas (cohort 3) to obtain regional PVE-corrected SUVs and noncorrected SUVs. For each subject in cohort 1, an experienced brain PET scientist manually defined the following ROIs on 3 adjacent 2.5-mm transverse MRI slices (on both hemispheres when appropriate): frontal cortex, mesial and lateral temporal cortex, parietal cortex, occipital cortex, anterior and posterior cingulate cortex/precuneus, caudate head, putamen, thalamus, pons/midbrain, and white matter (centrum semiovale). In cohort 2, an ROI was defined on the mesial temporal cortex. This ROI was a priori selected for that cohort as it is most severely affected by atrophy in AD.
For SUV interpretation in all 3 cohorts, a gray matter mask was applied that constrained the software to determine tracer uptake for only gray matter. Gray matter probability maps as generated by PVELab were binarized using a standard threshold and logically combined with the ROIs. Regional SUV ratios (SUVRs) were calculated using the cerebellar cortex as reference region (11).
In addition, for cohorts 1 and 3, composite SUVRs were calculated from the mean SUVRs of frontal cortex, lateral temporal cortex, parietal cortex, occipital cortex, and anterior and posterior cingulate cortex (17). The processing pipeline of the data is illustrated in Figure 1.

Workflow chart of processing pipeline. PET and MRI data were provided as input to PVELab. Main output of PVELab was PVE-corrected data, which were masked by corresponding gray matter. PVELab additionally generated gray matter tissue probability map (TPMGM), which was used to mask uncorrected PET data. To interpret gray matter–masked PET data (GM-PET) and PVEC GM-PET data, hand-drawn VOIs were used for cohorts 1 and 2 and anatomic automatic-labeling (AAL) VOIs for cohort 3.
Voxel-Based Morphometry
In cohort 1, a regional voxel-based morphometry analysis was conducted. The gray matter density inside each ROI was determined on the basis of the gray matter probability map generated by PVELab. The ROI-specific gray matter density was then divided by the ROI volume to calculate the relative amount of gray matter. The computation was performed in Matlab, version 7.13 (The MathWorks).
Postmortem Histopathology
In cohort 2, the Aβ plaque load in the hippocampus/parahippocampal gyrus was determined postmortem using standard histopathology methods (12). Sixteen subjects were histopathologically Aβ-positive and 9 Aβ-negative. Aβ plaque load was quantified in a post hoc analysis on a scale from 0 (no Aβ plaques) to 12 (frequent Aβ plaques).
Statistics
Statistical analyses were performed using SPSS, version 20 (IBM Corp.), and Matlab. For group comparisons, the 2-tailed Student t test was used. The effect of PVEC on the ability of SUVR to discriminate between AD patients and HCs was expressed as the Cohen d value (18). The correlation between mesial temporal cortex SUVR and Aβ plaque load was determined using the 1-sided Pearson correlation coefficient. For all tests, significance was assumed at the P < 0.05 level.
RESULTS
Effect on SUVR Discrimination Between AD Patients and HCs
In cohort 1, PVEC had no significant effect on uptake in the reference region: the respective cerebellar SUVs before and after PVEC were 0.53 ± 0.06 and 0.55 ± 0.06 for AD patients (P = 0.998) and 0.53 ± 0.26 and 0.55 ± 0.28 for HCs (P = 0.963). In HCs, PVEC increased the SUVRs by 1.3% ± 7.0% in the right frontal cortex, 0.3% ± 5.6% in the left frontal cortex, 1.3% ± 3.2% in the right mesial temporal cortex, 1.6% ± 3.5% in the left mesial temporal cortex, 4.5% ± 8.6% in the right parietal cortex, and 9.8% ± 6.9% in the left parietal cortex, and the composite SUVR was increased by 5.6% ± 5.8%. In the AD patients, the respective increases were 24.0% ± 14.7%, 26.8% ± 17.4%, 11.8% ± 10.5%, 14.6% ± 12.6%, 22.6% ± 16.0%, 28.7% ± 15.5%, and 22.6% ± 13.1%. Compared with HCs, AD patients had significantly PVEC-related higher SUVR changes in the frontal cortex (right, P = 0.0003; left, P = 0.0002), mesial temporal cortex (right, P = 0.007; left, P = 0.006), and parietal cortex (right, P = 0.006; left, P = 0.002), and the change in composite SUVR was also significantly higher (P = 0.001) (Fig. 2).

PVEC-related changes in differential regional and composite SUVR in AD patients and HCs. Groups were compared using Student t test.
Concerning SUVR discrimination between AD patients and HCs, an increase in statistical significance was observed after PVEC for all ROIs (Table 2). In the mesial temporal cortex, SUVR discrimination reached statistical significance only after PVEC (before: 1.24 ± 0.11 vs. 1.23 ± 0.15, P = 0.92; after: 1.39 ± 0.13 vs. 1.25 ± 0.15, P = 0.03). For all ROIs, PVEC increased the Cohen d value for SUVR discrimination between groups (Table 2).
Influence of PVEC on 18F-Florbetaben SUVR Discrimination Between AD Patients and HCs in Cohort 1
The PVEC-related SUVR changes in the mesial temporal cortex correlated strongly with Scheltens score (r = 0.84, P < 0.001, Fig. 3). Further, the PVEC-related changes in composite SUVR correlated strongly with the composite gray matter volume (r = −0.75, P < 0.0005, Fig. 4). Figure 5 shows 2 paradigmatic cases of AD patients with different degrees of mesial temporal lobe atrophy and associated different degrees of SUVR increase after PVEC.
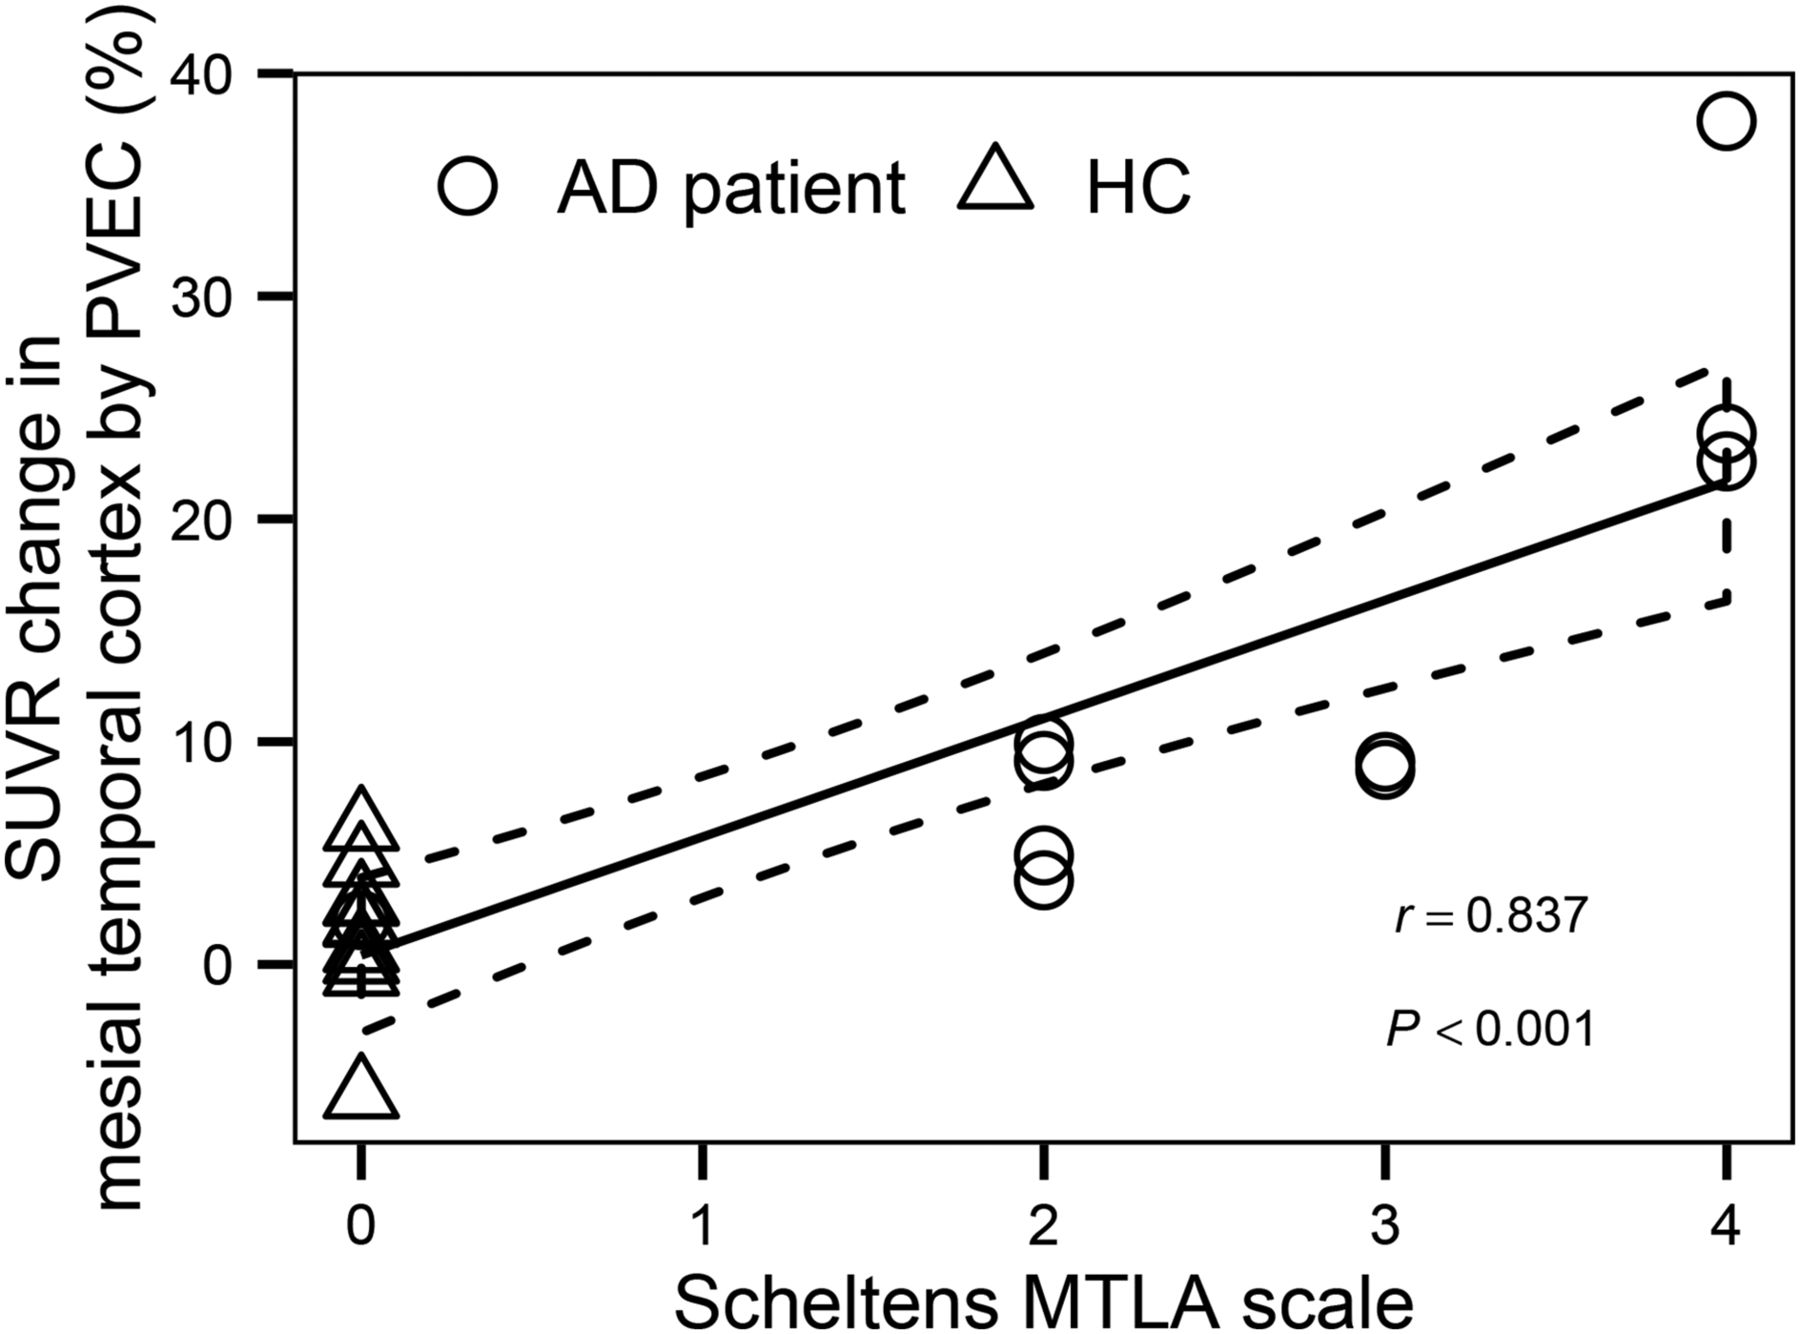
Correlation between PVEC-related SUVR change in mesial temporal cortex (mean of left and right) and degree of mesial temporal lobe atrophy as scored by Scheltens scale.

Correlation between PVEC-related composite SUVR change and relative volume of gray matter in composite regions.

T1-weighted magnetization-prepared rapid-acquisition gradient echo MRI data (left), gray matter–masked 18F-florbetaben PET data (middle), and PVE-corrected gray matter 18F-florbetaben PET data (right) of 2 AD patients with different degrees of mesial temporal lobe atrophy as scored by Scheltens scale. Tracer uptake increase by PVEC was higher in more atrophic brain than in less atrophic brain. GM = gray matter; MTLA = mesial temporal lobe atrophy.
Effect on Correlation Between SUVR and Aβ Plaque Load
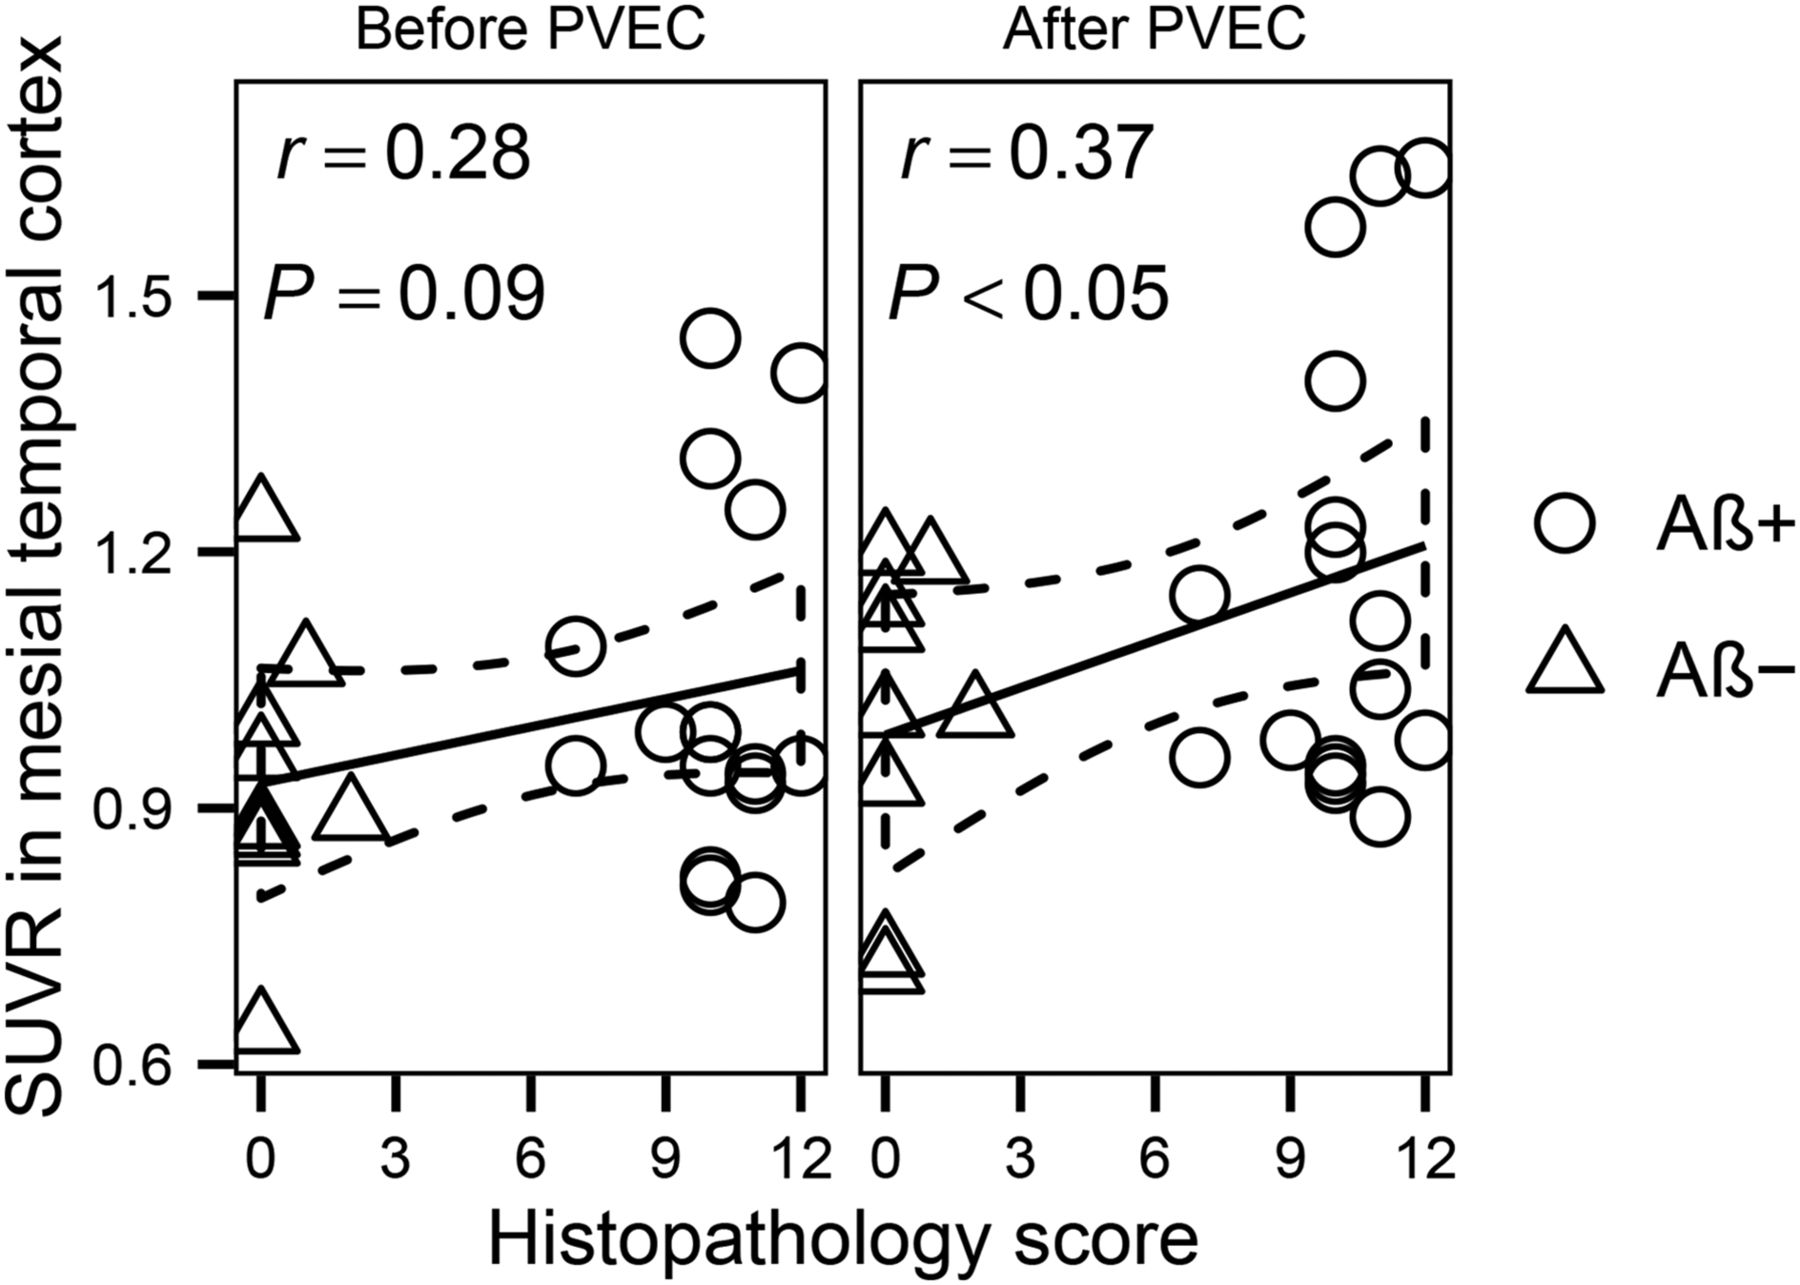
In cohort 2, the correlation between SUVR and histopathologically determined Aβ plaque load in the mesial temporal cortex increased from r = 0.28 to r = 0.37 after PVEC, achieving statistical significance (P = 0.09 and 0.03 before and after PVEC, respectively; Fig. 6). The PVEC-related increase in mesial temporal cortex SUVR was higher in subjects who were Aβ-positive (12% ± 9%) than in those who were Aβ-negative (7% ± 13%). In line with this finding, the Cohen d value for SUVR discrimination between Aβ-positives and Aβ-negatives increased in the mesial temporal cortex from 0.53 before PVEC to 0.66 after PVEC.

Influence of PVEC on correlation between SUVRs in mesial temporal cortex and histopathology score. Aβ− = Aβ-negative; Aβ+ = Aβ-positive.
Effect on Longitudinal SUVR Assessment
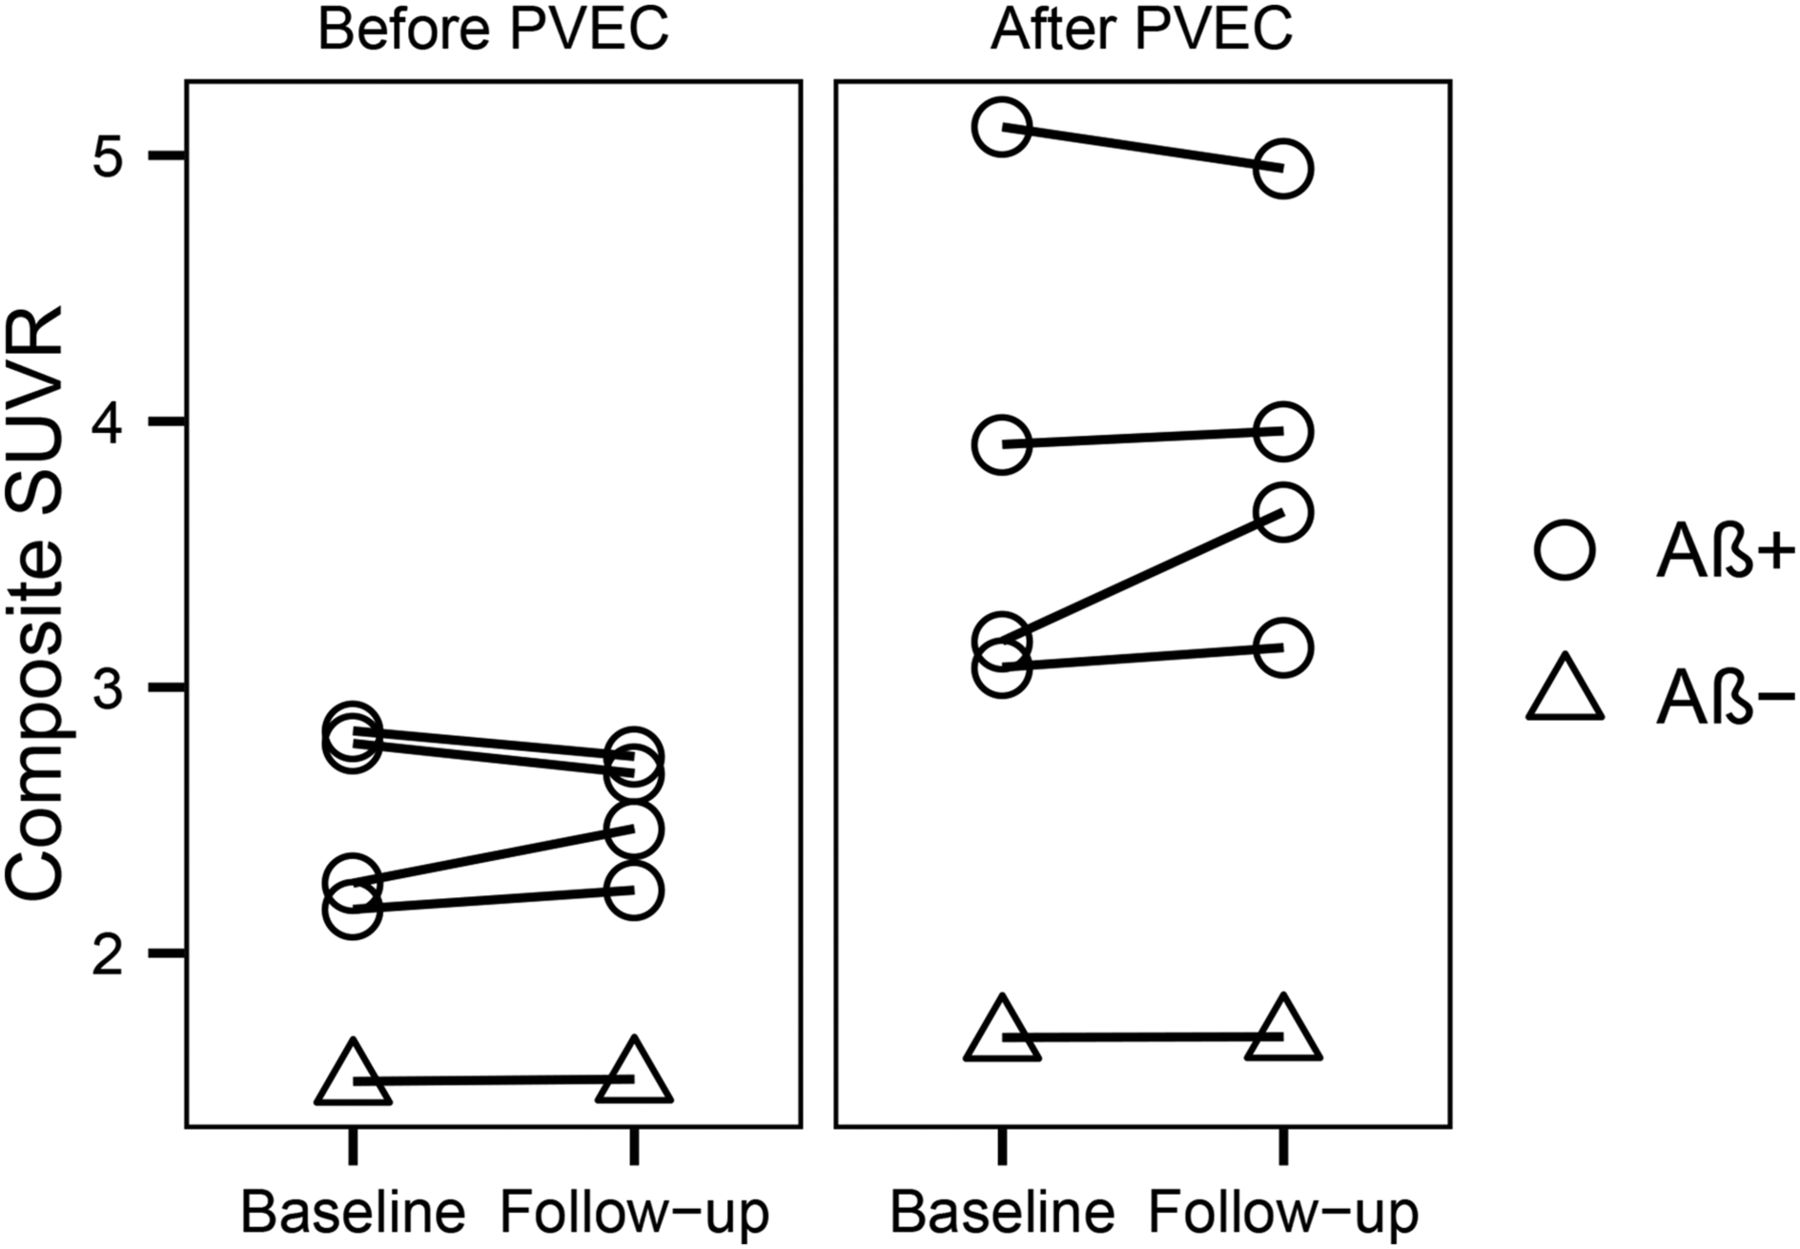
In cohort 3, the Aβ-negative subject showed nearly constant composite SUVRs over time (baseline, 1.52; follow-up, 1.53), with only a minor increase due to PVEC (baseline, 10.9%; follow-up, 10.5%) (Fig. 7). A different pattern was observed for the 4 subjects who were Aβ-positive: two of them showed a decrease in composite SUVR over time without PVEC (−4.0% and −3.4%), but PVEC converted this decrease into an increase for one of them (+1.3%). The other two already showed—without PVEC—an increase in composite SUVR over time (+9.1% and +3.3%), and PVEC enhanced this increase for one of them (+15.3%) (Fig. 7). That subject was the only one whose Scheltens score increased over time (from 3 to 4); the other subjects had a constant degree of mesial temporal lobe atrophy (mean change in composite SUVR over time, 0.2% ± 2.4%).

Influence of PVEC on composite SUVRs over time. Aβ− = Aβ-negative; Aβ+ = Aβ-positive.
DISCUSSION
We found that PVEC of 18F-florbetaben PET data can improve discrimination between AD patients and HCs, detection of Aβ plaques in the most atrophic mesial temporal lobes, and, potentially, evaluation of changes in brain Aβ load over time.
Little is known yet about the impact of PVEC on the diagnostic power of human Aβ imaging. In work by Drzezga et al. on 11C-Pittsburgh compound B, PVEC had no relevant impact on the apolipoprotein E4 effect in AD patients (19). More recently, Su et al. applied PVEC to simulated and human 11C-Pittsburgh compound B data and demonstrated that PVEC might improve the detection of subtle changes in Aβ binding over time (20). Thomas et al. used different PVEC approaches on 18F-flutemetamol PET data; in accordance with our results and depending on the brain region investigated, the modified Müller-Gärtner method yielded different SUVR results in different cohorts (21). Because the effect of PVEC on the ability to discriminate between AD patients and HCs (Cohen d) was not reported by the authors, it is difficult to compare their results with ours. Also, Thomas et al. did not study the relationship between brain atrophy and the degree of PVEC, or the influence of PVEC on the correlation between PET and histopathologically determined postmortem Aβ plaque load—relationships that have been studied for, what is to our knowledge, the first time in the present study.
As recently discussed for tau PET imaging (22), one needs to remember that currently available PVEC methods such as the modified Müller-Gärtner approach have been applied to correct brain 18F-FDG PET data, that is, PET data in which uptake in gray matter exceeds that in white matter, mainly requiring correction of spill-out from gray matter into white matter and cerebrospinal fluid. The behavior of Aβ tracers, similar to tau tracers, is opposite that of 18F-FDG. However, we decided in this project to investigate the potential of PVEC in Aβ imaging more on a practical basis. We assumed that if PVEC were indeed able to correct the 18F-florbetaben PET data for atrophy, the diagnostic power of this hot-spot tracer would increase.
Three scenarios were investigated. First, we studied the influence of PVEC on the ability of 18F-florbetaben PET to discriminate between AD patients and HCs and the association between the degree of PVEC correction and the degree of brain atrophy. The basic assumption was that PVEC should benefit tracer uptake in only the atrophic neocortex of the AD patients—not the nonatrophic neocortex of the HCs or the nonatrophic cerebellar reference region of either group—leading to PVEC-related higher SUVRs in AD patients but not in HCs and thus increasing discrimination between groups. In keeping with this hypothesis, we observed no effect of PVEC on cerebellar uptake in either group, and in the HCs there was a PVEC-related regional SUVR increase of up to only 10% (6% for composite SUVRs). In contrast, in the AD patients, PVEC increased regional SUVRs by up to 29% (23% for composite SUVRs). Of interest, the difference in mesial temporal cortex SUVRs between AD patients and HCs was significant only after PVEC. In this vulnerable (with regard to atrophy) brain region, the PVEC-related change in individual SUVRs correlated strongly with the individual Scheltens scores. The same was seen for the PVEC-related composite SUVR change and the composite gray matter volume as determined by voxel-based morphometry. Both analyses indicate that a threshold effect can be assumed in that—up to a certain grade of brain atrophy—PVEC would have little to no effect on the PET data. More research is needed to define such atrophy thresholds. However, we consider these correlations to be supportive of the assumption that the PVEC method was indeed able to correct the PET data for atrophy.
In a second scenario, we analyzed data from the 18F-florbetaben PET–versus–postmortem histopathology trial (12) to focus on whether PVEC improves the detection of Aβ plaques. Again, the mesial temporal cortex was chosen as the most challenging region because it has the most advanced atrophy, bearing in mind the challenge of segmenting the thin gray matter in this area. A further challenge in this scenario was the advanced brain atrophy in many of the patients, who were investigated during the end-of-life stage, as well as the fact that this was a multicenter study. However, the correlation between SUVR and Aβ plaque histopathology score was increased by PVEC, achieving significance only after PVEC (P = 0.03).
In a third scenario, we investigated whether PVEC has an influence on follow-up 18F-florbetaben PET data. This is a topic of primary interest as—according to current common sense—Aβ load is thought to have plateaued at the classic AD dementia stage (23). However, so far, most Aβ PET evidence of that plateau has been provided by data analyses that do not consider atrophy progression (and counteraction against the PET signal). Thus, we speculate that once the PET data are corrected for atrophy, differential features will be observable apart from a stable, plateaulike follow-up situation, at least in some AD patients. In good accordance with this hypothesis, and despite the limited sample size thus far available for studying this question, we observed PVEC-related increases in composite SUVRs over time in several subjects initially evaluated as Aβ-positive, but not in Aβ-negative subjects. The findings in our small sample seem to be in line with the longitudinal data of Brendel et al. (24), who found the largest PVEC-related SUVR increases over time in Aβ-positive subjects. More work is required to clarify whether brain Aβ load indeed plateaus in AD dementia (25), a question to which new answers might arise from the future application of PVEC to longitudinal Aβ PET data. Further evaluation of the potential benefit of PVEC in clinical practice requires a comparison with visual assessment, continued validation of software, and broader availability.
CONCLUSION
The influence of PVEC on 18F-florbetaben PET data is associated with the degree of brain atrophy. Consequently, PVEC increases the power of 18F-florbetaben PET to discriminate between AD patients and HCs, to detect Aβ plaques in atrophic mesial temporal cortex, and potentially to evaluate changes in brain Aβ load over time. As such, future implementation of PVEC in clinical routine and in research on Aβ PET imaging should be considered, especially in patients with brain atrophy.
DISCLOSURE
The costs of publication of this article were defrayed in part by the payment of page charges. Therefore, and solely to indicate this fact, this article is hereby marked “advertisement” in accordance with 18 USC section 1734. The image data were from trials sponsored by Bayer Healthcare (Berlin, Germany) and Piramal Imaging (Berlin, Germany). This work was supported by Piramal Imaging (Berlin, Germany). Michael Rullmann received support for travel expenses from Piramal Imaging. Osama Sabri and Henryk Barthel received research support and speaker and consultant honoraria from Piramal Imaging. Matthias L. Schroeter is supported by the German Federal Ministry of Education and Research (BMBF) (grant FKZ 01GI1007A, German FTLD consortium), by the Parkinson’s Disease Foundation (grant PDF-IRG-1307), and as a MaxNetAging Fellow of the Max Planck Society. No other potential conflict of interest relevant to this article was reported.
Acknowledgments
We thank all phase 0 and 3 18F-florbetaben study participants, their relatives, and their caregivers for supporting this investigation. We also thank the cyclotron team, radiopharmacy team, and PET team at the Leipzig University Department of Nuclear Medicine for their skillful support with PET data acquisition.
Footnotes
Published online Nov. 5, 2015.
- © 2016 by the Society of Nuclear Medicine and Molecular Imaging, Inc.
REFERENCES
- Received for publication June 5, 2015.
- Accepted for publication October 21, 2015.


Jump to section
Related Articles
Cited By...
- Traumatic brain injury and Alzheimers Disease biomarkers: A systematic review of findings from amyloid and tau positron emission tomography (PET)
- Reshaping the Amyloid Buildup Curve in Alzheimer Disease? Partial-Volume Effect Correction of Longitudinal Amyloid PET Data
- Optimal Reference Region to Measure Longitudinal Amyloid-{beta} Change with 18F-Florbetaben PET