


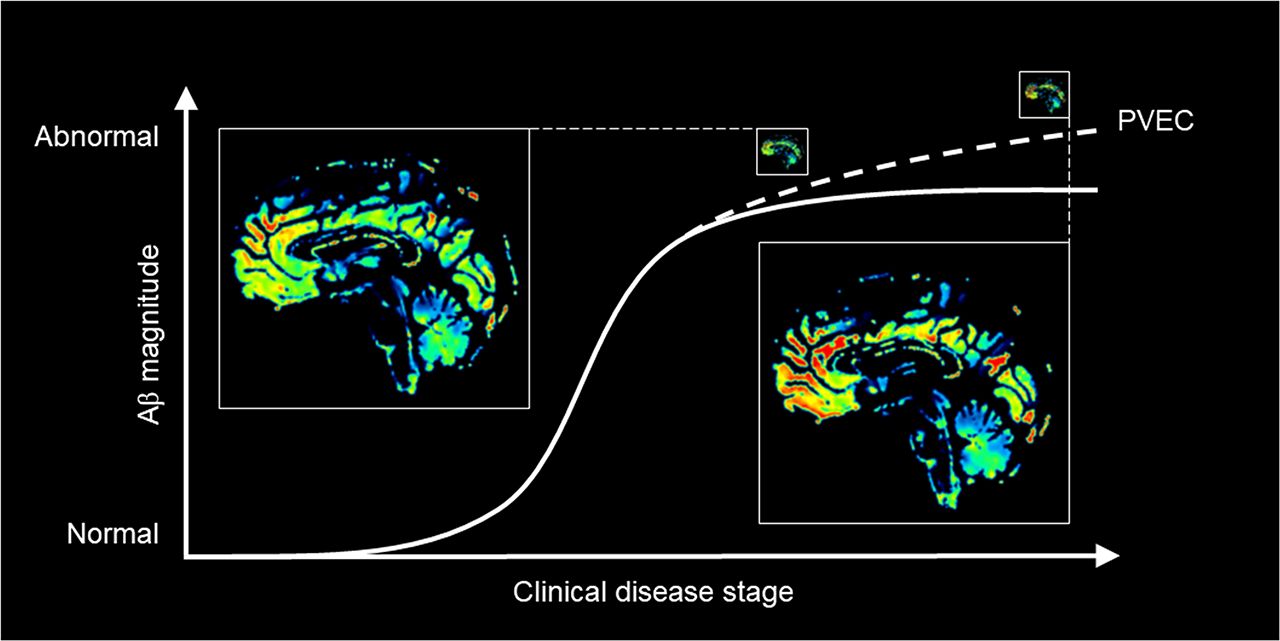
Visual Abstract
Abstract
It was hypothesized that the brain β-amyloid buildup curve plateaus at an early symptomatic stage of Alzheimer disease (AD). Atrophy-related partial-volume effects (PVEs) degrade signal in hot-spot imaging techniques such as amyloid PET. The current study, a longitudinal analysis of amyloid-sensitive PET data, investigated the effect on the shape of the β-amyloid curve in AD when PVE correction (PVEC) is applied. Methods: We analyzed baseline and 2-y follow-up data for 216 symptomatic individuals on the AD continuum (positive amyloid status) enrolled in the Alzheimer’s Disease Neuroimaging Initiative (17 with AD dementia and 199 with mild cognitive impairment), including 18F-florbetapir PET, MRI, and Mini Mental State Examination scores. For PVEC, the modified Müller–Gärtner method was performed. Results: Compared with non–PVE-corrected data, PVE-corrected data yielded significantly higher changes in regional and composite SUV ratio (SUVR) over time (P = 0.0002 for composite SUVRs). Longitudinal SUVR changes in relation to Mini Mental State Examination decreases showed a significantly higher slope for the regression line in the PVE-corrected than in the non–PVE-corrected PET data (F1 = 7.1, P = 0.008). Conclusion: These PVEC results indicate that the β-amyloid buildup curve does not plateau at an early symptomatic disease stage. A further evaluation of the impact of PVEC on the in vivo characterization of time-dependent AD pathology, including the reliable assessment and comparison of other amyloid tracers, is warranted.
The amyloid cascade theory of Alzheimer disease (AD) (1) assumes that brain β-amyloid aggregation is an early, possibly causative, event that triggers neurodegenerative processes, such as tau accumulation, synaptic dysfunction, and atrophy, leading to the distinct dementia phenotype. Currently, it is hypothesized that the cerebral β-amyloid buildup already plateaus at an early disease stage at which tau accumulation and neurodegeneration still accelerate and the first cognitive symptoms occur (2). Postmortem studies have failed to demonstrate a stringent relationship between severity of cognitive impairment and density of amyloid plaques (3). Evidence that the β-amyloid buildup curve in AD reaches a plateau at an early symptomatic disease stage was provided by cross-sectional (4) and longitudinal (5,6) analysis of β-amyloid PET data. However, these studies did not account for atrophy-related partial-volume effects (PVEs), which have recently been identified as a major signal confounder in hot-spot imaging techniques such as β-amyloid PET (7). PVE correction (PVEC) compensates for these resolution-induced inaccuracies, improving quantitative accuracy (8–11) and enabling better discrimination between patients with cognitive impairment and healthy controls (10–13). Assessing cognition, disease stage, and longitudinal 18F-florbetapir PET imaging, we investigated whether a plateau-shaped β-amyloid build-up curve also holds when appropriate PVEC methods are applied to the PET data.
MATERIALS AND METHODS
Using data from the Alzheimer’s Disease Neuroimaging Initiative (ADNI) database, we extracted all available 18F-florbetapir amyloid PET datasets from participants meeting each of 4 criteria: a diagnosis of AD dementia or mild cognitive impairment (MCI), at least 2 PET scans, corresponding MR scans for each PET scan within ±50 d, and corresponding Mini Mental State Examination (MMSE) (14) scores for each scan. These criteria were fulfilled by 312 patients (22 with AD and 290 with MCI). We also extracted the corresponding cerebrospinal fluid levels of β-amyloid peptide 1–42, if available, from the ADNI database. The study was approved by the ADNI, which obtained written informed consent from all subjects.
PVEC was performed as previously described (10). In short, the MR data were resliced to a 1-mm isotropic voxel size. PVElab (15), which requires full-width-at-half-maximum specifications for the applied PET scanner, was used to correct the PET data PVEs. This process included coregistration of MR and PET data, reslicing of PET data to MR space, segmentation of MR data, Montreal Neurological Institute–based labeling, and voxelwise PVEC using the modified Müller–Gärtner approach (16,17). PVElab automatically computed the mean activity concentrations for the following atlas regions: hippocampus (left and right), anterior and posterior cingulate cortex, deep gray matter, occipital cortex, frontal cortex (left and right), temporal cortex (left and right), parietal cortex (left and right), Brodmann area 9 (left and right), cerebellar cortex, white matter, and cerebrospinal fluid. Regional SUV ratios (SUVRs) were computed using the cerebellar cortex as the reference region (18). In addition, we calculated a composite SUVR for the volume-weighted means from the frontal cortex, parietal cortex, occipital cortex, temporal cortex, and anterior and posterior cingulate cortex (19). We validated the applied PVEC pipeline using an alternative PVEC known as region-based voxelwise (RBV) correction (8).
To limit our analysis to cases on the AD continuum, we applied a threshold of 1.1 for the uncorrected composite SUVR to include only amyloid-positive subjects (64 were excluded) (20). We excluded data lacking the transaxial and axial full-width-at-half-maximum specifications, as outlined by the National Electrical Manufacturers Association, for the respective PET scanners (required for correct PVEC; 18 were excluded). Further, PVEC outliers (PVE-corrected composite SUVR < [mean − 2 SDs] or > [mean + 2 SDs]) were excluded (14 were excluded). The final sample of the presented analysis included data from 216 participants comprising 17 with AD dementia and 199 with MCI.
Statistical analyses were performed in Matlab (MathWorks). We applied paired t tests to evaluate difference scores for SUVR change over time between PET data with and without PVEC. Regression analysis of composite SUVRs and their corresponding MMSE scores, as well as cerebrospinal fluid biomarker levels, included a comparison of β-coefficients between the PET data with and without PVEC. The relationship between SUVR changes over time and baseline MMSE scores was evaluated using a linear regression model (dependent variable: extracted SUVR changes; independent variable: baseline MMSE scores) in which the slope coefficient significance was tested using the 1-sided t test, representing the biologically reasonable association. For all tests, significance was assumed for a P value of less than 0.05.
Data used in the preparation of this article were obtained from the ADNI database. Up-to-date information can be found at http://www.adni-info.org.
RESULTS
The AD and MCI individuals did not differ regarding longitudinal imaging time points or demographic data, apart from age (P = 0.03) and the MMSE score at baseline (P < 0.0001, Table 1).
Demographics of Study Cohort
Figure 1 shows the baseline and 2-y follow-up MR data, as well as the gray matter–masked amyloid PET data with and without PVEC, together with illustrations of the respective relative SUVR changes over time in a paradigmatic AD patient whose MMSE score deteriorated from 25 to 21. In this patient, SUVR increases were more pronounced in the PVE-corrected PET data than in the uncorrected data.
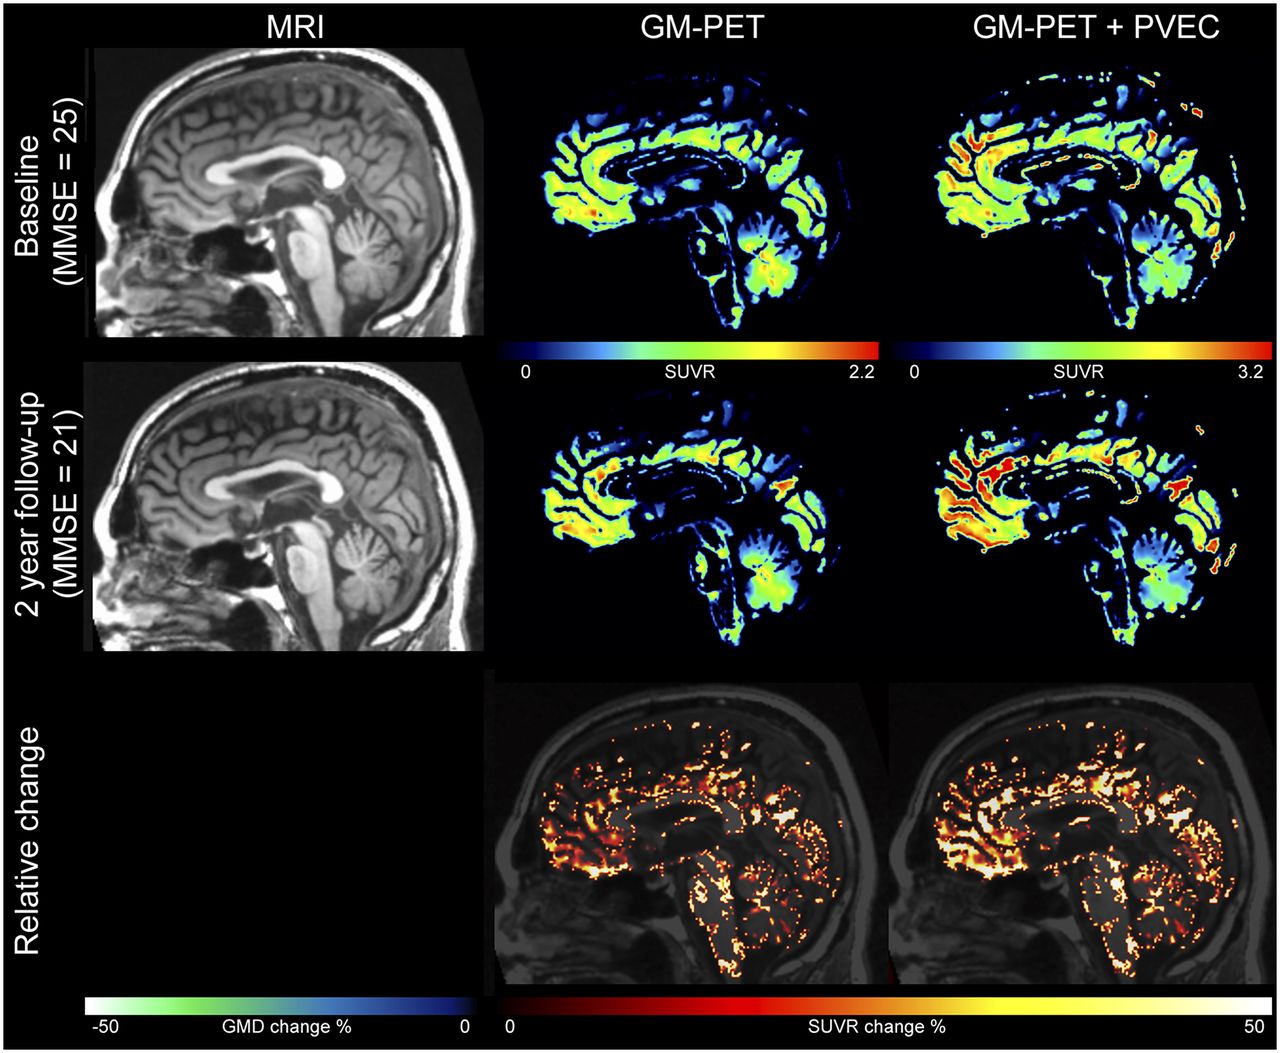
Example of amyloid PET/MR data with and without PVEC over time. Shown are baseline and 2-y follow-up MRI and gray matter (GM)–masked 18F-florbetapir PET data without and with PVEC for an Alzheimer dementia patient. Relative SUVR increase over time was higher with than without PVEC. GMD = gray matter density.
Overall, the PVE-corrected PET data revealed significantly higher SUVR changes over time than did the uncorrected PET data in the composite region (P = 0.0002), as well as in the left hippocampus (P = 0.03), anterior cingulate cortex (P = 0.001), occipital cortex (P = 0.02), left and right frontal cortex (P = 0.00004 and 0.000002, respectively), left and right temporal cortex (P = 0.0005 and 0.0008, respectively), left and right parietal cortex (P = 0.0007 and 0.002, respectively), and left and right Brodmann area 9 (P = 0.0003 and 0.00002, respectively) (Table 2; Supplemental Fig. 1 [supplemental materials are available at http://jnm.snmjournals.org]). Thereby, the Cohen d effect seemed to be higher in AD patients than in MCI patients (e.g., in the composite region, the Cohen d effect was 0.57 and 0.19, respectively; Supplemental Table 1).
Influence of PVEC on SUVR Changes over Time
The linear regressions between time-dependent composite SUVRs and time-dependent MMSE scores with and without PVEC are shown in Figure 2. The slope for the PVE-corrected PET data was significantly steeper than that for the uncorrected data (F1 = 7.1, P = 0.008). Significantly steeper slopes were also found for PVE-corrected PET data in the linear regressions between baseline composite SUVRs and cerebrospinal fluid levels of β-amyloid (F1 = 16.2, P = 7.7 × 10⁻⁵).

Effect of PVEC on correlation of MMSE and amyloid PET. Shown is regression analysis of baseline–to–follow-up composite SUVRs vs. baseline–to–follow-up MMSE scores for amyloid PET data with vs. without PVEC. Slope is significantly steeper for PVE-corrected data (F1 = 7.1, P = 0.008). Only data with baseline MMSE scores < 28 were included in this analysis.
Further, only PVE-corrected composite SUVR changes correlated significantly, albeit weakly, with baseline MMSE scores (PVE-corrected: r = −0.11, P = 0.049; uncorrected: r = −0.07, P = 0.16).
We validated the applied PVEC pipeline using the alternative RBV PVEC (8). For that purpose, we used the inverse of the spatial transformation to transfer the Hammers atlas (21–23) to the individual space. We then used the individual gray and white matter segmentation to mask the Hammers atlas. The masked atlas, PET data, and full-width-at-half-maximum parameter of the corresponding PET scanner were used as input to calculate RBV PVEC images using the PETPVC toolbox (24).
Overall, the RBV PVE-corrected PET data revealed significantly higher SUVR changes over time than did the uncorrected PET data in the composite region (P = 4.1 × 10⁻⁸), anterior cingulate cortex (P = 9.8 × 10⁻⁹), posterior cingulate cortex (P = 1.7 × 10⁻¹³), occipital cortex (P = 6.4 × 10⁻⁹), frontal cortex (P = 1.7 × 10⁻⁵), temporal cortex (P = 5.6 × 10⁻⁹), and parietal cortex (P = 1.1 × 10⁻⁶).
The slope of linear regressions between time-dependent composite SUVRs and time-dependent MMSE scores for the RBV PVE-corrected PET data was significantly steeper than that for the uncorrected data (F1 = 4.44, P = 0.035). Although we observed significant correlations between both RBV PVE-corrected and uncorrected PET data and the cerebrospinal fluid levels of β-amyloid, there were no significant differences in slopes.
Further, only RBV PVE-corrected composite SUVR changes correlated significantly with baseline MMSE scores (2-sided t test, RBV PVE-corrected: r = −0.13, P = 0.02; uncorrected: r = −0.10, P = 0.06).
DISCUSSION
In the present report, the effect of PVEC on longitudinal 18F-florbetapir amyloid PET data and its association with cognitive impairment were evaluated. Over time, PVE-corrected PET data, compared with uncorrected data, showed significantly higher regional and composite SUVR changes. Further, with advancing cognitive impairment, a longitudinal β-amyloid buildup dynamic can be visualized by applying PVEC.
In agreement, several papers have consistently found that PVE-uncorrected β-amyloid PET data lead to quantitative underestimation (6,9,10). In principle, Gonzalez-Escamilla et al. also supported the notion of a PVEC-associated SUVR increase, but only in high-amyloid cases (11).
No consensus on whether PVEC is imperative has been reached yet. Its implementation in AD research has been recommended because it improves clinical classification performance (25) and optimizes the longitudinal measure of β-amyloid (26). However, Schwarz et al., for example, illustrated that imprecision in β-amyloid load measurements due to PET/MR rigid registration is larger when PVEC is applied (27).
In a 11C-Pittsburgh compound B PET study, Villemagne et al. reported on small, significant increases in tracer uptake over a 20-mo period for MCI and AD groups after applying PVEC (6). Brendel et al. substantiated the PVEC-associated improved discriminatory power effect in a large-scale, longitudinal 18F-florbetapir PET study of 962 individuals (13).
Given that the amyloid deposition potentially follows a sigmoid trajectory as a function of time (2), our description of a continuous increase in early symptomatic AD cases challenges the concept that β-amyloid reaches a plateau at a much earlier stage of the disease. Notably, Villemagne et al. performed the same analysis on the data with and without PVEC (modified Müller–Gärtner) and stated that the results did not significantly differ (6). This discrepancy from our present findings may relate to the use of different tracers and to differences in their uptake in white matter (28).
In assessing cognition, it is currently understood that β-amyloid deposition is associated with cognitive dysfunction in the early stages of decline but is essentially decoupled from AD progression at later disease stages (29,30). In fact, at moderate and later stages of disease, advancing cognitive impairment appears to be more closely linked to glucose hypometabolism (31) and tau pathophysiology (32). Yet, using longitudinal 18F-florbetapir PET data and applying the modified Müller–Gärtner PVEC method, we found that cortical amyloid load continued to increase in parallel with cognitive impairment in the symptomatic stages of AD. The slope for the association between longitudinal tracer uptake and declining cognitive performance was significantly steeper for PVE-corrected PET data than for uncorrected data. Thus, when more appropriate methods for amyloid PET tracer quantification are used, there is little evidence to suggest that the β-amyloid buildup does plateau at an early disease stage. Further, only after PVEC did we find that composite SUVR changes correlated negatively with baseline MMSE scores. However, our findings are somewhat at odds with previous results indicating an inverse, positive relationship; that is, a greater increase in tracer uptake was reported in clinically milder AD patients (6) than in patients at later stages of the disease.
In analyzing cortical versus subcortical 18F-florbetapir PET tracer uptake, Cho et al. described a downward spreading pattern of β-amyloid, with initial accumulation in the neocortex being followed by accumulation in the subcortical structures (34). Hereby, subcortical involvement at later stages of the disease, compared with cortex-only involvement (33), implied worse cognitive function and a steeper decline during follow-up (34). However, no PVEC was performed in this study, as opposed to further research directed at characterizing regionally more comprehensive in vivo staging schemes for progressive cerebral amyloid deposition (35).
A limitation of our analysis is that only a single particular PVEC method (modified Müller–Gärtner) was performed. This 3-compartment technique explicitly corrects for both cerebrospinal fluid spill-out and spill-in of high-intensity white matter signal and is thus a much more appropriate approach for correcting typical PVEs in amyloid PET data than is the 2-compartment alternative represented by the widely used Meltzer method (36,37). However, several other PVEC techniques for amyloid imaging have been described (38), but a clinical consensus on the use, and exact implementation, of PVEC for amyloid PET is yet to be reached.
CONCLUSION
Reliable interpretation of longitudinal amyloid deposition and its relationship to the clinical course has been investigated in patients in the early symptomatic stages of AD. Our analysis indicates that PVEC should be used to improve the quantification accuracy of longitudinal β-amyloid PET data to allow visualization of the gradual β-amyloid buildup dynamic during cognitive decline; this buildup does not appear to plateau at early symptomatic stages, according to our data. Our results imply that a further evaluation of the impact of PVEC on the in vivo characterization of time-dependent amyloid pathology in AD, including a reliable assessment and comparison of other amyloid tracers and PVEC methods, is warranted.
DISCLOSURE
Data collection and sharing for this project were funded by the ADNI (National Institutes of Health grant U01 AG024904) and by the Department of Defense ADNI (Department of Defense award W81XWH-12-2-0012). The ADNI is funded by the National Institute on Aging, the National Institute of Biomedical Imaging and Bioengineering, and generous contributions from the following: AbbVie, Alzheimer’s Association; Alzheimer’s Drug Discovery Foundation; Araclon Biotech; BioClinica, Inc.; Biogen; Bristol-Myers Squibb Company; CereSpir, Inc.; Cogstate; Eisai Inc.; Elan Pharmaceuticals, Inc.; Eli Lilly and Company; EuroImmun; F. Hoffmann-La Roche Ltd. and its affiliated company Genentech, Inc.; Fujirebio; GE Healthcare; IXICO LTD.; Janssen Alzheimer Immunotherapy Research & Development, LLC; Johnson & Johnson Pharmaceutical Research & Development LLC; Lumosity; Lundbeck; Merck & Co., Inc.; Meso Scale Diagnostics, LLC; NeuroRx Research; Neurotrack Technologies; Novartis Pharmaceuticals Corporation; Pfizer Inc.; Piramal Imaging; Servier; Takeda Pharmaceutical Company; and Transition Therapeutics. The Canadian Institutes of Health Research is providing funds to support ADNI clinical sites in Canada. Private-sector contributions are facilitated by the Foundation for the National Institutes of Health (www.fnih.org). The grantee organization is the Northern California Institute for Research and Education, and the study is coordinated by the Alzheimer’s Therapeutic Research Institute at the University of Southern California. ADNI data are disseminated by the Laboratory for Neuro Imaging at the University of Southern California. No other potential conflict of interest relevant to this article was reported.
KEY POINTS
QUESTION: Does the shape of the brain β-amyloid buildup curve in AD change when PVEC is applied to longitudinal amyloid PET data?
PERTINENT FINDINGS: In a large sample of subjects with AD or MCI (n = 216 from ADNI), the application of PVEC to longitudinal amyloid PET data changes the amyloid buildup curve from a plateau to an increase.
IMPLICATIONS FOR PATIENT CARE: This new knowledge motivates future regular use of PVEC in analyzing longitudinal amyloid PET data for disease progression and therapy monitoring.
Acknowledgments
Data used in preparation of this article were obtained from the ADNI database (adni.loni.usc.edu). As such, the investigators within the ADNI contributed to the design and implementation of the ADNI or provided data but did not participate in analysis or writing of this report. A complete listing of ADNI investigators can be found at http://adni.loni.usc.edu/wp-content/uploads/how_to_apply/ADNI_Acknowledgment_List.pdf.
Footnotes
Published online May 1, 2020.
- © 2020 by the Society of Nuclear Medicine and Molecular Imaging.
REFERENCES
- Received for publication October 21, 2019.
- Accepted for publication March 28, 2020.


