


Abstract
Everolimus increases progression-free survival in patients with advanced neuroendocrine tumors (NETs). Currently, no biomarkers are available for early selection of patients who will benefit from everolimus. Everolimus can reduce vascular endothelial growth factor A (VEGF-A) production by tumor cells. Therefore, we aimed to investigate the effect of everolimus on tumor uptake of the radioactive-labeled VEGF-A antibody bevacizumab with PET in NET patients. Methods: Patients with advanced progressive well-differentiated NETs underwent 89Zr-bevacizumab PET scans before and at 2 and 12 wk during everolimus treatment. 89Zr-bevacizumab uptake was quantified by the maximum standardized uptake value (SUVmax). Tumor response and the percentage change in the sum of target lesion diameters were determined according to Response Evaluation Criteria in Solid Tumors 1.1 on CT (3 monthly). Results: In 4 of the 14 patients entered, no tumor lesions were visualized with 89Zr-bevacizumab PET. In the remaining patients, 19% of tumor lesions 1 cm or greater known by CT were visualized. Tumor SUVmax decreased during everolimus treatment, with a median of −7% at 2 wk (P = 0.09) and a median of −35% at 12 wk (P < 0.001). The difference in SUVmax at 2 and 12 wk with respect to SUVmax at baseline correlated with percentage change on CT at 6 mo (r2 = 0.51, P < 0.05, and r2 = 0.61, P < 0.01, respectively). Conclusion: This study demonstrates variable 89Zr-bevacizumab PET tumor uptake in NET patients. 89Zr-bevacizumab tumor uptake diminished during everolimus treatment. Serial 89Zr-bevacizumab PET might be useful as an early predictive biomarker of anti–VEGF-directed treatment in NET patients.
Angiogenesis is a hallmark for tumor growth and for development of metastases (1). Vascular endothelial growth factor A (VEGF-A) produced by tumors is one of the main factors responsible for angiogenesis. Currently, several antiangiogenic therapies are available as anticancer agents, including VEGF-A antibodies, tyrosine kinase inhibitors, and mammalian target of rapamycin (mTOR) inhibitors. Antiangiogenic drugs are of interest in patients with well-differentiated neuroendocrine tumors (NETs) (2) because these tumors are hypervascular (3–6). mTOR indirectly stimulates angiogenesis but also induces messenger RNA translation of other genes important for cell survival and proliferation (7).
Phase 3 trials have shown superior progression-free survival in patients with advanced well-differentiated NETs treated with the VEGF receptor tyrosine kinase inhibitor sunitinib or the mTOR inhibitor everolimus. Compared with placebo, sunitinib resulted in a progression-free survival benefit of 5.9 mo in pancreatic NET (pNET) patients (8). Two trials with everolimus, 1 in pNET patients and 1 in patients with NETs associated with carcinoid syndrome, showed a progression-free survival benefit of 6.4 and 5.1 mo, respectively, in favor of everolimus, compared with placebo (9,10).
Because not all patients benefit from everolimus, biomarkers to select patients who will profit from treatment would be extremely helpful. An attractive candidate is VEGF-A. mTOR inhibition reduced VEGF-A excretion by NET cell lines (11). Additionally, in renal cancer xenografts, sensitivity to mTOR inhibition correlated with reductions in tumor hypoxia-inducible factor 1α messenger RNA translation, VEGF-A expression, and angiogenesis (12). However, circulating VEGF-A in patients treated with antiangiogenic drugs has not yet shown a clear predictive value (13). Moreover in pNET patients, serum VEGF-A levels did not differ between patients treated with everolimus or placebo (14). Therefore, it might be more relevant to determine the VEGF-A production at the site of the tumor lesions.
We have developed both SPECT and PET radiopharmaceuticals to visualize VEGF-A noninvasively with the VEGF-A antibody bevacizumab coupled to a radionuclide (15). We showed that everolimus lowered 89Zr-bevacizumab uptake in an ovarian cancer xenograft model and coincided with lowered tumor VEGF-A levels (16). Moreover, this approach is feasible in patients. 111In-bevacizumab SPECT could visualize all tumor lesions in melanoma patients (17). Given the superior resolution and quantification options of PET, we subsequently developed the PET tracer 89Zr-bevacizumab. We showed 89Zr-bevacizumab uptake in numerous tumor lesions in untreated renal cell cancer patients (18).
Therefore, we decided to perform a feasibility study in which we used 89Zr-bevacizumab PET to investigate whether NET lesions in patients can be visualized and whether 89Zr-bevacizumab tumor uptake changes during everolimus therapy.
MATERIALS AND METHODS
Patients
Patients with advanced nonresectable well-differentiated (low or intermediate grade) (19,20) NETs, 18 y or older with an Eastern Cooperative Oncology Group performance score of 0–2 (21) with adequate bone marrow and hepatic/renal function, controlled lipid profile and glucose levels, radiologic documentation of progressive disease over the past year, and measurable lesions according to the Response Evaluation Criteria in Solid Tumors, version 1.1 (RECIST1.1), were eligible (22). Exclusion criteria were uncontrolled medical conditions, such as unstable cardiac disease; serious infections; and any psychologic, familial, sociologic, or geographic conditions with the potential of hampering compliance with the study. The study was approved by the local Medical Ethical Committee. All participants gave written informed consent. The study is registered on clinicaltrials.gov (NCT01338090).
Everolimus Treatment and Patient Monitoring
Treatment consisted of a 10-mg dose of everolimus (orally) once daily. In the case of grade 3 toxicity, doses were reduced to 5 mg every other day. Patients were treated until disease progression based on RECIST1.1 or intolerable toxicity. Progression-free survival was defined as length of everolimus treatment until progressive disease according to RECIST1.1 or clinical progression. Before the start of everolimus, after 11 d, and every 4 wk during treatment, the patient visited the outpatient clinic for medical history, physical examination, and blood tests. Blood tests consisted of measurements of blood counts, renal and hepatic function, lipid profile, glucose, and chromogranin A. Serum chromogranin A levels were determined as described earlier (23). At 2 and 12 wk, everolimus levels were measured in ethylenediaminetetraacetic acid blood by liquid chromatography and tandem mass spectrometry, as described previously (24). At baseline and 12 wk, serum VEGF-A levels were determined with the Quantikine enzyme-linked immunosorbent assay kit (R&D Systems).
89Zr-Bevacizumab PET/CT and CT
Bevacizumab (25 mg/mL; Roche) was conjugated and labeled in University Medical Center Groningen cleanroom facilities under good manufacturing practice conditions as described earlier (16,25). Four days before each 89Zr-bevacizumab PET scan, 37 MBq of 89Zr-bevacizumab (protein dose, 5 mg) were administered intravenously. Whole-body PET imaging was performed from the upper legs to the head in 6–8 bed positions of 5-min acquisition times each. All patients underwent 89Zr-bevacizumab PET scanning at baseline and after 2 wk of everolimus treatment. 89Zr-bevacizumab PET after 12 wk of everolimus treatment was performed only if tumor lesions could be visualized on earlier 89Zr-bevacizumab PET scans. At baseline and after 12 wk, the PET scan was combined with a diagnostic CT of the chest and abdomen (Biograph mCT PET/CT, 4 detector rings, 64-slice CT; Siemens). Staging after 6 mo and every 3 mo thereafter was performed with a multislice CT scanner (Sensation 16- or 64-slice CT; Siemens). Diagnostic CT scans were obtained before and after administration of intravenous contrast agent as a triphase scan, with a maximal slice thickness of 5.0 mm.
Image and Data Analysis
The image quality of 37 MBq of 89Zr provides a resolution of approximately 10 mm on PET. Therefore, the total number of tumor lesions 10 mm or greater on the baseline CT scan was determined. 89Zr-bevacizumab PET was compared with the baseline CT scan. For lesions outside the field of view of the CT, other nuclear medicine imaging techniques were used for verification.
Tracer uptake was quantified in tumor lesions and organs with AMIDE Medical Image Data Examiner software (version 0.9.1; Stanford University) by drawing 3-dimensional regions of interest (26). Mean and maximum standardized uptake values (SUVmean and SUVmax, respectively) were calculated. If more than 10 tumor lesions were visualized in 1 organ, then 10 were quantified. A high correlation was found between SUVmean and SUVmax for healthy organs and tumor lesions (Pearson r2 = 0.99 and 0.97, respectively, P < 0.0001). Because it is less operator-dependent, we present data as SUVmax. The difference in SUVmax (ΔSUVmax) of all tumor lesions and ΔSUVmax of the most intense (89Zr-bevacizumab–accumulating) tumor lesion per patient were assessed after 2 and 12 wk with respect to SUVmax at baseline. For patients individually, correlations were analyzed between baseline SUVmax and ΔSUVmax and the percentage change in sum of target lesion diameters on CT according to RECIST1.1. ΔSUVmax was correlated with serum chromogranin A and VEGF-A and whole-blood everolimus concentrations.
Statistical Analyses
To be able to study our primary endpoint—a change in 89Zr-bevacizumab uptake in tumor lesions between the baseline PET scan and the scans obtained after 2 and 12 wk—it was estimated that a minimum of 11 patients was needed to predict with 80% power (with 2-sided α = 0.05) that there is a true difference in standardized uptake value (≥1.25 SD) between the baseline scan and the scan after 2 and 12 wk of treatment. Therefore, the aim was to include 14 patients. The secondary endpoint was progressive disease according to RECIST1.1 on CT after 12 wk of treatment. Data are presented as median and range, unless otherwise indicated. Pearson and Spearman rank correlation served to calculate correlations of parametric and nonparametric data, respectively. The Mann–Whitney test was used for unpaired data, and the Wilcoxon signed-rank test was used for paired data. With Kaplan–Meier analysis, the progression-free survival was determined. SPSS (version 18; IBM) was used for the statistical analyses. A P value of less than 0.05 was considered statistically significant.
RESULTS
Patient Characteristics
Between April 2010 and February 2011, 14 patients were included. Patient characteristics are presented in Table 1. Six patients had serotonin-producing NETs. Five of them already received somatostatin analogs, which were continued during everolimus treatment.
Baseline Patient Characteristics (n = 14)
Currently, 6 patients are still on everolimus, with a median treatment duration of 19 mo (range, 14–21 mo). Five patients stopped treatment because of disease progression: 1 patient each after 6, 8, and 10 mo and 2 patients after 12 mo. Two patients discontinued because of toxicity: lingual angioedema in one after 4 wk of treatment and fatigue in the other after 3 mo. One patient was lost to follow-up after 12 mo (Table 2).
Imaging Characteristics and Treatment Outcome Per Patient (n = 14)
All of the 13 patients evaluable for tumor response experienced stable disease according to RECIST1.1, after 3 and 6 mo. Progression-free survival at 12 mo was 64%; the median progression-free survival is not yet reached.
Baseline 89Zr-Bevacizumab PET
Four days after the tracer injection, typical antibody distribution (17,27) of 89Zr-bevacizumab was visible in healthy tissues at baseline and after 2 and 12 wk. High 89Zr-bevacizumab uptake was present in the circulation (including the heart), kidneys, liver, and spleen and low uptake in lung, muscle, bone, and brain (Supplemental Fig. 1; supplemental materials are available at http://jnm.snmjournals.org).
In 10 patients, 89Zr-bevacizumab PET visualized 63 tumor lesions, and in 4 patients no tumor lesions were detected. 89Zr-bevacizumab PET detected 19 lesions in the bone, 36 in the liver, 4 in the pancreas, 2 in the spleen, 1 in the bowel, and 1 mediastinal lymph node. The median number of visualized lesions per patient was 3 (range, 1–34) (Table 2), with a median SUVmax of 5.8 (range, 1.7–15.1). Seven lesions in 4 patients were located outside the field of view of CT. These lesions were confirmed bone metastases with other imaging techniques: 1 with 18F-FDG, 3 with 11C-5-hydroxytryptophan (11C-5-HTP), 1 with 18F-dihydroxy-phenyl-alanine PET, and 2 with 99mTc-oxidronate (bone scanning). One lesion was located in the field of view but not detected on CT: this lesion was confirmed with 11C-5-HTP PET. In all patients, the baseline CT scan detected 327 lesions 10 mm or greater. In the 10 patients with tumor lesion uptake on 89Zr-bevacizumab PET, 19% of lesions 10 mm or greater showed uptake on 89Zr-bevacizumab PET.
Serial 89Zr-Bevacizumab Tumor Uptake
In the 10 patients with a positive 89Zr-bevacizumab PET scan finding, 7 showed a decrease of the tumor SUVmax, whereas in 3 patients the tumor SUVmax increased (Supplemental Fig. 2).
At a tumor lesion–based level, tumor SUVmax decreased during everolimus treatment, with a median of −7% at 2 wk (P = 0.09) and a median of −35% at 12 wk (P < 0.001) (Fig. 1). Figure 2 shows an example of serial 89Zr-bevacizumab PET scans in a midgut NET patient. The change of tumor SUVmax was not induced by changes in tumor size, because percentage change in tumor SUVmax did not correlate with the percentage change in longitudinal tumor size on CT after 12 wk (r2 = 0.072).
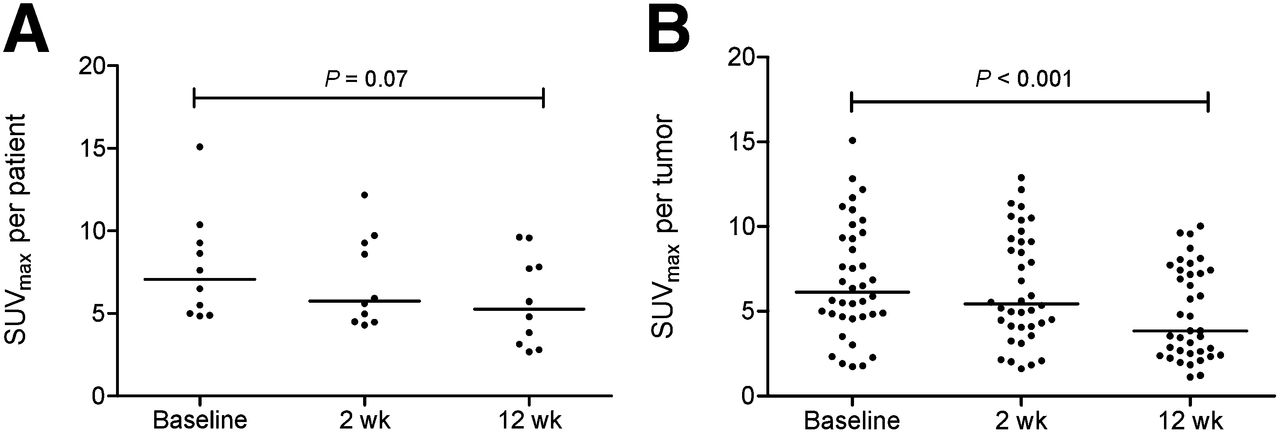
SUVmax in most intense tumor lesion per patient (A) and in all tumor lesions (B) at baseline, 2 wk, and 12 wk. Horizontal bars represent median values.

PET images 4 d after 89Zr-bevacizumab injection in patient with metastatic midgut carcinoid. (A) Coronal and axial images of low-dose CT and fusion images of PET. Low-dose CT shows increased tracer uptake in abdominal tumor lesion. (B) Coronal PET images at baseline, 2 wk, and 12 wk of everolimus treatment. Physiologic 89Zr-bevacizumab uptake is present in heart (blood pool), liver, spleen, and circulation. At baseline, increased 89Zr-bevacizumab uptake was found in tumor lesion located in ileocecal angle (arrows). Tumor uptake was 43% lower at 2 wk and 69% lower at 12 wk during everolimus treatment.
89Zr-Bevacizumab PET Related to Treatment Outcome
The secondary objective was to explore whether 89Zr-bevacizumab PET could early identify patients with progressive disease according to RECIST1.1 after 3 mo. However, none of the patients experienced progressive disease after 3 and 6 mo of everolimus treatment. Of the 4 patients without tracer uptake in tumor lesions, 3 were evaluable for response and experienced stable disease for 12 and 20+ mo, whereas 1 discontinued everolimus after 3 mo because of side effects. The 10 patients with a positive 89Zr-bevacizumab PET scan finding experienced stable disease ongoing for 6–21+ mo (median, 13 mo). The 7 patients with decrease in tumor SUVmax experienced stable disease for 6–21+ mo (median, 16+ mo). The 3 patients with an increase in tumor SUVmax experienced stable disease for 8 and 12 mo, and 1 patient was lost to follow-up (Table 2).
There was no correlation between baseline tumor SUVmax and the percentage change in the sum of target lesion diameters on CT according to RECIST1.1 after 6 mo (Fig. 3). ΔSUVmax after 2 and 12 wk, however, correlated with the percentage change in the sum of the target lesion diameters according to RECIST1.1 on CT after 6 mo (r2 = 0.51, P < 0.05, and r2 = 0.61, P < 0.01, respectively) (Fig. 3).
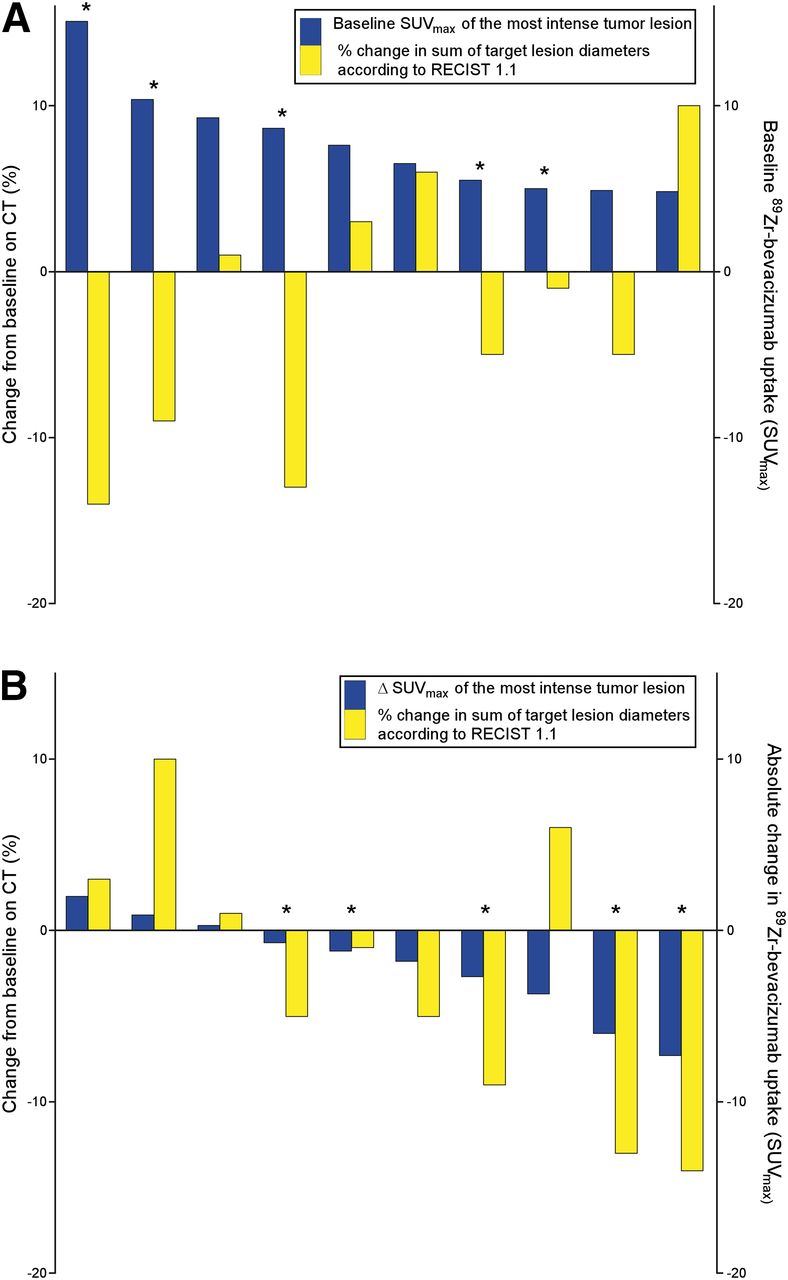
Waterfall plots of 10 patients with visualized tumor lesions at 89Zr-bevacizumab PET. (A) Maximum baseline SUVmax (blue bars) and percentage change in sum of target lesion diameters according to RECIST1.1 on CT after 6 mo (yellow bars). (B) ΔSUVmax at 12 wk of most intense tumor lesion at baseline (blue bars) and percentage change in sum of target lesion diameters according to RECIST1.1 on CT after 6 mo (yellow bars). * = patient is still on everolimus.
89Zr-Bevacizumab PET Versus Everolimus, Chromogranin A, and VEGF-A Blood Levels
Eleven patients were evaluable for whole-blood everolimus levels at 2 and 12 wk of therapy (median, 13.4 μg/L, and range, 10.3–30.3 μg/L; and median, 15.6 μg/L, and range, 6.3–30.1 μg/L, respectively) (Fig. 4). No correlation was found between everolimus levels and the change in ΔSUVmax at 2 and 12 wk (data not shown).

Graphs showing whole-blood everolimus levels after 2 wk and 12 wk of everolimus treatment (n = 11) (A) and serum VEGF-A levels measured at baseline and 12 wk of treatment (n = 13) (B). Horizontal bars represent median values. *P < 0.05.
Serum VEGF-A levels were lower at 12 wk (median, 240 pg/mL; range, 16–1,220) than at baseline (median, 375 pg/mL; range, 92–1,629) (n = 13) (P < 0.05) (Fig. 4). Percentage change in VEGF-A serum levels after 12 wk did not correlate with change of ΔSUVmax after 12 wk (data not shown). Baseline median chromogranin A level was 821 μg/L (range, 66–49,700 μg/L). In patients with elevated levels (>100 μg/L), percentage change of serum chromogranin A levels after 3, 6, 9, and 12 mo did not correlate with ΔSUVmax after 12 wk (data not shown).
DISCUSSION
This study shows that 89Zr-bevacizumab PET can visualize tumor lesions in patients with advanced well-differentiated NETs. In 10 of 14 patients, 63 tumor lesions were visible, representing 19% of the lesions 1 cm or greater on CT in these individuals. Everolimus treatment decreased 89Zr-bevacizumab tumor accumulation by 7% at 2 wk (not significant) and by 35% at 12 wk. In addition, ΔSUVmax correlated with percentage change in tumor size of target lesions on CT at 6 mo.
The negative PET scan findings in 4 patients are remarkable, because a study with 111In-bevacizumab SPECT in stage III/IV melanoma patients and studies with 89Zr-bevacizumab PET in metastatic renal cell carcinoma patients and patients with early breast cancer demonstrated tumor lesions in all but 1 breast cancer patient (17,18,28). Tumor VEGF-A levels were not available in the current study, because no tumor biopsies were obtained at the moment of PET scanning. In stage III/IV melanoma patients, 111In-bevacizumab uptake clearly correlated with degree of VEGF-A tumor expression assessed by immunohistochemistry (17). In addition, in patients with primary breast cancer 89Zr-bevacizumab uptake correlated with VEGF-A tumor levels measured with enzyme-linked immunosorbent assay (28).
The VEGF family consists of 4 different subtypes: VEGF-A, -B, -C, and -D. VEGF-A is considered to be the key player in tumor angiogenesis. VEGF-B is an inefficient factor for induction of angiogenesis. VEGF-C and -D induce venous and lymphatic angiogenesis (29). The involvement of different VEGF subtypes in NETs has been poorly investigated. In 50 low-grade gastrointestinal NETs, VEGF-A protein expression was strong in 32%, weak in 54%, and absent in 14% of the tumors (3). In 23 pNET patients, VEGF-A and -C protein expression were studied. There was a limited VEGF-A protein expression in both the primary tumor (n = 19) and the liver metastases (n = 7). Although VEGF-C expression was limited in primary tumors, liver metastases did show high expression (30). In another study, expression of all VEGF subtypes was quantified with real-time polymerase chain reaction in 25 patients with ileal NETs. VEGF-A expression was similar between tumor lesions and healthy ileal mucosa. In contrast, VEGF-B and VEGF-D levels were higher in tumors than in normal mucosa (31). This might explain why several of the NET lesions in our study did not show uptake of 89Zr-bevacizumab.
The heterogeneous baseline 89Zr-bevacizumab PET results may be an explanation for the fact that not all NET patients benefit from antiangiogenic treatment with bevacizumab (32–34). It might be of interest to perform a trial with 89Zr-bevacizumab PET before bevacizumab therapy to determine whether this PET scan could be useful in the selection of NET patients up front. In that case, 89Zr-bevacizumab PET can be used to visualize the presence of the drug target. However, in the current study we were interested in visualizing VEGF-A as an early read out of a downstream effect of mTOR inhibition, which might give insight into the effect of treatment.
mTOR inhibition has pleiotropic antitumor effects, including reduction of tumor VEGF-A production. In the current study, we did indeed find reduced 89Zr-bevacizumab tumor uptake after 2 and 12 wk of everolimus treatment. Serial imaging results are in concordance with an ovarian cancer xenograft study, in which 2 wk of everolimus treatment decreased 89Zr-bevacizumab tumor uptake by 21.7% ± 4% and corresponded with lower tumor VEGF-A protein levels and microvessel density in treated animals (16). Not all patients with a positive 89Zr-bevacizumab PET scan finding before everolimus treatment showed a reduction in tumor uptake during everolimus treatment. This differential effect was not due to inadequate everolimus levels, because in all patients the levels were comparable to those reported earlier in a phase 1 study (35). A negative 89Zr-bevacizumab PET scan finding did not preclude benefit from treatment with everolimus, possibly likely due to other antitumor effects of everolimus than reduction of VEGF-A.
Serum VEGF-A levels were 25% lower after 12 wk of everolimus treatment than at baseline. In the RADIANT-3 study, serum VEGF-A levels were determined at baseline and 4, 8, and 12 wk and did not change in pNET patients who received everolimus (n = 207) or placebo (n = 203) (14). These discrepant results may be the consequence of different assays. We observed no correlation between change in serum VEGF-A levels and tumor ΔSUVmax after 2 and 12 wk, suggesting that change in circulating VEGF-A does not reflect change of VEGF-A at the tumor level. This result may be explained by the fact that VEGF-A consists of different isoforms. VEGF-A121 and VEGF-A165 can diffuse freely, whereas VEGF-A189 and VEGF-A206 are attached to the extracellular matrix (36). Moreover, serum VEGF-A levels contain VEGF-A released by platelets (37).
Another useful imaging strategy to predict everolimus efficacy might be functional imaging with MR imaging, including diffusion-weighted (DW) MR imaging and contrast-enhanced MR imaging. Tumor necrosis results in increased water permeability, which can be measured by DW MR imaging. Contrast-enhanced MR imaging can quantify changes in tumor vascularity. In a retrospective study in 71 patients with advanced NETs who underwent intraarterial chemoembolization of liver metastases, DW MR imaging and contrast-enhanced MR imaging scans were obtained at baseline and 4 wk after therapy. The authors concluded that volumetric functional MR imaging criteria may act as biomarkers of early response (38). An advantage of MR imaging is that it does not expose patients to radiation.
CONCLUSION
This study demonstrates differences in 89Zr-bevacizumab tumor accumulation between and within patients with advanced well-differentiated NETs. This heterogeneity likely reflects differential VEGF-A pathway activity. Everolimus treatment reduced 89Zr-bevacizumab tumor accumulation without affecting normal organ distribution. A baseline 89Zr-bevacizumab PET scan cannot be used to select patients for everolimus treatment. Larger studies are needed to determine the predictive value of serial scans for efficacy of everolimus treatment, but a read out of other downstream effects of mTOR inhibition might be more relevant in NETs.
Acknowledgments
The costs of publication of this article were defrayed in part by the payment of page charges. Therefore, and solely to indicate this fact, this article is hereby marked “advertisement” in accordance with 18 USC section 1734. This study was supported by a research grant of Novartis, The Netherlands. No other potential conflict of interest relevant to this article was reported.
Footnotes
Published online May 1, 2014.
- © 2014 by the Society of Nuclear Medicine and Molecular Imaging, Inc.
REFERENCES
- Received for publication July 23, 2013.
- Accepted for publication January 3, 2014.


Jump to section
Related Articles
Cited By...
- PET Imaging of Receptor Tyrosine Kinases in Cancer
- Molecular Imaging in Cancer Drug Development
- Tumor-Specific Uptake of Fluorescent Bevacizumab-IRDye800CW Microdosing in Patients with Primary Breast Cancer: A Phase I Feasibility Study
- 89Zr-Bevacizumab PET: Potential Early Indicator of Everolimus Efficacy in Patients with Metastatic Renal Cell Carcinoma
- 89Zr-Bevacizumab PET Visualizes Disease Manifestations in Patients with von Hippel-Lindau Disease
- Efficacy and Safety of Everolimus in Extrapancreatic Neuroendocrine Tumor: A Comprehensive Review of Literature
- Predictive factors of response to mTOR inhibitors in neuroendocrine tumours
- Molecular Imaging of Post-Src Inhibition Tumor Signatures for Guiding Dasatinib Combination Therapy
- TGF-{beta} Antibody Uptake in Recurrent High-Grade Glioma Imaged with 89Zr-Fresolimumab PET
- Antibody Positron Emission Tomography Imaging in Anticancer Drug Development
- 89Zr-Bevacizumab PET Visualizes Heterogeneous Tracer Accumulation in Tumor Lesions of Renal Cell Carcinoma Patients and Differential Effects of Antiangiogenic Treatment