


Abstract
The aim of this study was to assess the in vivo flow–metabolic phenotype in primary colorectal cancer with integrated 18F-FDG PET/perfusion CT and its relationship to gold standard histopathologic assessment of angiogenesis and hypoxia. Methods: 45 patients (26 male and 19 female; mean age, 67.6 y) with primary colorectal cancer underwent integrated 18F-FDG PET/perfusion CT, deriving tumor glucose metabolism (maximum standardized uptake value) and regional blood flow. From this cohort, 35 underwent surgery subsequently, without intervening neoadjuvant treatment, allowing histopathologic correlation with tumor stage, CD105 microvessel density, vascular endothelial growth factor (VEGF), glucose transporter protein 1 (Glut-1), and hypoxia-inducible factor 1 expression. Results: The flow–metabolic ratio was significantly lower for tumors with higher VEGF (3.65 vs. 5.98; P = 0.01) or hypoxia-inducible factor 1 expression (3.63 vs. 5.48; P = 0.04) versus tumors with lower expression. There were significant negative correlations between the tumor flow–metabolic ratio and VEGF expression (r = −0.55, P = 0.0008), indicating that tumors with low blood flow but higher metabolism were associated with higher VEGF expression. Flow and metabolism were coupled in higher-stage (stage III/IV) tumors but not lower-stage tumors (stage I/II) (r = 0.47, P = 0.03, vs. r = 0.09, P = 0.65, respectively. Conclusion: Tumors with a low-flow–high-metabolism phenotype demonstrated higher VEGF expression and may reflect a more angiogenic phenotype.
To date, the focus of neoadjuvant treatment in colorectal cancer has been to improve the rate of R0 resection (resection specimens with a surgical margin clear of tumor) and to decrease the local recurrence rate. The Swedish rectal cancer trial (1) and Dutch Total Mesorectal Excision (TME) trial (2) have shown that short-course preoperative radiotherapy (5 × 5 Gy) is an effective strategy. The recently published long-term outcome of the Dutch TME trial showed that the 10-y cumulative incidence of local recurrence in the group receiving short-course preoperative radiotherapy was 5%, compared with 11% in the surgery-alone group (3). For locally invasive rectal cancers, neoadjuvant chemoradiation is the preferred strategy (4,5). However, although short-course preoperative radiotherapy and chemoradiation are effective strategies for locoregional control, they are not effective for systemic control, and they may not necessarily improve overall survival, as shown by the Dutch TME trial (3). This has led to the proposal of additional neoadjuvant chemotherapy to chemoradiation strategies in several phase II studies (Table 1) (6–9). Neoadjuvant chemotherapy (fluoropyrimidine/oxaliplatin with or without panatimumab: 3 cycles of standard chemotherapy before surgery and 9 cycles after surgery) is also being explored for colon cancer (≥stage III as defined by CT) in the FOxTROT study (fluoropyrimidine, oxaliplatin, and targeted receptor preoperative therapy for colon cancer) in the United Kingdom.
Published Phase II Trials of Neoadjuvant Chemotherapy and Chemoradiation in Rectal Cancer
This shifting paradigm coupled with the exploration of targeted drugs—for example, panatimumab targeted at the epidermal growth factor receptor—has placed a greater emphasis on preoperative imaging for accurate staging and a better means of tumor phenotyping. High-resolution MRI (for locoregional staging of rectal cancer (10)) and CT (for locoregional staging of colon cancer (11), as well as distant metastases) remain key recommended modalities (12) but have limitations: 30% of patients may relapse within 3 y of “curative” treatment based on such anatomic assessment (13). 18F-FDG PET or PET/CT may have a role in assessing the extent of distant metastatic disease before metastectomy, as this technique is more sensitive than contrast-enhanced CT (14,15). Studies have also reported on the potential of PET standardized uptake value measurements as a prognostic and predictive biomarker (16).
There is strong circumstantial evidence that hypoxic tumors with high glucose metabolism represent a particularly aggressive tumor type (17–19) and are associated with greater treatment resistance (18). Identification of these hypoxic yet highly metabolic tumors by imaging may potentially be an effective strategy for stratifying patients for neoadjuvant chemotherapy. Given the increasing availability of PET scanners integrated with high-end CT, it is now possible to combine anatomic staging with assessment of the tumor metabolic flow phenotype. The aim of this prospective study was to investigate the in vivo tumor flow–metabolic phenotype in primary colorectal cancer with integrated 18F-FDG PET and perfusion CT and to determine its relationship to histopathologic markers of angiogenesis and hypoxia.
MATERIALS AND METHODS
Patients
Institutional ethical approval and informed consent were obtained for this prospective study. Patients were eligible if they had a proven colorectal cancer and no contraindications to 18F-FDG PET and contrast-enhanced CT (uncontrolled diabetes, pregnancy, previous reaction to intravenous contrast agent, renal impairment [serum creatinine > 120 μmol/L]). Consecutive consenting patients were enrolled from April 2007 to October 2010. All patients underwent integrated 18F-FDG PET/perfusion CT in addition to standard staging investigation. Fifty-three patients were enrolled (31 male and 22 female; mean age, 67.1 y; range, 49.7–89.4 y). 18F-FDG PET/perfusion CT was successful in 45 patients (26 male and 19 female; mean age, 67.6 y), 35 of whom underwent surgery subsequently without intervening treatment (Fig. 1). The tumor characteristics are summarized in Table 2. Tumors were staged by pathology and imaging in the 35 patients who underwent surgery without prior neoadjuvant treatment. In the remaining 10 patients, staging was by imaging alone (CT, MRI, and PET/CT combined). Mean tumor size ± SD was 4.4 ± 2.1 cm.

Flow chart of study population.
Tumor Stage and Grade for Study Population (n = 45)
18F-FDG PET/CT
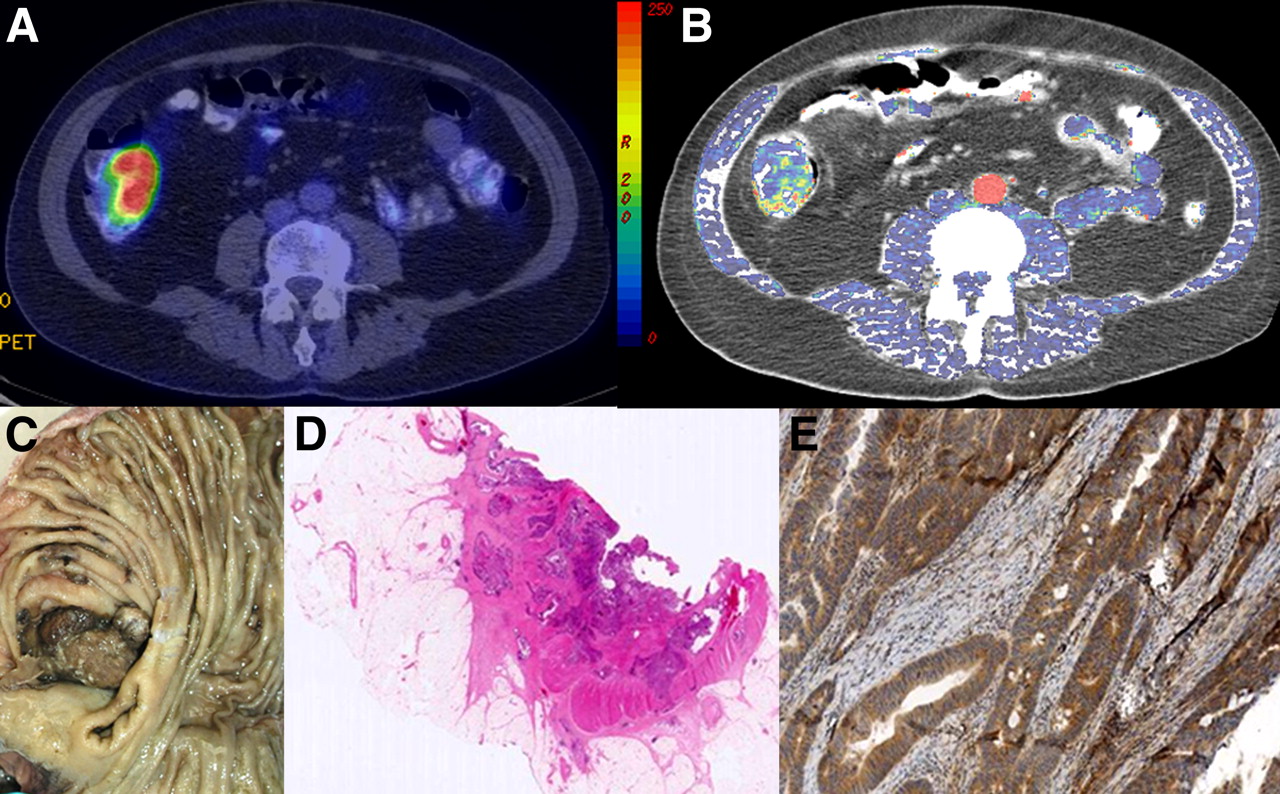
Fasting patients (serum glucose, 5.0 ± 0.87 mmol/L) received an intravenous injection of 190 MBq of 18F-FDG. After a mean uptake period of 76 ± 18.2 min, imaging was performed on a PET/CT instrument (Discovery VCT [64-detector CT]; GE Healthcare). CT for attenuation correction was from the skull base to the upper thigh, using 140 kV, 40 mAs, a pitch of 1.5, 3.75-mm detectors, and 5-mm collimation. The PET emission scan covering the same anatomic area was performed in 2-dimensional mode, consisting of 8 min/bed position. Transaxial emission images of 5.47 × 5.47 × 3.27 mm (in-plane matrix size, 128 × 128) were reconstructed using ordered-subsets expectation maximization with 2 iterations and 28 subsets. The axial field of view was 148.75 mm. Maximum standardized uptake value (SUVmax) for the entire tumor volume was obtained for each patient using an automated thresholding method on a standard workstation (Advantage Windows; GE Healthcare) (Fig. 2).

Representative axial images obtained from integrated 18F-FDG PET/perfusion CT study: fused anatomic CT and SUVmax image (A), fused anatomic CT and regional blood flow parametric map (B), corresponding surgical specimen (C), hematoxylin- and eosin-stained section (D), and VEGF-stained section (E).
Perfusion CT
The ensuing perfusion CT acquisition (120 kV, 60 mA, axial mode, a 2-s interval for the first 40 s and then a 5-s interval; total acquisition, 150 s; effective dose, 9mSv; 10-s delay from injection) after intravenous iohexol (50 mL, 350 mg of iodine per milliliter [Omnipaque; GE Healthcare] at 5 mL/s) was assessed using software based on distributed parameter analysis (GE Healthcare) (20). A smoothed arterial-time enhancement curve was derived from a circular 20-mm2 region of interest placed within the best-visualized artery. From the generated parametric map, tumor blood flow was obtained from a defined region of interest (Fig. 2). The flow–metabolic ratio (the ratio of contrast agent delivery to tumor glucose metabolism) was also determined for each patient by dividing mean blood flow by SUVmax.
Histopathologic Assessment
After surgical resection, specimens were fixed in 10% neutral buffered formalin solution. The tumor blocks were processed in a conventional manner and embedded in paraffin wax. Sections 4 μm thick were obtained from each tissue block and routinely stained with hematoxylin and eosin. Further sections were prepared for immunohistochemistry and stained for CD105 and vascular endothelial growth factor (VEGF) (reflecting neoangiogenesis) and for glucose transporter protein (Glut-1) and hypoxia-inducible factor 1 (HIF-1α; reflecting hypoxia). CD105 is a proliferation-associated and hypoxia-inducible protein abundantly expressed in angiogenic endothelial cells, allowing assessment of microvessel density; VEGF is produced by colorectal tumor cells, stromal cells, and tumor-infiltrating macrophages and is a key event for angiogenesis. Glut-1 mediates cellular uptake of glucose and is upregulated under hypoxic conditions via the HIF-1α pathway to enable anaerobic glycolysis, providing an indirect marker of hypoxia.
The following dilutions of antibodies were made: CD105 (Novocastra; dilution, 1/200); VEGF (Dako; dilution, 1/100), Glut-1 (Chemicon; dilution, 1/400), and HIF-1α (Vector; dilution, 1/100). All sections were stained at the same time on the fully automated Bond-Max system (Leica Biosystems), which was used in conjunction with the Bond Polymer Refine system.
All slides were scanned at ×40 magnification using Mirax Scan (Carl Zeiss), and images were exhibited in a liquid crystal display monitor under contrast, focus, saturation, and white balance standardization. To evaluate the staining intensity, the image analysis system HistoQuant (3DHistech) was used. A single observer (a histopathologist with more than 10 y of experience in gastrointestinal pathology) performed semiquantitative analysis of immunoreactivity of the 4 markers. CD105-stained vessels with a clearly defined lumen or well-defined linear vessel shape but not single endothelial cells were considered for microvessel assessment. Four areas of highest vascularization (hot spots) using light microscopy were counted at ×20 magnification in an Olympus BX51 microscope, representing 1.060 mm2. Scores for VEGF, Glut-1, and HIF-1α were based on the intensity of staining and the percentage of positively stained cells according to previously published systems. Glut-1 and VEGF expression was calculated by combining the intensity of stained cells (0–3) with the percentage of positive cells (0–4) (21) and HIF-1α expression on the combined cytoplasmic and nuclear staining (range, 0–6) (22))
Statistical Analysis
After confirmation of data nonnormality using the Shapiro–Wilk test, the median and range for SUVmax, blood flow, and flow–metabolic ratio (blood flow/SUVmax) were determined. Statistical correlations between SUVmax, blood flow, the flow–metabolic ratio, and immunohistochemistry (CD105, VEGF, Glut-1, and HIF-1α) were performed using Spearman rank correlation. Patients who underwent surgery were also subdivided according to pathologic stage, tumor size, and immunohistochemistry, and the flow–metabolic ratio of each group was compared using the Mann–Whitney U test.
RESULTS
The median for tumor SUVmax, blood flow, and flow–metabolic ratio was 15.8 (range, 4.5–47.1), 76.9 mL/min/100 g (range, 40.45–203.65 mL/min/100 g), and 4.72 (range, 1.08–18.86), respectively. In terms of the relationship between regional blood flow, metabolism, and histopathology, coupling of flow and metabolism was noted in stage III/IV tumors (r = 0.47, P = 0.03) but not in stage I/II tumors (r = 0.09, P = 0.65; Table 3; Fig. 3).There was a modest positive correlation between blood flow and CD105 microvessel density (r = 0.33; P = 0.05) and between SUVmax and VEGF (r = 0.39; P = 0.02). No other significant correlations were noted between blood flow and VEGF, Glut-1, or HIF-1α (r = −0.06 to −0.20, P = 0.23–0.98) or between SUVmax and CD105, Glut-1, or HIF-1α (r = −0.20 to 0.22; P = 0.21–0.23).
Correlation Between Blood Flow and SUVmax for Study Population (n = 45)
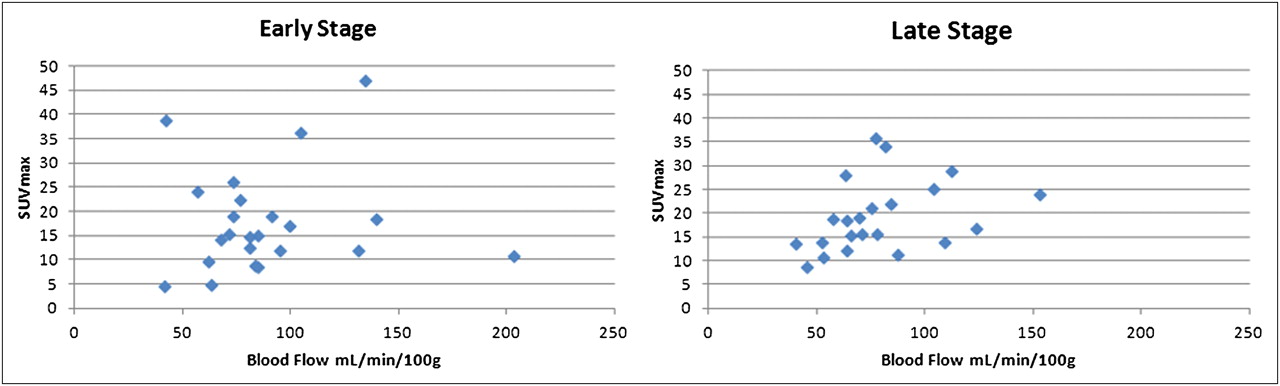
Scatterplot of SUVmax vs. regional blood flow for early- and late-stage tumors.
There was a significant negative correlation between the flow–metabolic ratio and VEGF expression (r = −0.55; P = 0.0008). No significant correlations were demonstrated between the flow–metabolic ratio and CD105 microvessel density, Glut-1, or HIF-1α (r = −0.26 to 0.14, P = 0.12–0.74). The flow–metabolic ratio was significantly lower for tumors with higher VEGF expression (3.65 vs. 5.98; P = 0.01) or HIF-1α expression (3.63 vs. 5.48; P = 0.04; Table 4) but was not different for tumor stage or size (Table 4). There were no significant correlations between CD105, VEGF, Glut-1, or HIF-1α expression (r = −0.13 to 0.11; P = 0.43–0.52).
Comparison of Flow–Metabolic Ratio by Stage and Immunohistochemistry (n = 35)
DISCUSSION
In this study, we found that the in vivo relationship between flow and metabolism differed across tumors: flow and metabolism were coupled in stage III and IV cancer, but the relationship was not maintained in stage I or II cancer. We also found that the flow–metabolic ratio was lower in tumors expressing VEGF and HIF-1α. The flow–metabolic ratio correlated with VEGF expression, that is, low-flow and high-metabolism tumors showed higher VEGF expression. To date, a small number of studies have assessed the relationship between 18F-FDG PET and perfusion CT (Table 5) (23–28). In general, flow and metabolism have been matched (23,24,26–28) and are more likely to be coupled in early-stage than late-stage cancer. For example, published studies on lung, breast, and head and neck cancers have noted this relationship (24,26,27), although other studies have not (25). In our study, coupling was present in only late-stage cancers. Unlike non–small cell lung cancer and head and neck tumors, colorectal cancer does not necessarily demonstrate necrosis as the tumor grows, and this type of cancer may be associated with a greater inflammatory response, increasing estimated vascularization. Thus, uncoupling of flow and metabolism may not occur as the tumor grows, as has been found in non–small cell lung cancer (24). Indeed, no dependence on size was shown in our study.
Studies That Have Assessed the Relationship Between 18F-FDG PET and Perfusion CT Parameters
Colorectal tumors with a low-flow and high-metabolism phenotype (i.e., showing decoupling of flow and metabolism) were associated with higher levels of HIF-1α (hypoxia) and VEGF (angiogenesis), indicating an adaptive response to hypoxia, with upregulated anaerobic glycolysis and angiogenesis. This phenotype has been purported to be more aggressive (18), as supported by previous PET data. For example, previous studies using PET tracers of flow and metabolism have found that the balance between blood flow and metabolism may provide predictive and prognostic information. Studies using 15O-H2O and 18F-FDG in breast (29–31) and pancreatic cancer (32) have shown that tumors with low flow and high metabolism are associated with poorer treatment response and outcomes.
The benefit of neoadjuvant therapy in rectal cancer remains a topic of debate (33). The use of neoadjuvant chemotherapy up front delivers systemic doses at an early stage of the diagnosis, rather than after a delay of up to 18 wk with chemoradiotherapy and surgery. Early neoadjuvant chemotherapy may also overcome the lower compliance rates (≤50% noncompliance) that may be seen after chemoradiotherapy with adjuvant 5-fluorouracil–based chemotherapy. However, there may be higher morbidity, such as through the higher risk of cardiac and thromboembolic events. Chau et al. reported 9 events and 5 deaths during neoadjuvant chemotherapy (7). Another concern with increasing the intensity of neoadjuvant chemotherapy is the possibility of adverse effects on leakage rates, pelvic sepsis, and perineal wound infections. Nevertheless, neoadjuvant chemotherapy is recognized as a priority for future research in a set of consensus recommendations (34).
Assessment of the tumor flow–metabolic ratio may prove to be a relevant strategy for stratifying patients for additional neoadjuvant chemotherapy, particularly patients whose disease is at a lower stage but who are deemed at higher risk—for example, with this phenotype. It is well recognized that 5-y survival of patients with stage II tumors is highly variable, ranging from 66.5% to 32.5% from stage IIA to IIC (35), and that a subgroup of stage II patients with a higher risk of relapse may benefit from additional therapy. Recognized poor prognostic factors include clinical obstruction or perforation, T4 disease, inadequate nodal sampling (36), perineural invasion, venous invasion, lymphatic invasion, and a younger age at presentation (37). Some but not all of these factors may be depicted by anatomic imaging.
An attraction of 18F-FDG PET/perfusion CT is its straightforward implementation into the patient care pathway and its advantage over combined 15O-H2O and 18F-FDG PET, whose applicability is limited by the short tracer half-life and the necessity for repeated arterial blood sampling. Perfusion CT techniques have been compared with 15O-H2O PET in a variety of tumors within a phase I study of endostatin (38) with good agreement between the 2 methods—a mean difference of −1.99 and 95% limits of agreement of −32 to +28 mL/min/100 g—indicating they may yield similar information (38). We recognize that genomic biomarkers such as K-ras mutation status have had an impact on treatment with anti–epidermal growth factor receptor agents such as cetuximab and panitumumab in the metastatic setting (39,40), but they have had only a limited impact in the nonmetastatic setting. Nor have all studies found k-ras mutation status to confer treatment benefit (41).
CONCLUSION
We have found that the flow–metabolic ratio was lower in tumors expressing VEGF and HIF-1α and that the in vivo relationship between flow and metabolism differed across tumors: this was coupled in stage III and IV cancer, but the relationship was not maintained in stage I or II cancer. Integrated 18F-FDG PET/perfusion CT may be a promising imaging tool in clinical practice with the potential to risk-stratify patients with colorectal cancer to neoadjuvant therapy.
DISCLOSURE STATEMENT
The costs of publication of this article were defrayed in part by the payment of page charges. Therefore, and solely to indicate this fact, this article is hereby marked “advertisement” in accordance with 18 USC section 1734.
Acknowledgments
University College London and King's College London receive funding from the NIHR as Comprehensive Biomedical Research Centers. No other potential conflict of interest relevant to this article was reported.
Footnotes
Published online Mar. 27, 2012.
- © 2012 by the Society of Nuclear Medicine, Inc.
REFERENCES
- Received for publication September 22, 2011.
- Accepted for publication December 27, 2011.


