
Main menu

  • Home
  • Content
    • Current
    • Ahead of print
    • Past Issues
    • JNM Supplement
    • SNMMI Annual Meeting Abstracts
    • Continuing Education
    • JNM Podcasts
  • Subscriptions
    • Subscribers
    • Institutional and Non-member
    • Rates
    • Journal Claims
    • Corporate & Special Sales
  • Authors
    • Submit to JNM
    • Information for Authors
    • Assignment of Copyright
    • AQARA requirements
  • Info
    • Reviewers
    • Permissions
    • Advertisers
  • About
    • About Us
    • Editorial Board
    • Contact Information
  • More
    • Alerts
    • Feedback
    • Help
    • SNMMI Journals
  • SNMMI
    • JNM
    • JNMT
    • SNMMI Journals
    • SNMMI

User menu

  • Subscribe
  • My alerts
  • Log in
  • Log out
  • My Cart

Search

  • Advanced search
Journal of Nuclear Medicine
  • SNMMI
    • JNM
    • JNMT
    • SNMMI Journals
    • SNMMI
  • Subscribe
  • My alerts
  • Log in
  • Log out
  • My Cart
Journal of Nuclear Medicine

Advanced Search

  • Home
  • Content
    • Current
    • Ahead of print
    • Past Issues
    • JNM Supplement
    • SNMMI Annual Meeting Abstracts
    • Continuing Education
    • JNM Podcasts
  • Subscriptions
    • Subscribers
    • Institutional and Non-member
    • Rates
    • Journal Claims
    • Corporate & Special Sales
  • Authors
    • Submit to JNM
    • Information for Authors
    • Assignment of Copyright
    • AQARA requirements
  • Info
    • Reviewers
    • Permissions
    • Advertisers
  • About
    • About Us
    • Editorial Board
    • Contact Information
  • More
    • Alerts
    • Feedback
    • Help
    • SNMMI Journals
  • View or Listen to JNM Podcast
  • Visit JNM on Facebook
  • Join JNM on LinkedIn
  • Follow JNM on Twitter
  • Subscribe to our RSS feeds
Research ArticleBasic Science Investigation

Noninvasive Nuclear Imaging Enables the In Vivo Quantification of Striatal Dopamine Receptor Expression and Raclopride Affinity in Mice

Kristina Fischer, Vesna Sossi, Andreas Schmid, Martin Thunemann, Florian C. Maier, Martin S. Judenhofer, Julia G. Mannheim, Gerald Reischl and Bernd J. Pichler
Journal of Nuclear Medicine July 2011, 52 (7) 1133-1141; DOI: https://doi.org/10.2967/jnumed.110.086942
Kristina Fischer
  • Find this author on Google Scholar
  • Find this author on PubMed
  • Search for this author on this site
Vesna Sossi
  • Find this author on Google Scholar
  • Find this author on PubMed
  • Search for this author on this site
Andreas Schmid
  • Find this author on Google Scholar
  • Find this author on PubMed
  • Search for this author on this site
Martin Thunemann
  • Find this author on Google Scholar
  • Find this author on PubMed
  • Search for this author on this site
Florian C. Maier
  • Find this author on Google Scholar
  • Find this author on PubMed
  • Search for this author on this site
Martin S. Judenhofer
  • Find this author on Google Scholar
  • Find this author on PubMed
  • Search for this author on this site
Julia G. Mannheim
  • Find this author on Google Scholar
  • Find this author on PubMed
  • Search for this author on this site
Gerald Reischl
  • Find this author on Google Scholar
  • Find this author on PubMed
  • Search for this author on this site
Bernd J. Pichler
  • Find this author on Google Scholar
  • Find this author on PubMed
  • Search for this author on this site
  • Article
  • Figures & Data
  • Supplemental
  • Info & Metrics
  • PDF
Loading

Article Figures & Data

Figures

  • Tables
  • Additional Files
  • FIGURE 1.
    • Download figure
    • Open in new tab
    • Download powerpoint
    FIGURE 1.

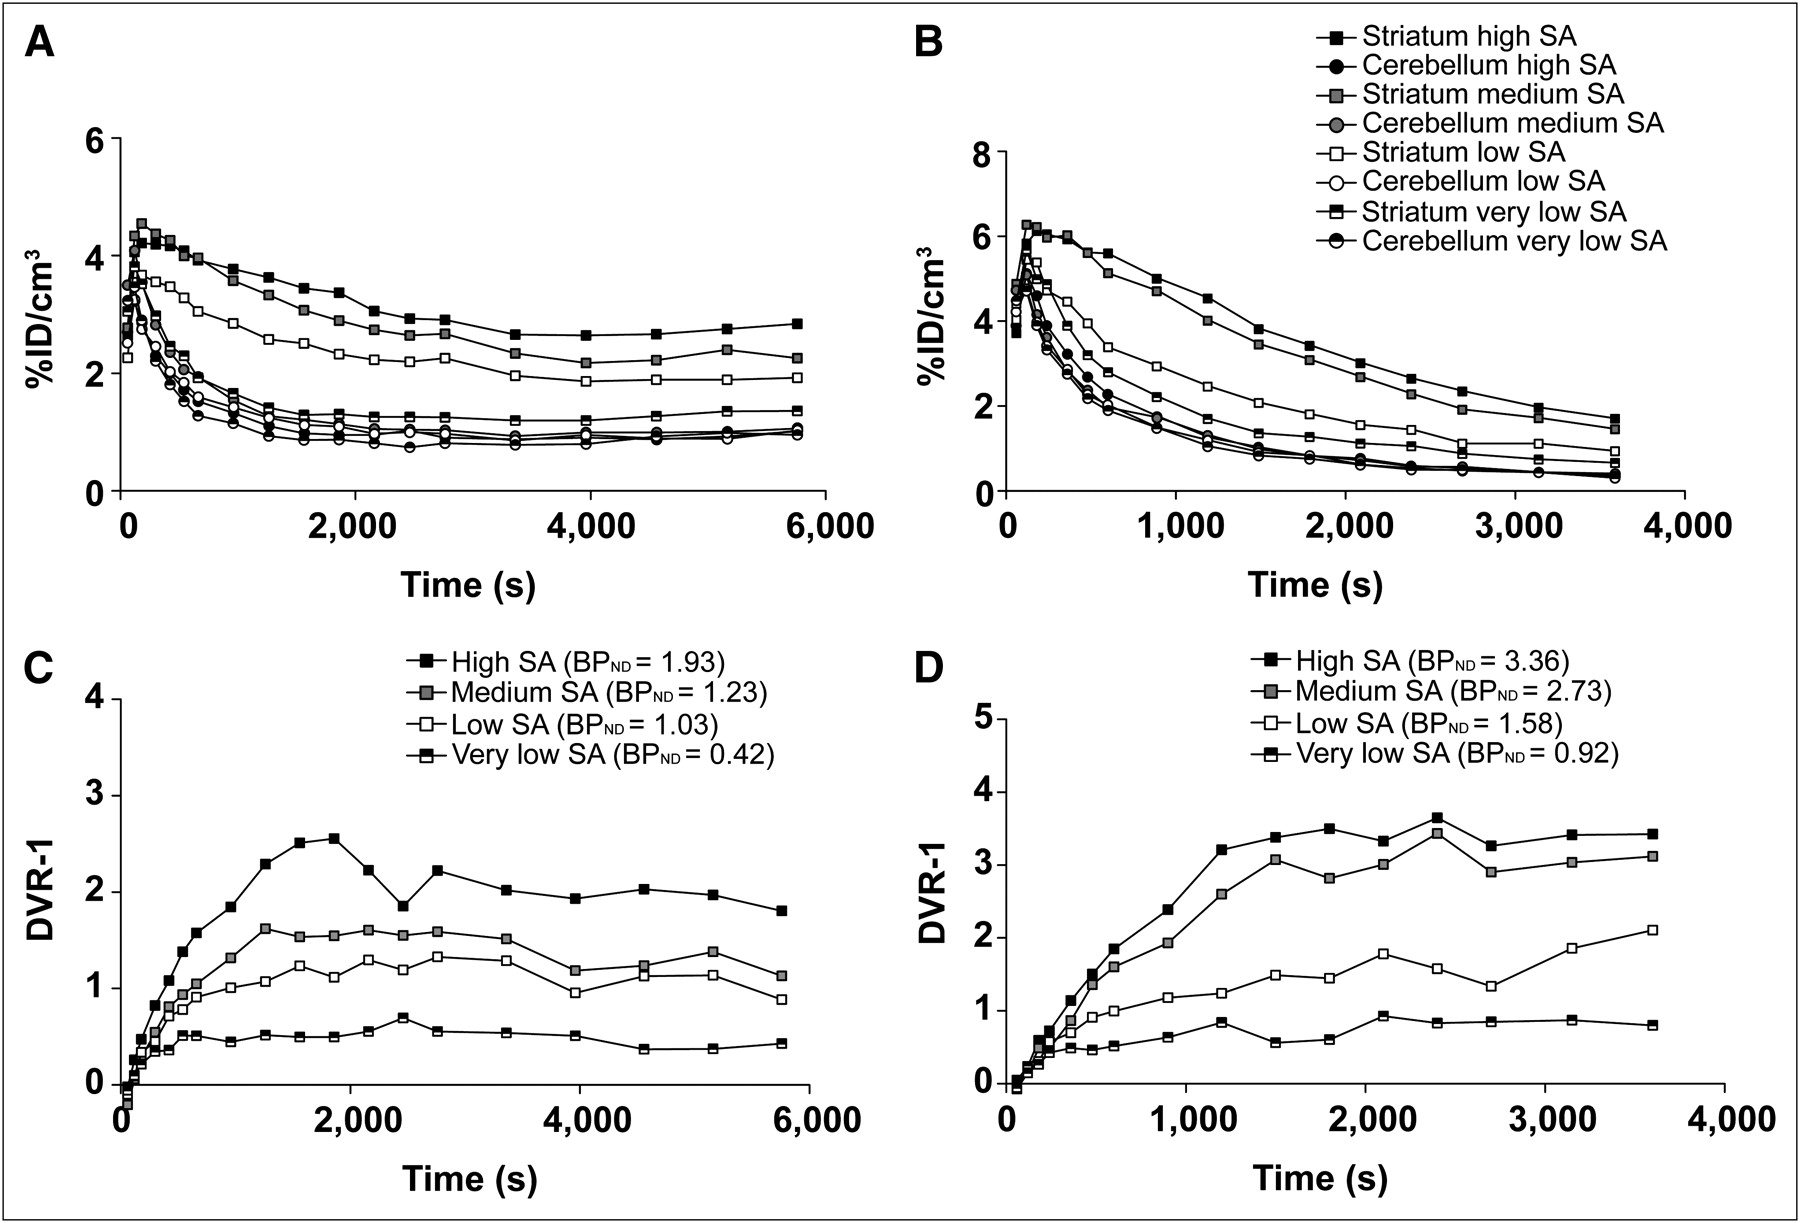
    Example of PET time–activity curves from BCI (A) and rapid BI (B) in mice. Percentage injected dose of 11C-raclopride signal is plotted over time from target (striatum) and reference (cerebellum) regions after tracer injection with decreasing SA. BCI (143, 28, 9.1, and 1.8 GBq/μmol), BI (110, 25, 9.4, and 1.9 GBq/μmol), and corresponding BPND values, calculated as DVR-1, plotted over time are shown in (C) for BCI and (D) for BI. True equilibrium in BCI experiments is reached 2,000 s after 11C-raclopride injection for all SAs. %ID = percentage injected dose.

  • FIGURE 2.
    • Download figure
    • Open in new tab
    • Download powerpoint
    FIGURE 2.

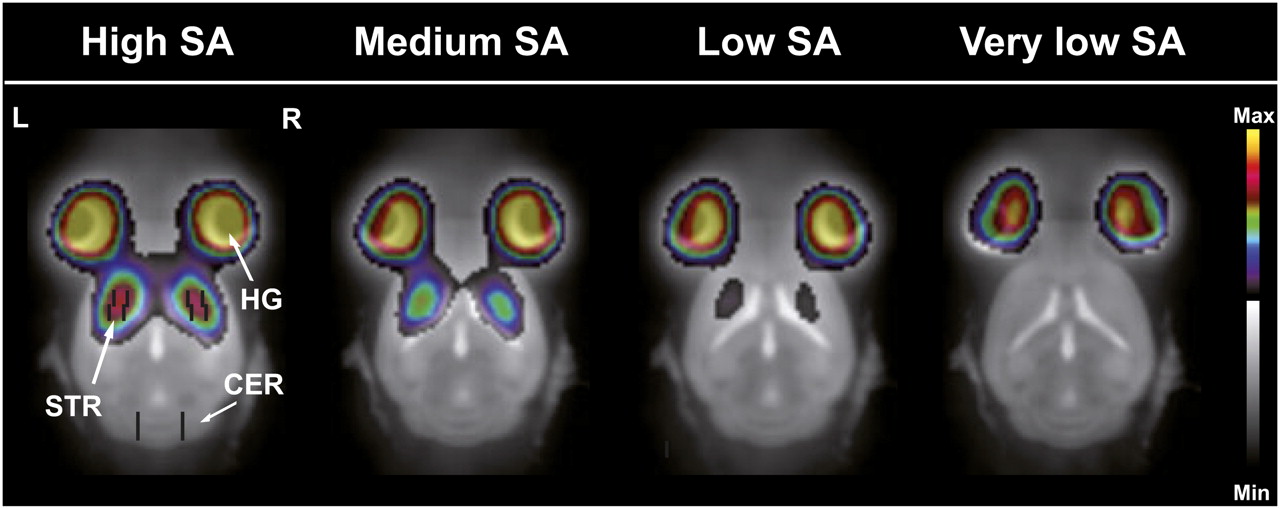
    11C-raclopride PET/MR images of mouse brain corresponding to time–activity curves (Fig. 1B) using BI protocol. Mice were scanned with decreasing SA: high SA, medium SA, low SA, and very low SA. PET images averaged over all time frames after 11C-raclopride injection are shown. PET images clearly depict large decrease in 11C-raclopride binding in striatal regions with increasing raclopride mass. Volumes of interest of striatum and cerebellum are inserted in left image to demonstrate lack of spillover from Harderian glands. CER = cerebellum; HG = Harderian glands; Max = maximum; Min = minimum; STR = striatum.

  • FIGURE 3.
    • Download figure
    • Open in new tab
    • Download powerpoint
    FIGURE 3.

    (A) Dose–response curve: BPND calculated from Logan graphical analysis was plotted as function of raclopride dose in nmol/kg of body weight. Graph clearly shows that raclopride dose of 4 nmol/kg or more decreases BPND estimates. (B) Occupancy plots as function of raclopride dose (nmol/kg). Injected raclopride dose of 4.5 nmol/kg (1.7 μg/kg) yielded approximately 10% receptor occupancy, corresponding to SA value of 100 GBq/μmol.

  • FIGURE 4.
    • Download figure
    • Open in new tab
    • Download powerpoint
    FIGURE 4.

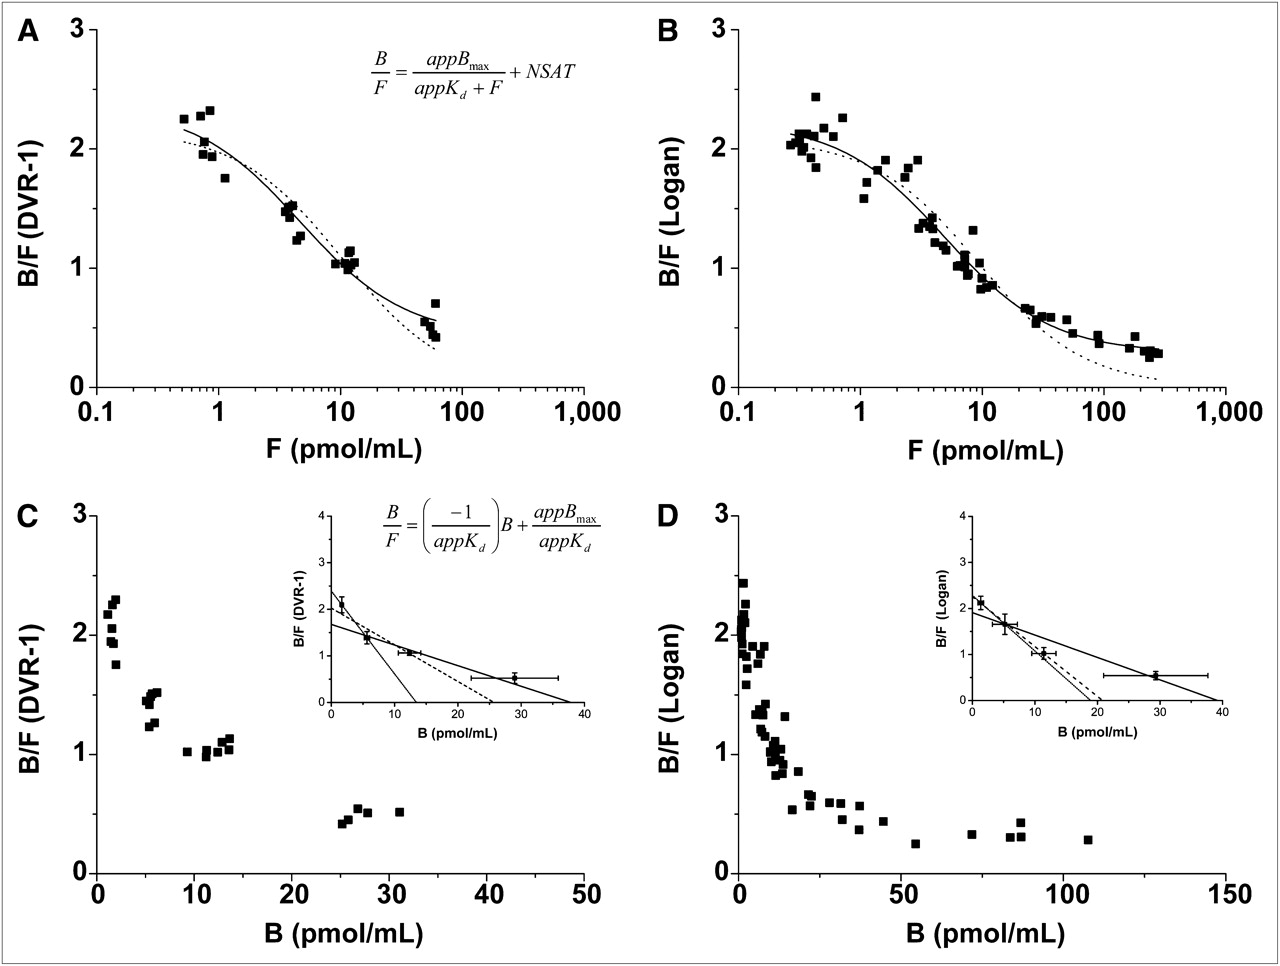
    Quantification of 11C-raclopride PET data assuming single-binding-site model. Data were generated from BCI (n = 7) (A) and BI (n = 12) (B) experiments using decreasing SA for each mouse. To determine appBmax and appKd, BPND values were plotted against free tracer concentration (F), which was estimated from cerebellum. Nonlinear regression analysis was applied to data, and best fits were obtained when nonsaturable binding was included in fit (solid line = NSAT term, dotted line = without NSAT term). Ratio of bound to free 11C-raclopride concentration (B/F) was plotted as function of bound 11C-raclopride concentration (B) using Scatchard analysis. Plots from BCI (C) and BI (D) experiments did not show linear relationship. Linear regression lines from 2-, 3-, and 4-point Scatchard plots are shown as insets. x-intercept and slope were used to calculate appBmax and appKd. Values are shown in Supplemental Table 4.

  • FIGURE 5.
    • Download figure
    • Open in new tab
    • Download powerpoint
    FIGURE 5.

    (A) Example of sagittal brain slice from ex vivo high-resolution autoradiography experiments (left) shows 11C-raclopride distribution in mouse brain 60 min after intravenous injection. Image clearly reveals highly specific accumulation of 11C-raclopride in striatum and low nonspecific accumulation in cerebellum. Corresponding brain regions were visualized using hematoxylin and eosin staining (right) for accurate volume-of-interest placement. (B) Autoradiography counts from 100 and 120 consecutive brain slices of striatum and cerebellum, respectively. Increase is seen in 11C-raclopride signal through left and right striata and more uniform distribution throughout cerebellum. Highest signal intensities were used for calculation of BPND. (C) Comparison of BPND values from autoradiography and PET experiments. BPND (calculated as DVR-1) was not significantly different from in vivo PET data and revealed good correlation between methods (R2 = 0.98). AR = autoradiography; BPND = binding potential; CER = cerebellum; STR = striatum.

Tables

  • Figures
  • Additional Files
    • View popup
    TABLE 1

    Test–Retest Variability and Reliability of BPND Estimates

    MethodScan 1 (mean ± SD)Scan 2 (mean ± SD)VariabilityReliability
    SRTM2.04 ± 0.261.99 ± 0.110.070.46
    Logan2.05 ± 0.302.03 ± 0.140.080.53
    DVR-12.99 ± 0.393.0 ± 0.270.080.47
    • Statistical comparisons within and between animals were performed using 1-way ANOVA.

Additional Files

  • Figures
  • Tables
  • Supplemental Data

    Files in this Data Supplement:

    • Supplemental Data
PreviousNext
Back to top

In this issue

Journal of Nuclear Medicine: 52 (7)
Journal of Nuclear Medicine
Vol. 52, Issue 7
July 1, 2011
  • Table of Contents
  • Table of Contents (PDF)
  • About the Cover
  • Index by author
Print
Download PDF
Article Alerts
Sign In to Email Alerts with your Email Address
Email Article

Thank you for your interest in spreading the word on Journal of Nuclear Medicine.

NOTE: We only request your email address so that the person you are recommending the page to knows that you wanted them to see it, and that it is not junk mail. We do not capture any email address.

Enter multiple addresses on separate lines or separate them with commas.
Noninvasive Nuclear Imaging Enables the In Vivo Quantification of Striatal Dopamine Receptor Expression and Raclopride Affinity in Mice
(Your Name) has sent you a message from Journal of Nuclear Medicine
(Your Name) thought you would like to see the Journal of Nuclear Medicine web site.
Citation Tools
Noninvasive Nuclear Imaging Enables the In Vivo Quantification of Striatal Dopamine Receptor Expression and Raclopride Affinity in Mice
Kristina Fischer, Vesna Sossi, Andreas Schmid, Martin Thunemann, Florian C. Maier, Martin S. Judenhofer, Julia G. Mannheim, Gerald Reischl, Bernd J. Pichler
Journal of Nuclear Medicine Jul 2011, 52 (7) 1133-1141; DOI: 10.2967/jnumed.110.086942

Citation Manager Formats

  • BibTeX
  • Bookends
  • EasyBib
  • EndNote (tagged)
  • EndNote 8 (xml)
  • Medlars
  • Mendeley
  • Papers
  • RefWorks Tagged
  • Ref Manager
  • RIS
  • Zotero
Share
Noninvasive Nuclear Imaging Enables the In Vivo Quantification of Striatal Dopamine Receptor Expression and Raclopride Affinity in Mice
Kristina Fischer, Vesna Sossi, Andreas Schmid, Martin Thunemann, Florian C. Maier, Martin S. Judenhofer, Julia G. Mannheim, Gerald Reischl, Bernd J. Pichler
Journal of Nuclear Medicine Jul 2011, 52 (7) 1133-1141; DOI: 10.2967/jnumed.110.086942
Twitter logo Facebook logo LinkedIn logo Mendeley logo
  • Tweet Widget
  • Facebook Like
  • Google Plus One
Bookmark this article

Jump to section

  • Article
    • Abstract
    • MATERIALS AND METHODS
    • RESULTS
    • DISCUSSION
    • CONCLUSION
    • DISCLOSURE STATEMENT
    • Acknowledgments
    • REFERENCES
  • Figures & Data
  • Supplemental
  • Info & Metrics
  • PDF

Related Articles

  • This Month in JNM
  • PubMed
  • Google Scholar

Cited By...

  • In Vivo Evaluation of 11C-DASB for Quantitative SERT Imaging in Rats and Mice
  • In Vivo Measurement of the Affinity and Density of Metabotropic Glutamate Receptor Subtype 1 in Rat Brain Using 18F-FITM in Small-Animal PET
  • In Vivo Dopamine Transporter Imaging in a Unilateral 6-Hydroxydopamine Rat Model of Parkinson Disease Using 11C-Methylphenidate PET
  • Google Scholar

More in this TOC Section

  • Designed Ankyrin Repeat Protein–Mediated Peptide Nucleic Acid–Based Pretargeting: A Proof-of-Principle Study
  • [11C]ZTP-1: An Effective Short-Lived Radioligand for PET of Rat and Monkey Brain Phosphodiesterase Type 4 Subtype B
  • Reduced Renal Uptake of Various Radiopharmaceuticals with Sodium Paraaminohippurate Coadministration in a Rat Model
Show more Basic Science Investigation

Similar Articles

SNMMI

© 2025 SNMMI

Powered by HighWire