


Abstract
The increasing use of genetically engineered mice as animal models of human disease in biomedical research, latest advances in imaging technologies, and development of novel, highly specific radiolabeled biomarkers provide great potential to study receptor expression and gene function in vivo in mice. 11C-raclopride is a widely used PET tracer to measure striatal D2 receptor binding and was used to test the feasibility of the multiple-ligand-concentration receptor assay for D2 receptor quantification. Methods: Mice underwent a total of 4 scans with decreasing specific activities from 141 to 0.4 GBq/μmol, corresponding to 11C-raclopride injected doses of 2.4 to 1,274 nmol/kg, using either a standard bolus injection protocol (n = 12) or a bolus–plus–constant infusion protocol to attain true equilibrium conditions (n = 7). Receptor occupancy was plotted as a function of raclopride dose, and D2 receptor density and raclopride affinity were calculated using linear and nonlinear regression analysis, respectively. In addition, we used ex vivo autoradiography, a more spatially accurate imaging technology, to validate the in vivo PET measurements, and we performed test–retest experiments to determine the reproducibility and reliability of the PET-derived measures. Results: The receptor occupancy curves showed that an injected tracer dose of 4.5 nmol/kg induces approximately 10% receptor occupancy, whereas 1% receptor occupancy will be achieved at tracer doses of approximately 0.45 nmol/kg. Using the bolus injection protocol and nonlinear regression analysis, we determined that the average D2 receptor density was 9.6 ± 1.1 pmol/mL, and the apparent raclopride affinity was 5.0 ± 0.6 pmol/mL. These values agreed well with those obtained at true equilibrium conditions. In contrast, linear Scatchard analysis did not lead to the expected linear relationship because nonsaturable binding was observed at high raclopride concentrations, and thus, it seems to be unsuitable for quantitative 11C-raclopride analysis in mice. Conclusion: Our data showed that the tracer mass, if higher than 4 nmol/kg, can strongly affect binding parameter estimations and must be considered when performing kinetic analysis, specifically in mice. We also demonstrated that the in vivo determination of D2 receptor density and raclopride affinity is feasible in mice using multiple-injection protocols and nonlinear regression analysis.
The interest in noninvasive functional and metabolic imaging of transgenic animal models of human disease has increased tremendously over the last several years. For this purpose, dedicated small-animal PET systems with improved spatial resolution and highly specific radiolabeled biomarkers have become available. Among them is the benzamide dopamine antagonist 11C-raclopride, a widely used PET biomarker to measure D2 receptor binding characteristics in humans (1–3), nonhuman primates (4–6), and rats (7–11). Given the small size of the mouse brain and, in particular, the D2 receptor–rich striatum, which has a volume of only about 1 mm3, high spatial resolution and detection sensitivity of the PET scanner are mandatory. If the administered tracer mass is above a certain range, typically assumed to result in 1%–5% receptor occupancy in the region of interest (12), the resulting measurement might violate the tracer principle (13), yielding an inaccurate representation of the process under investigation and unwanted pharmacologic effects by the tracer itself.
The aim of our study was to determine the methodologic limitations of PET for the in vivo quantification of dopamine D2–type receptor binding in the striatum of healthy mice using 11C-raclopride. We investigated the relationship among specific activity (SA), injected dose, and receptor occupancy for 11C-raclopride and used postmortem autoradiography, a high-resolution but invasive imaging technique, to cross-validate the in vivo PET measurements.
In small rodents, collecting multiple arterial blood samples is difficult and, in most cases (especially in mice), not feasible, if multiple experiments are to be performed on a single animal. Here, we established a protocol without arterial blood sampling to attain true equilibrium conditions (14). We further evaluated the applicability of 3 widely used reference tissue methods to estimate the binding potential (BPND) (15) in mice using 11C-raclopride: the simplified reference tissue model (SRTM) (16), the Logan graphical approach (17), and the ratio method (DVR-1) (18,19).
To determine receptor availability (appBmax) and apparent ligand affinity (appKd) separately, we tested the feasibility of the multiple-ligand-concentration receptor assay (MLCRA) (6) at true (secular) equilibrium and pseudo-equilibrium.
MATERIALS AND METHODS
Animals
Twenty-three male C57BL/6 mice, between 12 and 16 wk of age and with a weight of 27 ± 2 g (Charles River), were used: 19 mice for MLCRA (12 for bolus injection [BI] experiments and 7 for bolus–plus–constant infusion [BCI] experiments) and an additional 4 mice for ex vivo autoradiography experiments. All animals were maintained in our vivarium on a 12-h light cycle, at 22°C room temperature, and 40%–60% humidity with free access to standard diet and tap water for 7 d before the experiments started. All of the animal experiments were approved by the appropriate governmental agency.
Radiotracer Synthesis
11C-raclopride was synthesized as described elsewhere (20). The SA was determined at the end of synthesis and was 133 ± 17 GBq/μmol at the time of injection when not mixed with the cold ligand.
Small-Animal PET Experiments
The PET experiments were performed with an Inveon dedicated small-animal PET scanner (Siemens) (21). The mice were anesthetized with 1.5% isoflurane vaporized in 1.0 L/min of oxygen gas. A 30-gauge injection needle connected to a 15-cm-long flexible tube with a 0.28-mm inner diameter and filled with heparinized saline was placed inside the tail vein. The animals were placed head-to-head in the center of the field of view on dedicated mouse beds (Medres) with stereotactic holders and a cone fit over the nose, ensuring the delivery and removal of the anesthesia gas without animal movement and stabilizing the body temperature of the animal at 37°C using a rectal temperature probe with a feedback control unit. For the BI experiments, a 60-min PET emission scan was obtained, starting immediately before tracer injection through the tail vein catheter, followed by flushing of the catheter with 50 μL of heparinized saline. The total injected volume of the tracer and flush was 100 ± 50 μL, corresponding to an injected radioactivity dose of 427 ± 42 MBq/kg of body weight. The injection was performed manually within 5 s.
For the BCI experiments, a 90-min emission scan was obtained, starting with the bolus tracer injection via computer-controlled infusion pumps (Harvard Apparatus). The tracer concentration was adjusted to 148 MBq/mL. For the bolus part of the injection, a 439 ± 48 MBq/kg dose of 11C-raclopride was injected in 88 μL (+32 μL of tube dead volume) within 5 s at a pump speed of 1.44 mL/min. After the completion of the bolus application, the remaining radioactivity (13 MBq) was infused at a rate of 1 μL/min over 90 min. The total injected volume per mouse in BCI experiments was 210 μL over 90 min. The BCI rate corresponds to a Kbol of 88 min (i.e., the bolus dose was equal to 88 min of infusion) and was based on preliminary experiments (data not shown).
Data correction, framing and reconstruction, volume-of-interest definition, and receptor binding parameters from linear and nonlinear regression analysis, as well as reproducibility, reliability, and receptor occupancy determination, are described in detail in the supplemental information (supplemental materials are available online only at http://jnm.snmjournals.org).
RESULTS
Kinetic Analysis
Representative decay-corrected time–activity curves of the striatum and cerebellum from 1 mouse after tracer BCI and BI from high-, medium-, low-, and very-low-SA scans are shown in Figures 1A and 1B, and the corresponding ratios (DVR-1) are displayed in Figures 1C and 1D. The BCI approach was successful at reaching true equilibrium conditions between the target (striatum) and reference (cerebellum) regions between 1,000 and 2,000 s after the start of tracer injection (Fig. 1C). For the low-SA scans, equilibrium conditions were reached sooner, because of less specific binding. The corresponding images obtained from the BI experiments at different SA values are shown in Figure 2 and depict a dose-dependent decrease in 11C-raclopride binding in the striatum with increasing raclopride mass.
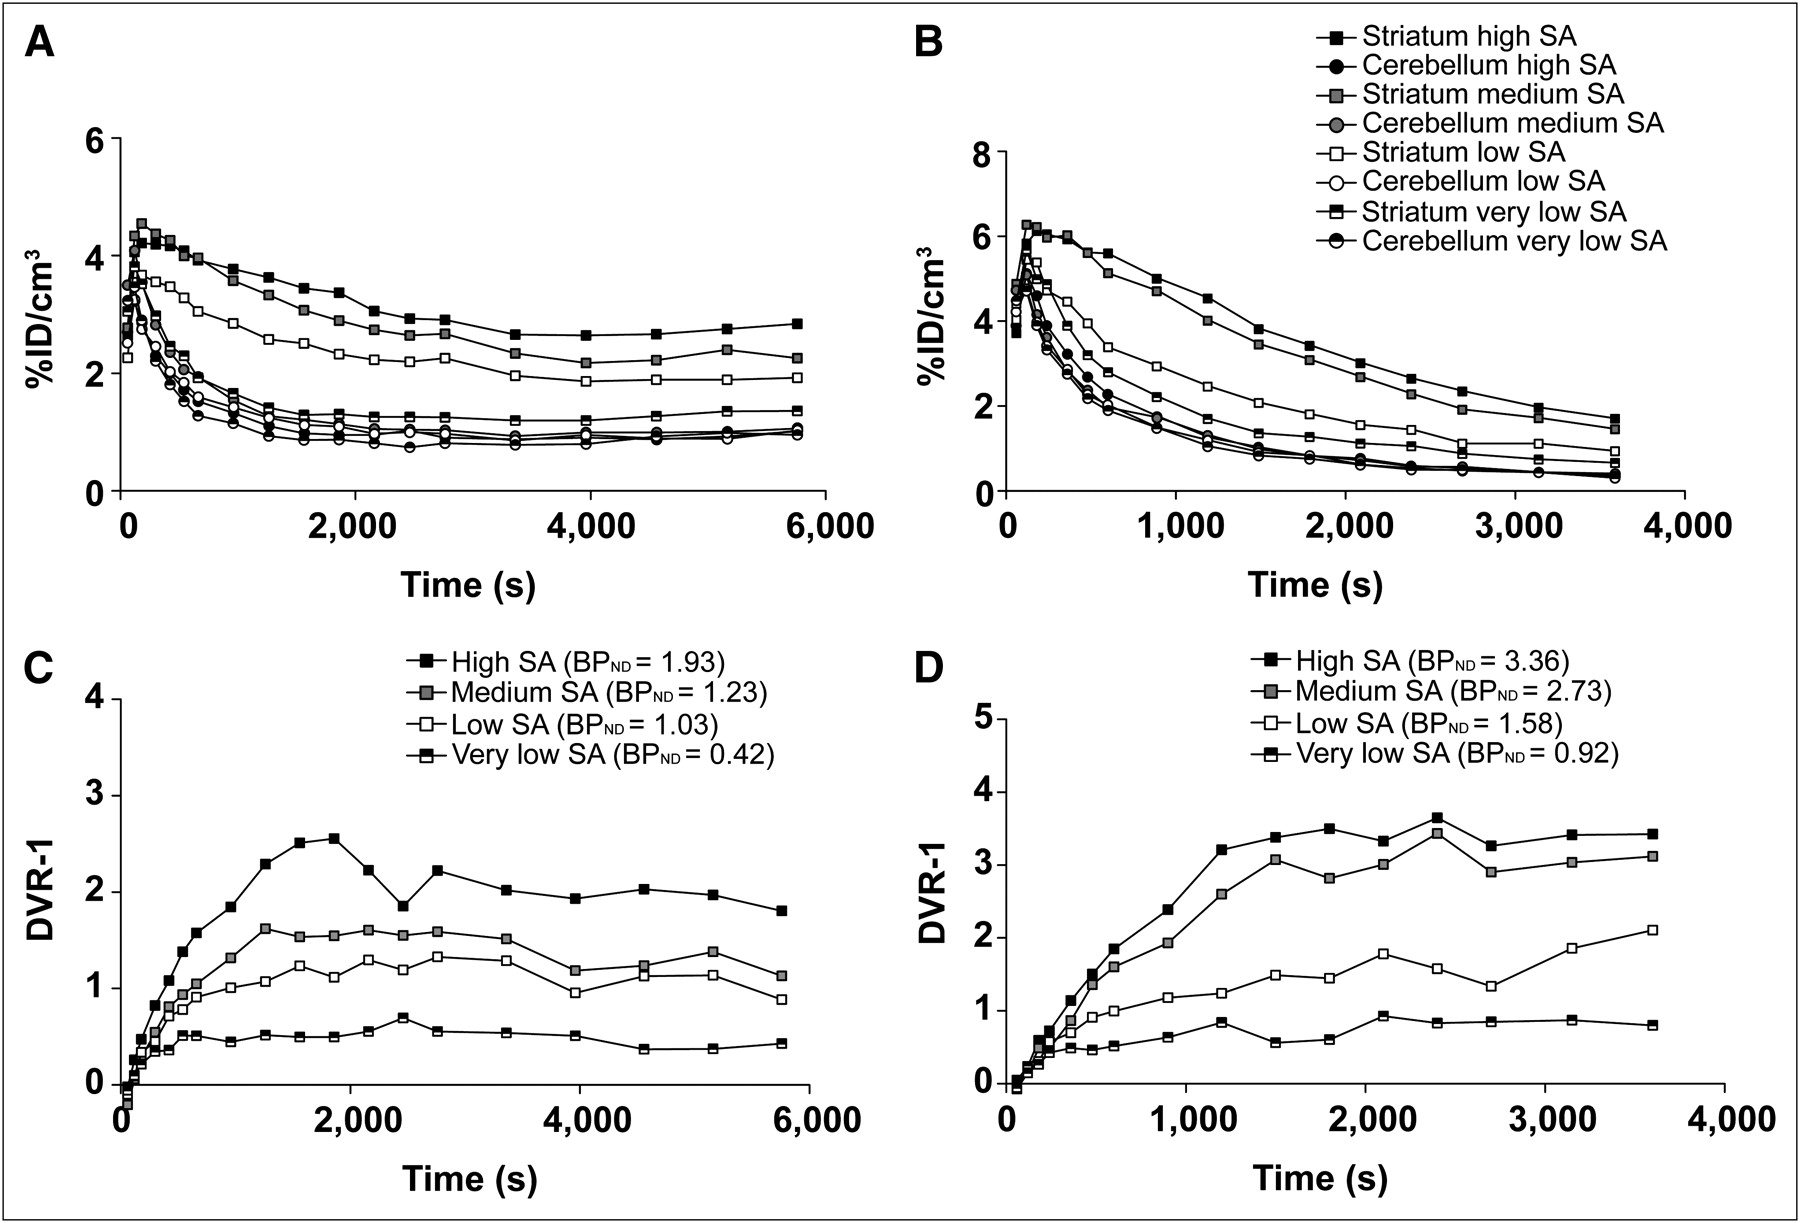
Example of PET time–activity curves from BCI (A) and rapid BI (B) in mice. Percentage injected dose of 11C-raclopride signal is plotted over time from target (striatum) and reference (cerebellum) regions after tracer injection with decreasing SA. BCI (143, 28, 9.1, and 1.8 GBq/μmol), BI (110, 25, 9.4, and 1.9 GBq/μmol), and corresponding BPND values, calculated as DVR-1, plotted over time are shown in (C) for BCI and (D) for BI. True equilibrium in BCI experiments is reached 2,000 s after 11C-raclopride injection for all SAs. %ID = percentage injected dose.
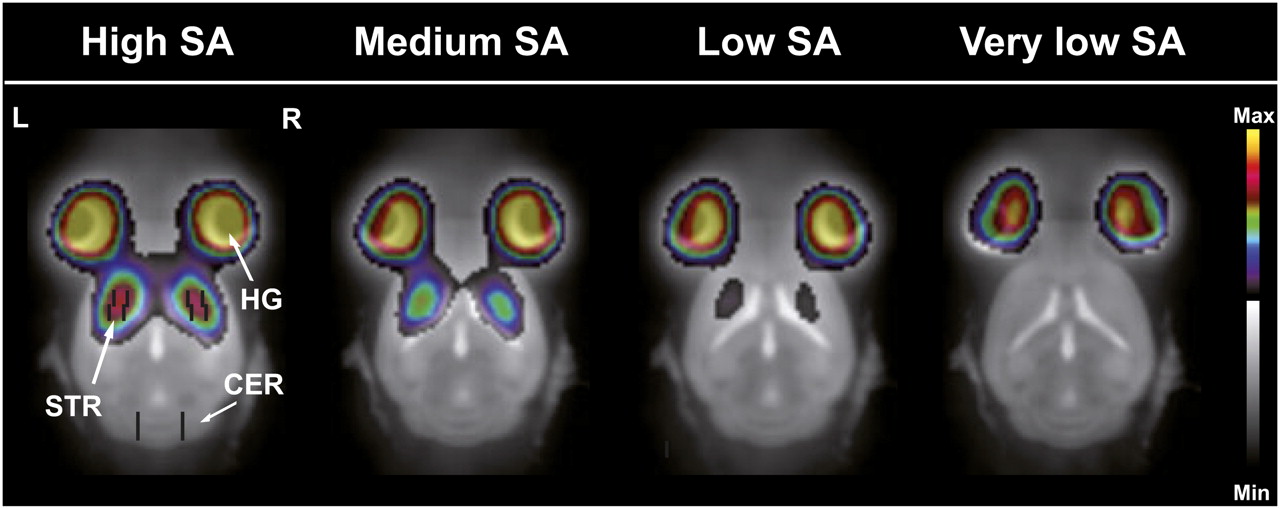
11C-raclopride PET/MR images of mouse brain corresponding to time–activity curves (Fig. 1B) using BI protocol. Mice were scanned with decreasing SA: high SA, medium SA, low SA, and very low SA. PET images averaged over all time frames after 11C-raclopride injection are shown. PET images clearly depict large decrease in 11C-raclopride binding in striatal regions with increasing raclopride mass. Volumes of interest of striatum and cerebellum are inserted in left image to demonstrate lack of spillover from Harderian glands. CER = cerebellum; HG = Harderian glands; Max = maximum; Min = minimum; STR = striatum.
The BPND values calculated from DVR-1 and Logan graphical analysis from the BCI experiments at all SAs were strongly correlated (Logan = 0.96(DVR-1) − 0.01, R2 = 0.97). Using the BI approach, regression analysis of the BPND values from SRTM and Logan graphical analysis revealed for all SAs a strong correlation and similar values (SRTM = 1.02(Logan) − 0.09, R2 = 0.99). The DVR-1 from the last 30 min of the BI time–activity curves (Fig. 1D) exhibited significantly higher BPND values at all of the SAs, compared with the Logan graphical analysis (P < 0.001), but the correlation between the methods was still good (DVR-1 = 1.51(Logan) − 0.08, R2 = 0.97). The methods and fits for the calculation of BPND and the regression analysis between the described methods are displayed in Supplemental Figures 1 and 2.
Test–Retest Analysis
The BPND, test–retest variability, and test–retest reliability values were determined from 8 mice and are summarized in Table 1. The SA ranged from 80 to 180 GBq/μmol, corresponding to an injected mass of 1.7–0.9 μg/kg and an 4%–8% receptor occupancy, which we considered to be high-SA measurements. The test–retest variability was relatively small and similar for the 3 methods, ranging from 7% to 8%, whereas the test–retest reliability was only moderate, ranging from 46% to 53%.
Test–Retest Variability and Reliability of BPND Estimates
Determination of Receptor Occupancy: Tracer Dose and SA
The dependency of the BPND values on the injected raclopride mass is shown in Figure 3A. The highest BPND values that were calculated from Logan analysis ranged from 1.7 to 2.5 and were obtained at a radioactivity dose of 446 ± 29 MBq/kg with a high SA of 92–224 GBq/μmol, corresponding to a dose of 1.8–4.9 nmol/kg of body weight. The BPND values in this range did not correlate with SA (BPND = −0.00008 (SA) + 2.3832, R2 = 0.15). On the basis of the fits of the dose–response curves (Fig. 3A) using Equation 6 (supplemental information), the median effective dose (ED50) in the mouse striatum was estimated to be 37 ± 5 nmol/kg of body weight, and the appBmax was estimated to be 70 ± 2 nmol/kg. The nonsaturable tissue uptake (NSAT) estimated at high doses of the stable ligand was 0.25 ± 0.05. The fits that used this additional NSAT term were better than those that did not, as agrees well with the literature (0.16 ± 0.02 in rats (22)).

(A) Dose–response curve: BPND calculated from Logan graphical analysis was plotted as function of raclopride dose in nmol/kg of body weight. Graph clearly shows that raclopride dose of 4 nmol/kg or more decreases BPND estimates. (B) Occupancy plots as function of raclopride dose (nmol/kg). Injected raclopride dose of 4.5 nmol/kg (1.7 μg/kg) yielded approximately 10% receptor occupancy, corresponding to SA value of 100 GBq/μmol.
Figure 3B shows the receptor occupancy plotted as a function of the tracer dose per kilogram of body weight (nmol/kg; R2 = 0.92).
The best fit to our data was obtained with an appKd of 0.09 ± 0.004 μmol/GBq, corresponding to 41.84 ± 2.09 nmol/kg of body weight or 14.53 ± 0.7 μg/kg of body weight, using Equation 8 (supplemental information). Using this fit, we extrapolated the occupancy curve to estimate 1% and 10% occupancy. An SA of 100 GBq/μmol, a raclopride dose of 4.5 nmol/kg, and an amount of 1.7 μg/kg resulted in 10% receptor occupancy. In contrast, an SA of 1,000 GBq/μmol, a raclopride dose of 0.45 nmol/kg, and an amount of 0.17 μg/kg resulted in 1% receptor occupancy.
Determination of appBmax and appKd (MLCRA)
Assuming a single-binding-site model and using the concentration in the cerebellum as an estimate for the free ligand concentration (Eqs. 11 and 12, supplemental information), we calculated the mean appBmax, appKd, and NSAT values using nonlinear regression analysis for all BCI (Fig. 4A) and BI experiments (Fig. 4B; summarized in Supplemental Table 2). Nonlinear regression analysis using the NSAT term resulted in lower values for appBmax and appKd (9.03 ± 1.79 pmol/mL and 4.68 ± 0.93 nM, respectively) than without it (22.40 ± 2.52 pmol/mL and 10.37 ± 1.44 mM, respectively). Analysis using the 2-binding-site model (Eq. 13, supplemental information) did not lead to reasonable fits (data are shown in Supplemental Table 3). As shown in Figures 4C and 4D, Scatchard analysis of all of the mice did not lead to the expected linear relationship at all of the ligand concentrations but, rather, produced a curved relationship with nonsaturable binding at high raclopride doses. The values of appBmax and appKd, the BPND, and the correlation coefficients (R2) calculated from 2-, 3-, and 4-point Scatchard analysis are summarized in Supplemental Table 4, and the linear plots are represented in the insets of Figures 4C and 4D. Calculation of bound (B) as striatum minus cerebellum gave overall higher values than calculation from the ratio of the bound to the free (F) tracer concentration B/F × F. For determination of receptor binding parameters, see supplemental information.
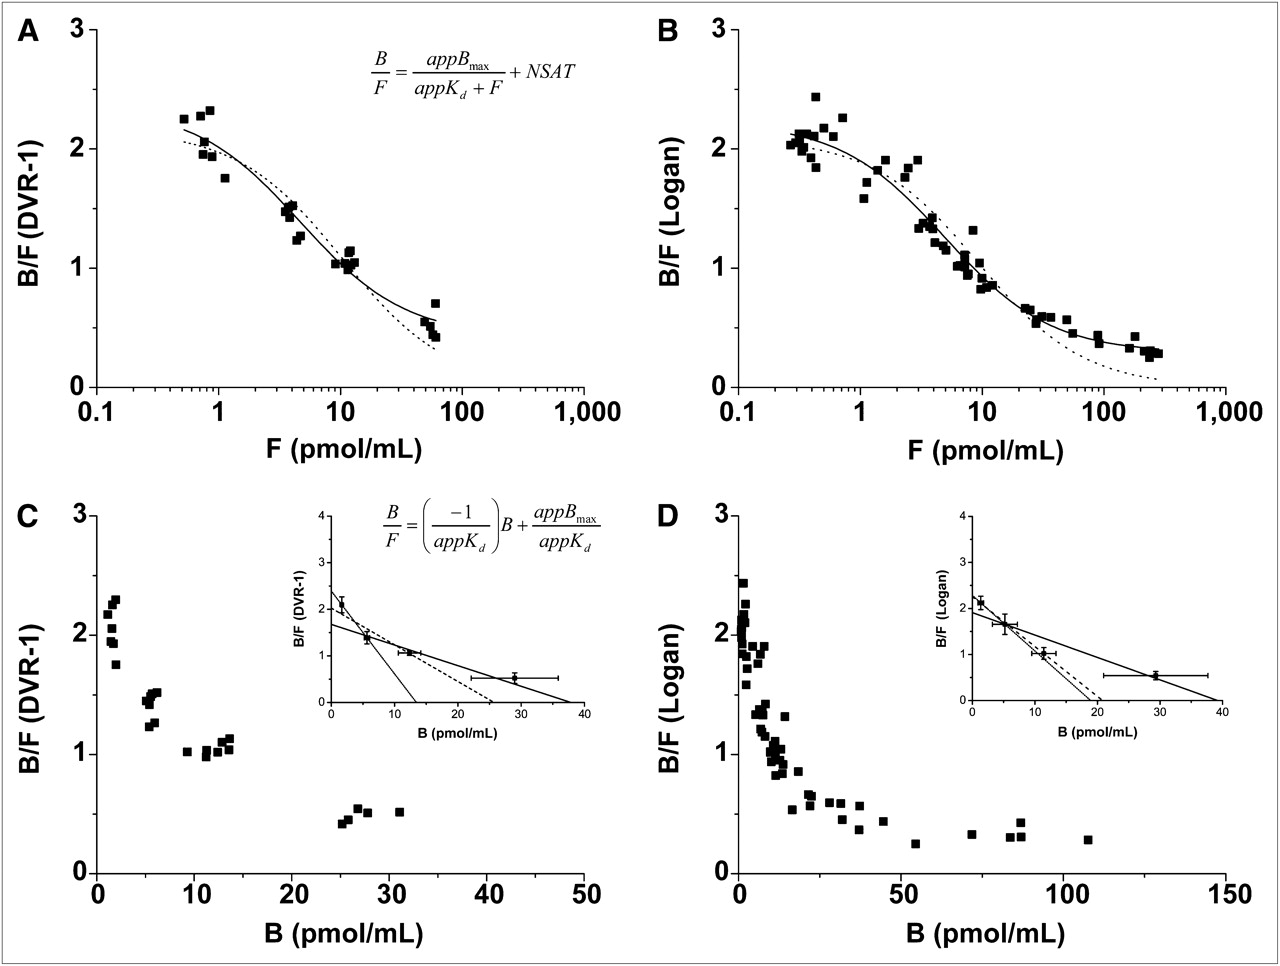
Quantification of 11C-raclopride PET data assuming single-binding-site model. Data were generated from BCI (n = 7) (A) and BI (n = 12) (B) experiments using decreasing SA for each mouse. To determine appBmax and appKd, BPND values were plotted against free tracer concentration (F), which was estimated from cerebellum. Nonlinear regression analysis was applied to data, and best fits were obtained when nonsaturable binding was included in fit (solid line = NSAT term, dotted line = without NSAT term). Ratio of bound to free 11C-raclopride concentration (B/F) was plotted as function of bound 11C-raclopride concentration (B) using Scatchard analysis. Plots from BCI (C) and BI (D) experiments did not show linear relationship. Linear regression lines from 2-, 3-, and 4-point Scatchard plots are shown as insets. x-intercept and slope were used to calculate appBmax and appKd. Values are shown in Supplemental Table 4.
Autoradiography
The distribution of 11C-raclopride in representative fresh-frozen mouse brain slices is shown in Figure 5A. A strong accumulation of 11C-raclopride in the striatum and only faint accumulation in the cerebellum were found. Figure 5B shows the autoradiography counts from 120 (striatum) and 100 (cerebellum) consecutive sagittal brain slices, with zero at the beginning of the striatum and cerebellum extending from the medial to the lateral aspects of the brain. We observed a clear gradient in the radioactivity distribution from the medial to the lateral parts of the striatum, with maximum activity in the lateral striatum and more stable values throughout the cerebellum. The striatal slices with the highest radioactivity concentrations were selected for region-of-interest definition to achieve a reasonable comparison to the measured PET data.

(A) Example of sagittal brain slice from ex vivo high-resolution autoradiography experiments (left) shows 11C-raclopride distribution in mouse brain 60 min after intravenous injection. Image clearly reveals highly specific accumulation of 11C-raclopride in striatum and low nonspecific accumulation in cerebellum. Corresponding brain regions were visualized using hematoxylin and eosin staining (right) for accurate volume-of-interest placement. (B) Autoradiography counts from 100 and 120 consecutive brain slices of striatum and cerebellum, respectively. Increase is seen in 11C-raclopride signal through left and right striata and more uniform distribution throughout cerebellum. Highest signal intensities were used for calculation of BPND. (C) Comparison of BPND values from autoradiography and PET experiments. BPND (calculated as DVR-1) was not significantly different from in vivo PET data and revealed good correlation between methods (R2 = 0.98). AR = autoradiography; BPND = binding potential; CER = cerebellum; STR = striatum.
In Figure 5C, the BPND estimates of individual mouse brains are shown, calculated as DVR-1 from the autoradiography counts and compared with the DVR-1 calculated from the average of the last 30 min of the PET time–activity curves. In addition, the Logan graphical approach and SRTM were applied to the PET data. Regression analysis of the BPND values estimated from the autoradiography counts and PET analysis using the DVR-1 were strongly correlated (y = 1.09 × −0.0002, R2 = 0.98).
DISCUSSION
So far, few in vivo imaging studies have focused on investigating the dopaminergic system in mice (23–30). However, the ability to study genetically modified mice in neuroscience using PET depends on the careful evaluation of the PET methodology and its in vivo quantification accuracy. There are 3 main methodologic limitations of small-animal PET that have to be characterized before receptor quantification experiments can reliably be performed: the effect of tracer mass, estimation of the binding parameters from BI experiments, and potential impact of the PET scanner performance and partial-volume effect (PVE) on quantification.
Tracer Mass
An important potential limitation is the effect of tracer mass on binding sites. Pharmacokinetic modeling is based on the assumption that the concentration of available receptor sites (appBmax) is constant and that only a negligible number of receptor sites are occupied by nonradioactive carrier molecules during a PET experiment. For in vivo binding studies, an occupancy by nonradioactive ligands of 1% or less has been suggested to support the PET tracer principle (13), avoiding the possibility that the tracer mass produces pharmacologic effects. The extrapolated receptor occupancy curve (Fig. 3) shows that an injected dose of 0.45 nmol/kg (0.17 μg/kg) results in approximately 1% occupancy, corresponding to an SA value of 1,000 GBq/μmol for an injected dose of 427 ± 42 MBq/kg of body weight. In contrast, 10% occupancy is achieved at an injected dose of 4.5 nmol/kg (1.7 μg/kg), corresponding to an SA of 100 GBq/μmol. Because a tracer dose of 0.5 nmol/kg can hardly be achieved with current tracer synthesis modules to meet the requirement of 1% occupancy, we suggest a less stringent threshold dose of less than 4 nmol/kg, leading to less than 10% receptor occupancy. However, another possibility that will reduce the amount of unlabeled raclopride injected into the animal is a reduced amount of injected radioactivity (280 MBq/kg instead of 480 MBq/kg), which is possible if the scanner's sensitivity is sufficiently high. An occupancy of more than 10% requires careful matching of the coinjected ligand dose between individuals in paired studies, to account for the pharmacologically evoked effects.
Kinetic Analysis
Differentiating specific and nonspecific receptor binding is the second major challenge in quantitative PET experiments. Because mice have a small blood volume of about 1.7 mL, blood sampling (which is used for accurate quantification in humans, baboons, and rats) is not feasible. Here, we established the BCI approach in mice to attain true equilibrium and compared the obtained BPND values to those from the BI experiments. On average, the BPND values obtained by the BI protocol and either the Logan method or SRTM agree well with those obtained by the BCI protocol. Thus, the assumptions required by both simplified methods are satisfied for 11C-raclopride imaging in mice. The Logan method was found to be insensitive to the k2′ (tracer transfer from reference region [cerebellum] to plasma), as expected, given its high value and given that it produced values that were consistent with the BCI method throughout the range of explored SAs. In contrast, the k2′ value yielded by the SRTM at a low SA was inaccurate and led to a biased BPND (data not shown), suggesting that this method is less reliable at low SA values, if not constrained a priori (31). The estimate of the BPND from the ratio method as DVR-1 in the BI experiments gave higher values than those estimated from the modeling approaches and does not represent the true DVR. This estimate agrees well with human studies and results from the decline in the plasma radioactivity over time (17). However, the method showed a strong correlation with the modeling approaches and is easy to use because it does not require any fitting procedures. Furthermore, it agreed well with the DVR-1 determined by ex vivo autoradiography.
Test–retest variability and the reliability at a high SA were similar between the 2 analysis methods and agreed well with the data from humans (2,18,32,33), baboons (34), and rats (11). In contrast to the low intrasubject variability of 8% in our mouse brain studies, we found considerable intersubject variability, as agrees with the results of Volkow et al. (18) and Alexoff et al. (11). Alexoff et al. found an intrasubject variability of 8% and a coefficient of variation of 22% in rats, whereas Volkow et al. reported an intrasubject variability of 4%–9% and an intersubject variability of 13%–43% in humans. There is increasing evidence for large interindividual differences in central D2 receptor densities in healthy subjects (33,35); these differences have also been discussed in the context of vulnerability to drug addiction (36,37). Thus, to reliably measure changes in the D2 receptor availability in mouse brain studies, at least a 10% difference between the groups and an appropriate sample size are required. Furthermore, because of the large interindividual differences, longitudinal studies on the same animals might be more appropriate than cross-sectional studies with animals from different breedings.
Determination of appBmax and appKd
Most of the binding studies using multiple ligand concentrations in mice have been performed in vitro using homogenized tissue preparations with 3H-raclopride to characterize ligand binding to D2 receptors (38). However, the complex conditions of in vivo radioligand binding are not reflected by the controlled in vitro environment. Under in vitro conditions, all of the receptors are available for radioligand binding (Bmax), but only a subset of receptors is available in vivo (appBmax), because of competition by endogenous dopamine (15), which affects the value of appKd. Furthermore, the tissue preparation method and incubation conditions, such as temperature, time, pH, and buffer, are general pitfalls in in vitro binding studies and can strongly affect the binding parameter estimates.
Here, we demonstrate in vivo binding assays with 11C-raclopride using PET in the mouse brain for, what is to our knowledge, the first time. The appBmax and appKd values derived from nonlinear regression analysis (Eq. 6, supplemental information) were much higher in mice (70.2 and 37.2 nmol/kg) than the values estimated in the same manner in rats using a clinical ECAT PET scanner (8.7 and 17.1 nmol/kg). In addition, we showed that the method of analysis can strongly affect the binding parameter estimates and must be carefully validated. For example, the nonlinear least-squares analysis approach used estimates of the free ligand concentrations in the cerebellum and revealed that the appBmax and appKd values in the mouse striatum were 9.03 ± 1.79 pmol/mL and 4.68 ± 0.93 nM, respectively, at true equilibrium conditions (Supplemental Table 2). However, the use of the total cerebellar activity as an estimate of the free ligand concentration leads to an overestimation of appKd because only a small part of the cerebellar concentration is in fact free, as reported from raclopride studies in baboons (39). In addition, we found nonsaturable 11C-raclopride binding at a full receptor occupancy using saturating doses of the stable ligand. This kind of nonsaturable binding in the striatum has also been shown in earlier studies using 11C-raclopride in rats (7,22) and the high-affinity D2/D3 receptor radioligand 11C-FLB457 (40). Neither the Michaelis–Menten equation nor its linearization (Scatchard) accounts for any kind of nonsaturable binding in the target tissue that would lead to the upwardly concave appearance of the Scatchard plot and result in the overestimation of both appBmax and appKd, both of which were strongly dependent on the highest ligand concentration (Supplemental Table 4). Such changes have to be considered when interpreting multiple-injection experiments with high raclopride concentrations. Various reasons have been proposed to explain the upwardly concave appearance of the Scatchard plot observed previously in in vitro binding studies (41). These include tissue heterogeneity, which leads to imprecise estimates of nonspecific binding or pharmacologically evoked variations in the baseline levels of endogenous neurotransmitters and receptor sites. To investigate our findings in more detail, further experiments are needed.
Another interesting observation was that the values of appBmax and appKd changed according to the definition of B, either as striatum–cerebellum or as B/F × F. Use of B/F × F resulted in lower values than did use of striatum–cerebellum. This finding is consistent with the results from nonlinear regression analysis (Supplemental Table 2), for which the calculation of appBmax and appKd including the NSAT term is more similar to the calculation of B from B/F × F, and the fits without the NSAT term are more similar to the calculation of B from striatum–cerebellum, further confirming the importance of the NSAT term in Equation 12 (supplemental information).
In contrast to our studies, a study by Noguchi et al. (42) determined 2-affinity binding sites in the striatum of the rat brain using 11C-raclopride at an ultra-high SA of 2,520–7,240 GBq/μmol from homogenate assays (Bmax,high, 0.19 fmol/mg; Kd,high, 0.005 nM; Bmax,low, 35.8 fmol/mg; Kd,low, 2.19 nM, where Bmax,high and Kd,high are high affinity binding site values and Bmax,low and Kd,low are low affinity binding site values). In our studies, the highest SA values of 11C-raclopride ranged between 93 and 220 GBq/μmol, which are higher than those quoted in previous mouse brain studies (23) but still about 30-fold lower than the SA values that Noguchi et al. achieved. Thus, we were unable to detect a second high-affinity binding site. However, high-affinity binding sites might not be detectable with 11C-raclopride under in vivo conditions, because of competition with endogenous dopamine or the effects of anesthesia. It has been shown that isoflurane can highly affect binding parameters of 11C-raclopride because of the inhibition of the D2 high-affinity state (43). Another confounding factor that might influence the determination of appBmax and appKd in our experiments is the intersubject variability observed in our study. Because our analysis was performed using a combination of all data points, the differences in D2 receptor densities among animals might lead to biased estimates.
Partial Volume
Another challenge when performing PET studies in small laboratory animals is the limited spatial resolution of the PET systems. Because the size of the mouse striatum (∼1 mm3) is smaller than the scanner's spatial resolution (∼1.4 mm)3, radioactivity concentrations are underestimated because of the PVE, and radioactivity concentrations from the adjacent Harderian glands may lead to spillover errors. Phantom studies recently performed with our small-animal PET system showed that the recovery of the measured versus real activities can be as low as 10% or less if the contrast is low and the measured target structure is smaller than 10 mm3.
To validate the in vivo mouse PET data, we used high-resolution ex vivo autoradiography, a more spatially accurate imaging technology. Comparison of the binding parameters from in vivo small-animal PET and ex vivo autoradiography revealed no significant differences (P = 0.63) and high correlations (R2 = 0.99) between the 2 methods, suggesting that the PVE and spillover effects did not substantially influence the quantification of the PET experiments in mice. Considering the significant PVE for small structures in the mouse brain, this finding is reassuring but also surprising. Our phantom studies showed that a recovery of the measured activity concentration beyond 50% is achieved only with structures larger than 300 mm3. This is much larger than any of the mouse brain target structures. Thus, the striatum (∼1 mm3) and cerebellum (∼6 × 3 × 3 mm3), the 2 structures of major interest in this study, might undergo similar PVE, although they differ in size by a factor of approximately 54. Our data also revealed higher BPND values than those published by Thanos et al., who used a microPET R4 scanner (1.8 mm in full width at half maximum) (44). At a similar SA (14.8–55.5 GBq/μmol), they reported a DVR of 1.3 as opposed to 2.0–2.5 observed in this study.
The BPND variability across the animals observed using PET (Table 1; Fig. 5C) was confirmed with autoradiography. We noticed that when comparing ex vivo autoradiography and in vivo PET measurements, brain cutting, slice selection, and region-of-interest placement have a large impact on the accuracy of the comparison. From the autoradiography experiments, we observed differences in radioactivity distributions throughout the striatum, possibly explained by the geometry of the striatum.
CONCLUSION
To the best of our knowledge, this is the first in vivo estimate of D2 receptor concentration (appBmax) and raclopride affinity (appKd) in mice. Because mice are the most frequently used animals in biomedical research, an accurate estimation of their receptor sites is important. In our study, we were able to show that the spatial resolution and sensitivity of a state-of-the-art small-animal PET scanner are sufficient to quantitatively and reproducibly perform neuroreceptor PET in mice. However, the tracer doses have to be carefully taken into consideration. Furthermore, nonsaturable binding in the presence of high doses of a stable ligand invalidate the use of Scatchard analysis to estimate appBmax and appKd for this tracer in mice.
DISCLOSURE STATEMENT
The costs of publication of this article were defrayed in part by the payment of page charges. Therefore, and solely to indicate this fact, this article is hereby marked “advertisement” in accordance with 18 USC section 1734.
Acknowledgments
We acknowledge the support from our radiopharmacy group, Walter Ehrlichmann, Anke Stahlschmidt, and Nadja Buckmüller. We also thank Maren Koenig and Mareike Lehnhoff for excellent technical support. We further thank James E. Holden for helpful scientific discussions regarding Scatchard analysis. The work was financially supported by the German Ministry of Education and Research (BMBF), grant number 0314103. No other potential conflict of interest relevant to this article was reported.
- © 2011 by Society of Nuclear Medicine
REFERENCES
- Received for publication December 22, 2010.
- Accepted for publication March 24, 2011.


Jump to section
Related Articles
Cited By...
- In Vivo Evaluation of 11C-DASB for Quantitative SERT Imaging in Rats and Mice
- In Vivo Measurement of the Affinity and Density of Metabotropic Glutamate Receptor Subtype 1 in Rat Brain Using 18F-FITM in Small-Animal PET
- In Vivo Dopamine Transporter Imaging in a Unilateral 6-Hydroxydopamine Rat Model of Parkinson Disease Using 11C-Methylphenidate PET