


Abstract
Serotonin, or 5-hydroxytryptamine (5-HT), plays a key role in the central nervous system and is involved in many essential neurologic processes such as mood, social behavior, and sleep. The serotonin transporter ligand 11C-3-amino-4(2-dimethylaminomethyl-phenylsufanyl)-benzonitrile (11C-DASB) has been used to determine nondisplaceable binding potential (BPND), which is defined as the quotient of the available receptor density (Bavail) and the apparent equilibrium dissociation rate constant (1/appKD) under in vivo conditions. Because of the increasing number of animal models of human diseases, there is a pressing need to evaluate the applicability of 11C-DASB to rats and mice. Here, we assessed the feasibility of using 11C-DASB for quantification of serotonin transporter (SERT) density and affinity in vivo in rats and mice. Methods: Rats and mice underwent 4 PET scans with increasing doses of the unlabeled ligand to calculate Bavail and appKD using the multiple-ligand concentration transporter assay. An additional PET scan was performed to calculate test–retest reproducibility and reliability. BPND was calculated using the simplified reference tissue model, and the results for different reference regions were compared. Results: Displaceable binding of 11C-DASB was found in all brain regions of both rats and mice, with the highest binding being in the thalamus and the lowest in the cerebellum. In rats, displaceable binding was largely reduced in the cerebellar cortex, which in mice was spatially indistinguishable from cerebellar white matter. Use of the cerebellum with fully saturated binding sites as the reference region did not lead to reliable results. Test–retest reproducibility in the thalamus was more than 90% in both mice and rats. In rats, Bavail, appKD, and ED50 were 3.9 ± 0.4 pmol/mL, 2.2 ± 0.4 nM, and 12.0 ± 2.6 nmol/kg, respectively, whereas analysis of the mouse measurements resulted in inaccurate fits due to the high injected tracer mass. Conclusion: Our data showed that in rats, 11C-DASB can be used to quantify SERT density with good reproducibility. BPND agreed with the distribution of SERT in the rat brain. It remains difficult to estimate quantitative parameters accurately from mouse measurements because of the high injected tracer mass and underestimation of the binding parameters due to high displaceable binding in the reference region.
Serotonergic neurons accumulate mainly in the brainstem and form the raphe nuclei (1). Although the raphe nuclei consist of only a few neurons, these nuclei innervate nearly all brain regions (1). Under normal physiologic conditions, the membrane-bound, sodium-chloride–dependent SERT (serotonin transporter, or 5-hydroxytryptamine [5-HT] transporter) is responsible for specific reuptake of released serotonin by cells (2). This transporter is located on the soma, dendritic collaterals, and entire axon of serotonergic neurons (3).
One of the most promising noninvasive imaging approaches for visualizing the distribution of SERT is the SERT marker 11C-3-amino-4(2-dimethylaminomethyl-phenylsufanyl)-benzonitrile (11C-DASB), which is designed for PET (4). This tracer has previously been used in pharmaceutical and clinical human PET studies as a high-affinity and highly selective radioligand for SERT (4,5).
However, 11C-DASB has not been evaluated for in vivo PET experiments in mice. With the increasing number of transgenic animal models of human diseases and the availability of dedicated small-animal PET imaging systems, there is a pressing need for in vivo evaluation and quantification of this PET tracer (6). Because of the small size of rodent brain structures, a PET scanner with high spatial resolution and detection sensitivity is needed. In addition, if the injected tracer mass is greater than 1%–5% receptor occupancy in the region of interest, the measurement may violate the tracer principle and result in imprecise quantification (7).
For absolute tracer quantification and pharmacokinetic modeling, determination of the arterial input function or application of a reference tissue that does not show specific tracer binding is mandatory (8). Especially in small-animal longitudinal studies that require more than one PET scan of the same animal, application of an arterial input function through collection of blood samples is not practical. Therefore, we tested the applicability of different reference tissues and used the simplified reference tissue model to determine the nondisplaceable binding potential (BPND) in rats and mice (9).
In general, small animals need to be anesthetized during in vivo PET measurements. Thus, the effects of individual anesthetics on the pharmacokinetics of the radioligand and on its response to pharmacologic challenges play an important role for the interpretation of PET data (10,11). According to the literature, isoflurane can have a substantial impact on the behavior of SERT and may change the binding characteristics of the transporter to its ligand (12). Therefore, we tested two different anesthetics to evaluate their possible confounding effects on tracer uptake and binding behavior. BPND is defined as the quotient of the available receptor density (Bavail) and the apparent equilibrium dissociation rate constant (1/appKD). A change in BPND can therefore result from an alteration of Bavail or 1/appKD. To estimate the Bavail and 1/appKD of SERT separately, we used the multiple-ligand concentration transporter assay at pseudoequilibrium (13).
MATERIALS AND METHODS
Subjects
In this study, 8 male C57/BL6 mice (Charles River) and 4 male Sprague–Dawley rats (Charles River) were used. The animals were kept on a 12-h light cycle in a room maintained at 22°C and 40%–60% humidity. They were provided a standard diet and tap water ad libitum before and during the experimental period. All animal experiments were approved by the responsible governmental agency (Regierungspräsidium Tübingen).
Radiochemistry
11C-DASB was synthesized as described by Wilson et al. (14). Specific activity (SA) was determined at the start of the PET scans and was 88 ± 30 GBq/μmol in the mouse experiments and 114 ± 41 GBq/μmol in the rat experiments. For the dose–response experiments, the SA was adjusted from 0.5 to 180 GBq/μmol in rats and from 0.5 to 116 GBq/μmol in mice. The upper limit of the injection volume was 65 μL in mice and 100 μL in rats. Injected activities, specific activities, injected mass, and injected dose for the multiple-ligand concentration transporter assay are indicated in Table 1.
Scan Parameters
Anesthesia Protocols
The anesthetics 1.5% isoflurane vaporized in breathing air (21% O2; 79% N2) and medetomidine–midazolam for 11C-DASB PET measurements in mice (n = 4) were compared. Medetomidine (0.05 mg/kg) and midazolam (5 mg/kg) were dissolved in saline and applied intraperitoneally 20 min before PET data acquisition. For isoflurane and medetomidine–midazolam measurements, the respective SAs were 102 ± 13 and 113 ± 24 GBq/μmol and the respective injected doses were 4.2 ± 0.3 and 3.9 ± 0.8 nmol/kg.
PET Data Acquisition, Reproducibility, and Reliability
The PET procedures and calculation of reproducibility and reliability are described in the supplemental materials (available at http://jnm.snmjournals.org).
Determination of Binding Parameters
Kinetic Modeling Using Simplified Reference Tissue Model
The PET data of all high-SA measurements were analyzed, and the time–activity curves and resulting BPND obtained using the volume-of-interest modifications were compared.
The thalamus was used as the target tissue because it had the highest uptake, and the different modifications of the cerebellum were used as the reference region in subsequent experiments. To determine BPND, we used the simplified reference tissue model (Eq. 1) (9): Eq. 1
Eq. 1
where C(t) and Cr(t) are regional radioactivity concentration in the target and reference regions, respectively; k2 is the clearance rate constant from target tissue to plasma;  is the rate constant from reference tissue to plasma; and R1 is relative radioligand delivery (R1 =
  ). The estimated parameters obtained from nonlinear fitting were BPND, R1,
  , and
, and  .
.
Calculation of Bavail and appKD from Competition Experiments
For in vitro measurements under constant conditions, BP is defined as the ratio of receptor density (Bmax) and the equilibrium dissociation rate constant (KD). Because the affinity of ligand binding is the inverse of KD, BP can be equivalently expressed as the product of Bmax and affinity (Eq. 2). Eq. 2
Eq. 2
In in vivo PET, for which conditions depend on many physiologic parameters (body temperature, blood flow, receptor/transporter availability), BP is calculated as the ratio of the available receptor density (Bavail) to the apparent equilibrium dissociation rate constant (appKD).
To calculate Bavail and appKD, the multiple-ligand concentration transporter assay was performed. This approach is derived from in vitro saturation experiments. Rats and mice were injected with increasing concentrations of DASB, which was added to the tracer solution (Table 1).
To calculate the parameters Bavail and appKD, nonlinear regression analysis (Eq. 3) was used as previously described (15–17): Eq. 3
Eq. 3
where B is the concentration of bound ligand, Bavail is the available receptor density in vivo, F is the free radioligand concentration in tissue, and appKD is the dissociation rate constant under in vivo conditions (16). In PET receptor studies, B and F are calculated from the time–activity curve of the target region (Ctarget) and the reference region (Cref): Eq. 4
Eq. 4 Eq. 5
Eq. 5
with fND being the portion of free tracer in tissue. Because fND can be determined only by using an arterial input function, BPND is not corrected for fND.
KD can also be defined as the effective dose (ED50). ED50 represents the concentration of free ligand that is required to occupy 50% of the transporter sites.
Choice of Correct Reference Region
The cerebellum is a commonly used reference region in human 11C-DASB PET brain studies. Because some serotonergic fibers also project to parts of the cerebellum, we compared 3 possibilities for the use of the cerebellum as a suitable reference region. In both mice and rats, we used, first, the whole cerebellum and, second, the cerebellum with fully saturated binding sites, which was obtained from measurements at a very low SA. In rats, as the third possible reference region we also used the cerebellar cortex, which was indistinguishable from the cerebellar white matter in mice. For this purpose, the volume of interest of the gray matter was adjusted to the entire gray matter of the cerebellum.
Statistical Analysis
To evaluate differences in the calculated binding parameters, we used a paired-sample t test with a P value of less than 0.05 considered significant. The data are represented as mean ± SD. Test–retest variability and reliability were evaluated using 1-way ANOVA. To analyze data from the multiple-ligand concentration transporter assay, we used Origin 8.0 (OriginLab) to perform linear and nonlinear regressions.
RESULTS
Determination of Anesthesia Protocol
Representative decay-corrected time–activity curves of the thalamus and cerebellum of 4 mice under isoflurane and medetomidine–midazolam anesthesia are illustrated in Figure 1. Uptake of 11C-DASB (11.8% ± 1.4%) in the thalamus was almost 2-fold higher under isoflurane than under medetomidine–midazolam (6.9% ± 0.05%). In addition, the time to peak 11C-DASB uptake was about 210 s under isoflurane and about 900 s under medetomidine–midazolam, whereas the clearance half-life was about 2,700 and 4,500 s, respectively.
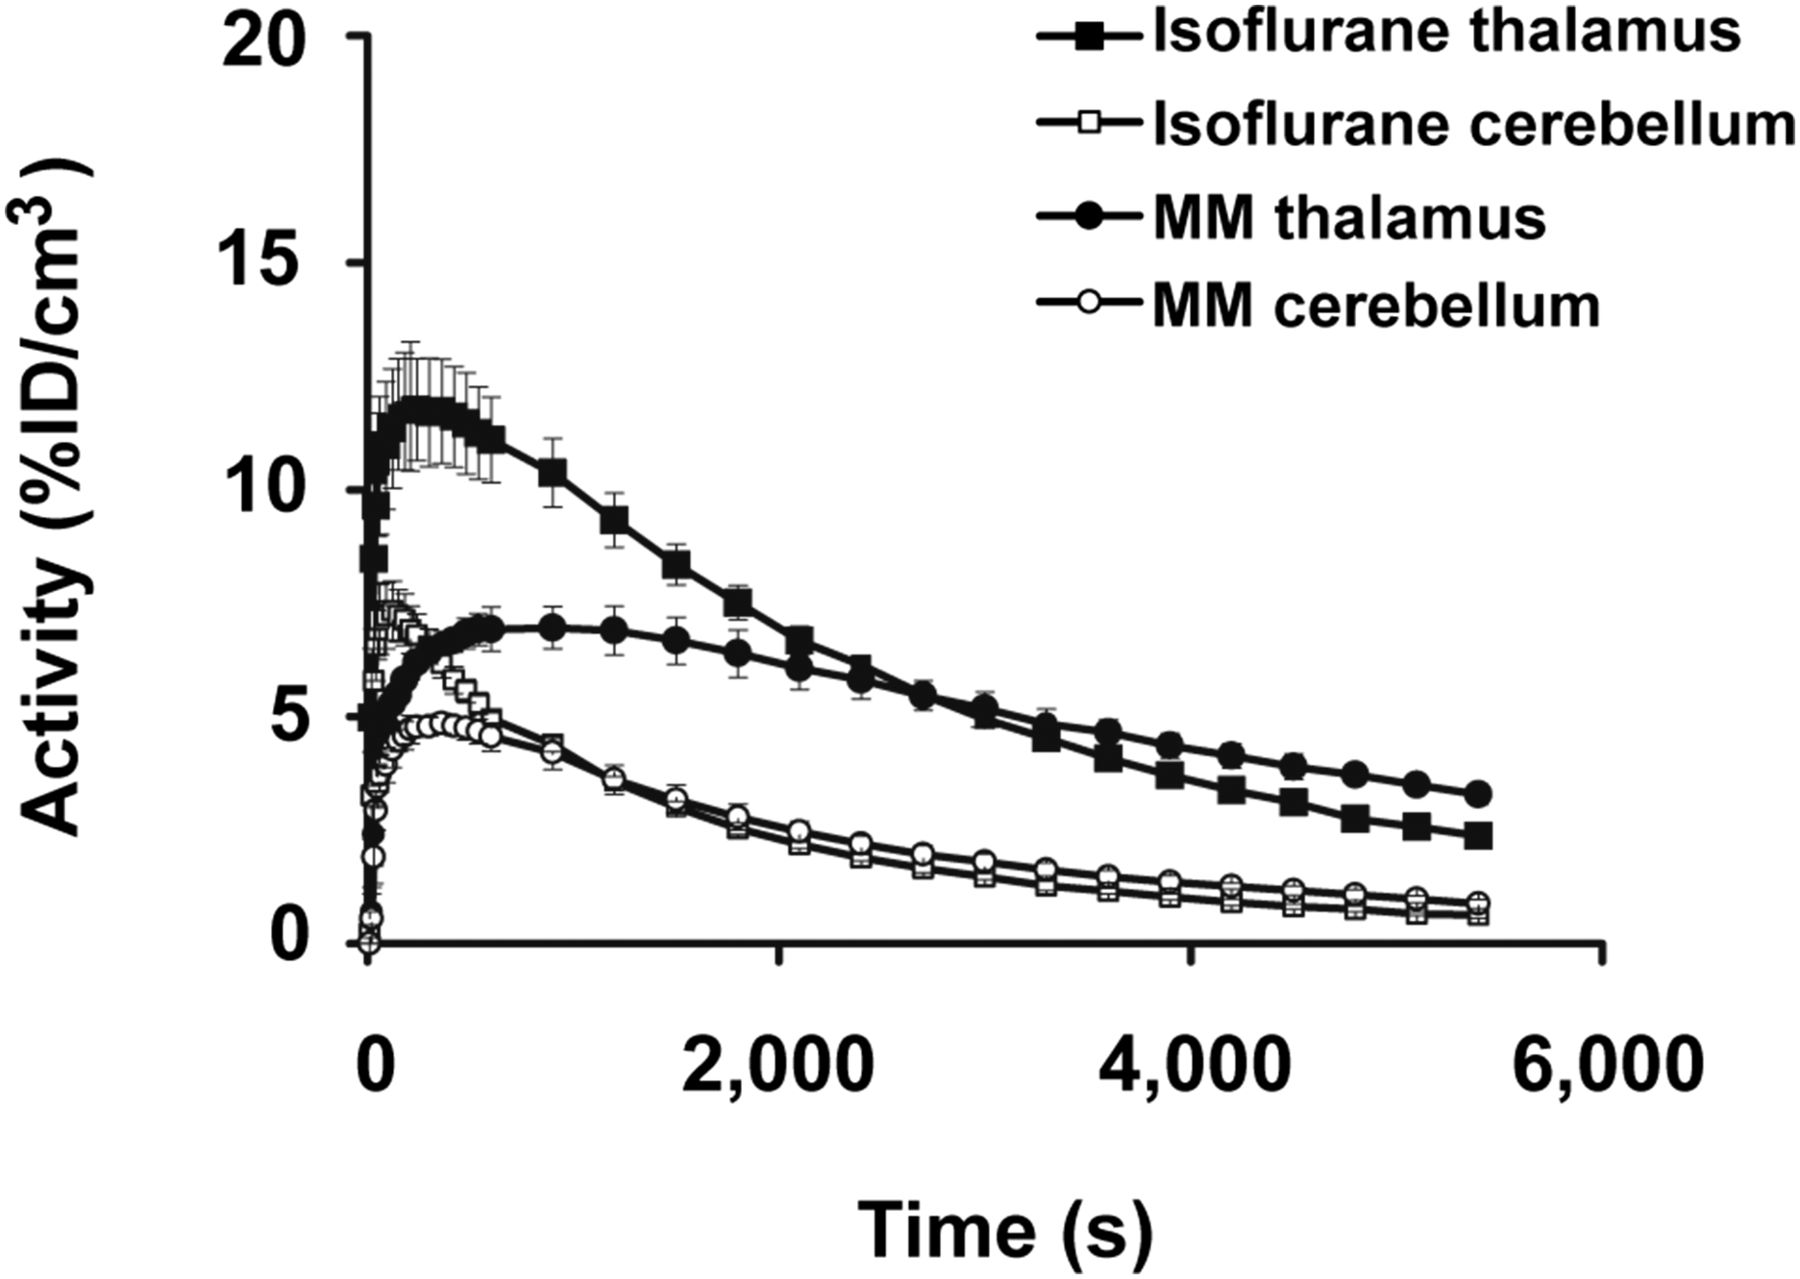
Comparison of anesthesia protocols. Time–activity curves of 11C-DASB in thalamus and cerebellum show higher brain uptake under isoflurane anesthesia than under medetomidine–midazolam anesthesia. Time to peak uptake of 11C-DASB was about 210 s under isoflurane and about 900 s under medetomidine–midazolam. %ID = percentage injected dose; MM = medetomidine–midazolam.
Time–Activity Curves and Choice of Reference Region
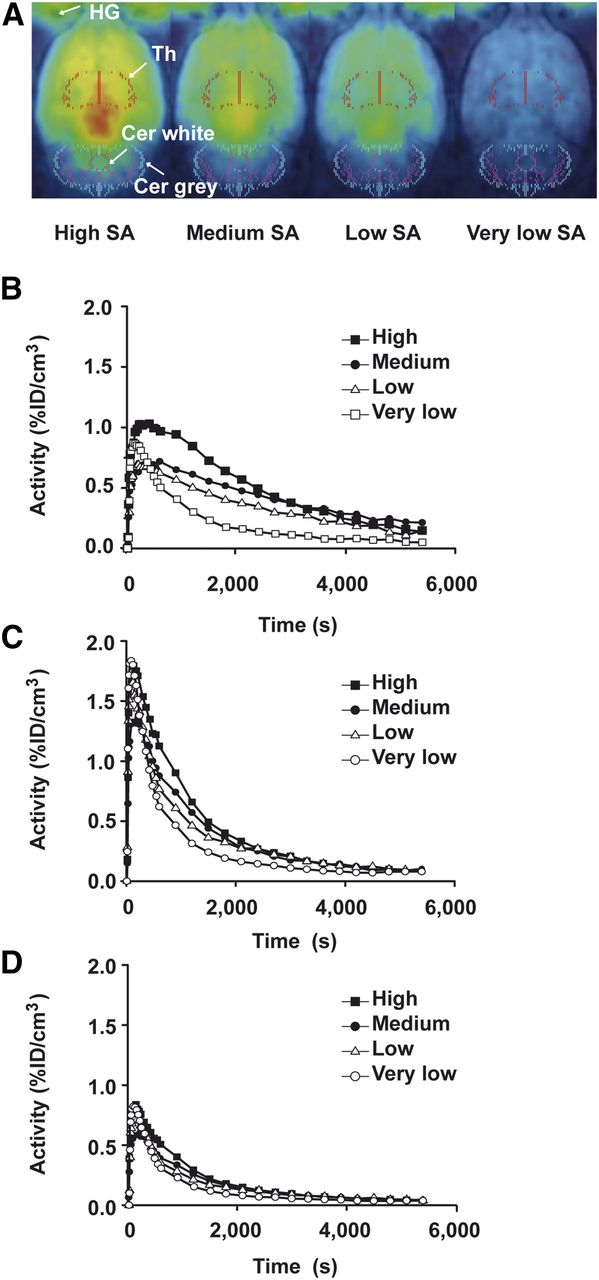
PET images and the corresponding decay-corrected time–activity curves at different SAs are shown in Figure 2 for one mouse and in Figure 3 for one rat. Thalamic (Fig. 2B) uptake of injected 11C-DASB activity per cubic centimeter was 15% in mice but only 1% in rats (Fig. 3B).

11C-DASB brain uptake in mice. Normalized PET images with decreasing SA in mice (A) and corresponding time–activity curves of thalamus (B) and cerebellum (C). Mouse cerebellum showed displaceable binding of 11C-DASB with decreasing SA (increasing tracer mass). Cer = cerebellum; HG = Harderian gland; %ID = percentage injected dose; Th = thalamus.
11C-DASB brain uptake in rats. Normalized PET images with decreasing SA in rats (A) and corresponding time–activity curves of thalamus (B) and cerebellum (C). The rat cerebellum showed displaceable binding of 11C-DASB with decreasing SA (increasing tracer mass). Using the cerebellar cortex as reference region, displaceable binding was considerably reduced (D). Cer = cerebellum; HG = Harderian gland; %ID = percentage injected dose; Th = thalamus.
Specific binding in the thalamus (Figs. 2B and 3B) and cerebellum (Figs. 2C, 3C, and 3D) decreased with increasing tracer doses. In rats, the difference for the cerebellum between high and very low SAs was smaller when the cerebellar cortex (Fig. 3D) was used as the reference region than when the whole cerebellum (Fig. 3C) was used. In mice, the cerebellar cortex could not be distinguished from the cerebellar white matter. The time–activity curves for the cerebellar cortex were too noisy for kinetic analysis because of the small size of the mouse brain and of the cerebellum in particular.
Correlation of BPND Obtained Using Different Reference Regions
Applying the simplified reference tissue model to our PET data using the different reference tissues showed stable fits in both mice (Supplemental Fig. 1A) and rats (Supplemental Fig. 1B).
Linear regression analysis was performed of BPND calculated using cerebellum with fully saturated binding sites (at a very low SA), whole cerebellum, and cerebellar cortex as the reference regions (Supplemental Fig. 2). In both rats and mice, BPND calculated from cerebellum with fully saturated binding sites showed very high variability and did not correlate with BPND calculated from whole cerebellum (Supplemental Figs. 2A and 2B) or cerebellar cortex (Supplemental Fig. 2C). In contrast, in rats, BPND calculated using whole cerebellum correlated strongly with BPND calculated using cerebellar cortex (Supplemental Fig. 2D; R2 = 0.9).
When cerebellum with fully saturated binding sites was used as the reference tissue, BPND was higher and more scattered (mouse, 3.6–6.3; rat, 1.9–3.2) than when whole cerebellum (mouse, 1.5–1.8; rat, 1.4–1.7) or cerebellar cortex (rat, 1.4–1.9) was used.
Test–Retest Experiments
The test–retest data obtained using the whole cerebellum as the reference region in mice and rats, as well as using the cerebellar cortex as the reference region in rats, are summarized in Supplemental Table 1. The test–retest reproducibility for the thalamus using the simplified reference tissue model was 95% for mice and 92% for rats. In regions with lower binding, such as the striatum and hippocampus, reproducibility was only slightly lower: 93% and 90% for mice and 89% and 91% for rats. Reliability was 43% in the thalamus, 14% in the striatum, and 4% in the hippocampus for rats. Reliability could not be determined for the mouse measurements.
Determination of Bavail and appKD
According to the assumptions of a single-binding-site model and using the concentration of the whole cerebellum (mouse) as an estimate of free ligand concentration, calculation of the parameters Bavail and appKD using nonlinear regression analysis did not result in an accurate fit (Fig. 4A). In contrast, in rats, nonlinear regression analysis using the cerebellar cortex as the reference region revealed a Bavail and appKD of 3.9 ± 0.7 pmol/mL and 2.2 ± 0.4 nM, respectively (Fig. 4B). The results for the different reference tissues are summarized in Supplemental Table 2.

Calculation of Bavail and appKD of 11C-DASB in mice and rats. For determination of binding parameters Bavail and appKD, BPND was plotted against free fraction of 11C-DASB and analyzed using nonlinear regression analysis. For mouse brain data, no appropriate fit could be obtained (A). In rats, Bavail and appKD obtained using the cerebellar cortex as reference tissue were 3.9 ± 0.6 pmol/mL and 2.2 ± 0.4 nM, respectively (B). B also illustrates the impact of specific binding in the reference tissue on BPND. The cerebellum with saturated binding sites produced higher but more scattered BPND estimates than the whole cerebellum or cerebellar cortex. cer = cerebellum; SRTM = simplified reference tissue model.
To calculate the ED50, the BPND was plotted as a function of injected dose in nmol/kg (Supplemental Fig. 3) and Equation 3 was applied. The highest BPND ranged from 1.5 to 1.8 in mice and from 1.4 to 1.9 in rats. The ED50 could not be calculated for the mouse data because of the inappropriate regression result (Supplemental Fig. 3A). In rats, the ED50 was 12.0 ± 2.6 nmol/kg (Supplemental Fig. 3B).
DISCUSSION
This study was, to our knowledge, the first in vivo evaluation of 11C-DASB for quantitative SERT imaging in mice. Before transgenic animal models of human diseases can be used in PET brain studies, careful evaluation of the radioligand and the PET methodology for in vivo quantification is needed.
The choice of anesthesia is important in small-animal PET experiments because it can have a considerable impact on receptor availability, tracer uptake, cerebral blood flow, cerebral blood volume, and brain metabolism (18,19). To date, little has been known on whether PET findings using the serotonin reuptake inhibitor 11C-DASB are affected by different types of anesthesia. In one study, Stehouwer et al. performed PET measurements with a newly developed SERT radioligand on conscious, isoflurane-anesthetized monkeys and demonstrated that uptake was not influenced by isoflurane (20). However, experiments on rats and mice that are awake are usually performed under conditions of restraint, resulting in stress on the animals and therefore altered binding parameters. Our data showed that when measuring 11C-DASB in mice, the use of medetomidine–midazolam anesthesia resulted in lower brain tracer uptake, a longer time to peak, and longer half-life clearance than with isoflurane anesthesia. This finding may be related to the independent impacts of the two anesthetics on blood pressure (21,22). Because isoflurane is easier to adjust and maintain individually, it is a convenient anesthesia for PET scanning procedures and was applied in all the following experiments.
Uptake of 11C-DASB in the brain was 15-fold lower in rats than in mice because of the 15-fold higher brain-to-body weight ratio of rats. Specific binding of 11C-DASB was observed in both rats and mice, with the highest uptake being in the thalamus, hippocampus, and striatum, in line with in vivo PET studies on humans and rats (23,24). Displaceable binding was also observed in the cerebellum, which is a commonly used reference region in PET brain studies because of the assumption that it has a negligible number of binding sites (23,24). Nevertheless, serotonin fibers are known to project from the raphe nuclei into the cerebellum (25,26). Although the cerebellar white and gray matter showed the same distribution of SERT binding sites, a suitable reference region should have free and nonspecific binding properties similar to those of the region with specific binding. These binding properties are highly dependent on the proteins that bind the radioligand nonspecifically. Therefore, Parsey et al. have suggested that the cerebellar cortex is the best available reference region for 11C-DASB PET studies (26). This is in line with our findings, which showed the lowest specific binding and comparable unspecific binding when the cerebellar cortex was used as the reference region in rats, rather than the whole cerebellum. In mice, we were unable to accurately distinguish between cerebellar gray and white matter because of the small size of the mouse cerebellum. In addition, spillover from adjacent brain regions (e.g., from the midbrain and fourth ventricle) can lead to overestimation of the time–activity curve values and hence underestimation of BPND. Furthermore, if competition binding experiments with increasing concentrations of the cold ligand are performed to calculate Bavail and appKD, specific binding in the cerebellum will differ for each concentration and will therefore alter the cerebellar time–activity curve, leading to errors in the estimated parameters.
We used the cerebellar cortex as reference region for rats. However, because this approach was not feasible in mice, we used the whole cerebellum as reference tissue, taking the specific binding in the reference region into account and remaining aware of the underestimation of the determined BPND.
In clinical human PET studies, an arterial input function is often used to calculate binding parameters from individual kinetic parameters if no adequate reference region is available (24,27). However, in small laboratory animals, an arterial input function is invasive and difficult to generate via catheterization of arterial vessels, especially in longitudinal experiments, because the animals have to be sacrificed after the PET measurement. In a clinical human PET study, Frankle et al. compared the results obtained for 11C-DASB using an arterial input function and the simplified reference tissue model and reported that both methods resulted in similar values across all regions (24), confirming that arterial blood sampling is not mandatory for the analysis of human 11C-DASB PET data.
The reference tissue model described by Watabe et al. is a kinetic modeling approach that includes and describes specific binding in the reference tissue (28). This model describes a single tissue compartment for the target tissue and two tissue compartments for the reference tissue, assuming a certain amount of specific binding in the reference tissue. However, a disadvantage of this full-reference-tissue approach is its complexity, which is due to the quantity of undefined parameters for the reference region. Therefore, the parameters need to be estimated from a receptor-rich target region and can then be fixed to constant values. However, using simulations, Millet et al. found few improvements when using this method compared with the simplified reference tissue model (29).
Another approach to address specific binding in the reference region is the use of the cerebellum with fully saturated binding sites. With this approach, an additional PET scan is required to fully saturate the cerebellum. In our experiments, the BPND using this approach showed higher intersubject variability than when obtained using the whole cerebellum or cerebellar cortex as the reference tissue. This discrepancy may relate to the use of target and reference tissues from two different scans. Additionally, the time–activity curves from the cerebellum with fully saturated binding sites were much noisier, leading to greater variability in estimated BPND.
In both mice and rats, we found good reproducibility for the calculated binding parameters in a SERT-rich region (thalamus, 95% and 92%, respectively) and only slightly lower reproducibility in a region of moderate SERT binding (striatum, 93% and 89%, respectively). These findings agree closely with PET data from cats (thalamus, 92%; striatum, 88%) and are only slightly lower than data from humans (thalamus, 89.5%; striatum, 93%) (24,30,31). The reliability of the rat measurements was higher in the thalamus (43%) than in the striatum (14%), as is in line with the literature (24). However, the reliability of mouse test–retest experiments could not be calculated because the mean sum square between subjects was smaller than the mean sum square within subjects.
In tracer-binding experiments, quantification of receptor or transporter concentrations and radioligand affinity is generally performed ex vivo with long-lived isotopes (32,33). These studies are performed under controlled and constant (buffer, pH, temperature) conditions. Compared with the in vitro situation, membrane receptors and transporters and in particular the 5-HTergic system, which contributes to numerous essential brain networks such as those related to circadian rhythm and anxiety, show highly dynamic behavior, including internalization and externalization as well as conformational changes from high- to low-affinity states (34). In addition, the BPND calculated from a single-injection PET experiment reflects both Bavail and appKD (35). Therefore, in vivo evaluation of SERT density and radioligand affinity will considerably improve the interpretation of PET results in many experiments. Here, we provide the first test, to our knowledge, of the feasibility of using the multiple-ligand concentration transporter assay to determine Bavail and appKD for 11C-DASB in mice and rats under in vivo conditions. In rats, with the cerebellar cortex as the reference region, Bavail (3.9 ± 0.7 pmol/mL) was comparable to Bmax obtained in an ex vivo binding study by Elfving et al. using rat brain tissue homogenates (3.0 ± 0.1 pmol/mL) (36). We obtained higher appKD values (2.2 ± 0.4 nM) than the KD values reported by Elfving et al. (0.34 nM), as might be explained by the different experimental setups of the in vivo and ex vivo binding experiments. The calculated ED50 was 12.0 ± 2.6 nmol/kg, which was lower than that found in an ex vivo study on rats (51 nmol/kg) (23). The rat brains were etched and fragmented into different brain regions and measured in a γ-counting device. This could explain the differences from our data; γ-counting measurements result in higher activity outcomes than in vivo PET measurements because of the partial-volume effects in PET experiments (37).
In mice, nonlinear regression analysis did not lead to accurate fits for the determination of Bavail, appKD, and ED50. This can be explained by the fact that in our experiments, a plateau could not be reached for BPND with the highest obtainable SA (Fig. 4 and Supplemental Fig. 3). The lower brain-to-body weight ratio of the mice resulted in a 15-fold higher tracer uptake and a 13- to 15-fold higher injected mass in the mice (2.5 ± 0.3 μg/kg) than in the rats (0.16 ± 0.1 μg/kg).
Additionally, mouse BPND was higher at a very low SA than at a low SA. This could be due to an underestimation of BPND at high-to-low SAs because of specific binding in the cerebellum if the binding sites of the reference region are not totally saturated, as well as to differences in nondisplaceable binding between the target and reference regions.
Therefore, PET measurements in mice should be performed at a significantly lower injected activity to obtain lower transporter occupancy or produce 11C-DASB at higher SAs; this requires a PET scanner with high detection sensitivity.
CONCLUSION
Our study showed that, compared with medetomidine–midazolam, isoflurane resulted in a higher tracer uptake and was more easily applied for quantitative in vivo PET measurements in the brains of small laboratory animals. Further, we demonstrated that the cerebellar cortex is an accurate reference region for kinetic modeling in rats but not in mice, because of the small size of the cerebellum in mice. The calculated reproducibility for mice and rats was more than 90% and was comparable to in vivo PET studies on humans. However, when the parameters Bavail, appKD, and ED50 were calculated, only the rat measurements resulted in good-quality fits. It remains difficult to estimate quantitative parameters accurately from mouse measurements because of the high injected tracer mass and underestimation of binding parameters due to high displaceable binding in the reference region. Higher-SA DASB production is required to achieve a sufficiently low injected mass while maintaining a signal that is sufficient for reliable measurements of quantitative parameters in mouse imaging.
DISCLOSURE
The costs of publication of this article were defrayed in part by the payment of page charges. Therefore, and solely to indicate this fact, this article is hereby marked “advertisement” in accordance with 18 USC section 1734. Financial support was provided by the Werner Siemens Foundation. No other potential conflict of interest relevant to this article was reported.
Footnotes
Published online Oct. 29, 2015.
- © 2016 by the Society of Nuclear Medicine and Molecular Imaging, Inc.
REFERENCES
- Received for publication July 10, 2015.
- Accepted for publication October 13, 2015.


Jump to section
Related Articles
Cited By...
- Mapping Serotonergic Dynamics using Drug-Modulated Molecular Connectivity
- Neurovascular Uncoupling: Multimodal Imaging Delineates the Acute Effects of 3,4-Methylenedioxymethamphetamine
- Neurovascular Uncoupling: Multimodal Imaging Delineates the Acute Effects of MDMA
- Striatal and prefrontal D2R and SERT distributions contrastingly correlate with default-mode connectivity
- Impact of 18F-PSMA-1007 Uptake in Prostate Cancer Using Different Peptide Concentrations: Preclinical PET/CT Study on Mice