


Abstract
The objectives of this study were to investigate the relationship between CT- and 18F-FDG PET–based tumor volumes in non–small cell lung cancer (NSCLC) and the impact of tumor size and uptake heterogeneity on various approaches to delineating uptake on PET images. Methods: Twenty-five NSCLC cancer patients with 18F-FDG PET/CT were considered. Seventeen underwent surgical resection of their tumor, and the maximum diameter was measured. Two observers manually delineated the tumors on the CT images and the tumor uptake on the corresponding PET images, using a fixed threshold at 50% of the maximum (T50), an adaptive threshold methodology, and the fuzzy locally adaptive Bayesian (FLAB) algorithm. Maximum diameters of the delineated volumes were compared with the histopathology reference when available. The volumes of the tumors were compared, and correlations between the anatomic volume and PET uptake heterogeneity and the differences between delineations were investigated. Results: All maximum diameters measured on PET and CT images significantly correlated with the histopathology reference (r > 0.89, P < 0.0001). Significant differences were observed among the approaches: CT delineation resulted in large overestimation (+32% ± 37%), whereas all delineations on PET images resulted in underestimation (from −15% ± 17% for T50 to −4% ± 8% for FLAB) except manual delineation (+8% ± 17%). Overall, CT volumes were significantly larger than PET volumes (55 ± 74 cm3 for CT vs. from 18 ± 25 to 47 ± 76 cm3 for PET). A significant correlation was found between anatomic tumor size and heterogeneity (larger lesions were more heterogeneous). Finally, the more heterogeneous the tumor uptake, the larger was the underestimation of PET volumes by threshold-based techniques. Conclusion: Volumes based on CT images were larger than those based on PET images. Tumor size and tracer uptake heterogeneity have an impact on threshold-based methods, which should not be used for the delineation of cases of large heterogeneous NSCLC, as these methods tend to largely underestimate the spatial extent of the functional tumor in such cases. For an accurate delineation of PET volumes in NSCLC, advanced image segmentation algorithms able to deal with tracer uptake heterogeneity should be preferred.
The use of 18F-FDG PET, with the addition of CT since the development of PET/CT devices, has been increasing for staging non–small cell lung cancer (NSCLC) (1). In addition, the use of 18F-FDG PET/CT in radiotherapy treatment planning for the definition of gross tumor volume has been similarly growing (2). Manual contouring of the tumor boundaries on the CT images is still the conventional methodology for target volume definition. On the other hand, and despite a high spatial resolution, the delineation on CT alone may be biased by insufficient contrast between tumor and healthy tissues (e.g., in cases of atelectasis, pleural effusion, and fibrosis or for tumors attached to the chest wall or mediastinum). Several studies have investigated the impact of delineation performed on fused 18F-FDG PET/CT images and have found significant modifications of the treatment plan (size, location, or shape of the gross tumor volume) (3) and reduced inter- and intraobserver variability (4). Additional benefits from the use of PET relative to CT include the potential to image cellular proliferation and tumor hypoxia using tracers such as 3′-deoxy-3′-18F-fluorothymidine and 18F-fluoromisonidazole or 64Cu-diacetyl-bis(N4-methythiosemicarbazone), respectively.
However, the integration of PET within radiotherapy planning is complex, especially because there is neither consensus nor guidelines regarding the delineation of 18F-FDG PET tumor uptake or how to subsequently use the delineated functional volumes. Most previously published studies have investigated the use of a specific threshold of PET uptake to define the metabolically active tumor volume (MATV, the tumor volume that can be seen and delineated on an 18F-FDG PET image) or spatial extent, with a large variability in the recommended threshold and resulting volumes (5–8). A few recent studies have investigated the correlation between tumor histopathology measurements and the threshold of PET uptake (4,9–12). For example, the study of Yu et al. (12) on 15 patients proposed an optimal threshold of 31% ± 11% of the PET maximum uptake within the tumor for a good correlation with the corresponding histopathology-derived tumor maximum diameter. Considering 3-dimensional reconstructed histopathology volumes instead of only the maximum diameter, Stroom et al. (10) recommended a fixed threshold of 42% of the maximum PET uptake based on their findings in a group of 5 patients with rather small tumors. Finally, in the study by Wu et al. (11) on 31 patients, 50% of the maximum (T50) was proposed as the best threshold for PET uptake delineation in NSCLC with respect to the histopathologic maximum diameter. This conclusion was reached by comparing the results obtained using a range of different fixed thresholds (from 20% to 55%), although only nonstatistically significant differences were found with the other tested values. The same authors subsequently showed that such a threshold was less appropriate than manual delineation, which led to incorrect delineation in some cases (13). Manual contouring is far from ideal, as it suffers from large intra- and interobserver variability (14) and is also a tedious and time-consuming procedure, especially in 3 dimensions.
Alternatively, other authors have considered the use of adaptive thresholding approaches taking into account the tumor-to-background ratio instead of a fixed threshold but requiring the determination of a background region of interest, as well as optimization for a given scanner model, acquisition protocol, and image reconstruction using phantom acquisitions (8,15,16). Using such an approach, van Baardwijk et al. (4) obtained a significant correlation with histopathology measurements for 23 NSCLC tumors, as well as reduced interobserver variability. Finally, the use of more advanced image segmentation methodologies to automatically delineate MATV has been proposed in several studies (17–24), with variable levels of validation. For example, we have already demonstrated that such automated image segmentation approaches can offer higher accuracy (18,21), robustness (25), and reproducibility (14) than threshold-based (fixed or adaptive) methods.
Some previous studies investigating NSCLC tumor delineation on PET/CT hypothesized a significant influence of the anatomic or metabolic lesion size and activity distribution heterogeneity on both the results and the observed differences between delineation methodologies (8). However, those studies neither quantified this heterogeneity nor thoroughly investigated such a correlation with respect to the anatomic tumor and functional uptake sizes. The main objective of our study was therefore to investigate the correlation among anatomic tumor size as determined on CT, the 18F-FDG uptake level of heterogeneity, and the differences between various automatic PET MATV delineation approaches.
MATERIALS AND METHODS
Patient Studies
Twenty-five patients with confirmed NSCLC, stage Ib–IIIb, were included in this study. All patients underwent an 18F-FDG PET/CT examination for staging purposes before treatment. Patients were instructed to fast for a minimum of 6 h before examination. Free-breathing PET and CT images were acquired 45–60 min after 18F-FDG injection. A total of seven 5-min bed positions with overlap were used for whole-body PET (Biograph PET/CT; Siemens) acquisitions, which were corrected for attenuation using the CT data and iteratively reconstructed using the ordered-subsets expectation maximization algorithm (4 iterations, 8 subsets). Within a week after PET/CT acquisitions, 17 of the 25 patients underwent surgery (lobectomy), which allowed further macroscopic examination. All specimens were processed in the same way; namely the fresh specimens were put on ice, and 1 pathologist measured the maximum diameter of the tumor in 3 dimensions (4). Specimen shrinkage, estimated at about 10%, was not considered since the measurements were performed before fixation in formalin, allowing subsequent immunohistochemical examination, for which the biopsy specimens were paraffin-embedded.
This study was approved by the Institutional Ethics Review Board, and informed written consent was obtained from all patients before their inclusion in the study.
PET and CT Tumor Delineation
PET images were first up-sampled using a cubic B-spline interpolation scheme (26), in such a way that the voxels were of the same size as the associated CT images (Fig. 1). Because the goal of this study was to compare anatomic and MATV as seen and delineated on CT and 18F-FDG PET images, respectively, manual delineation on fused PET/CT images was not considered. Only primary tumors were delineated on both CT and PET images independently. Tumor anatomic volumes were manually delineated on CT without knowledge of the PET information by 2 observers, both with more than 10 y experience in PET and CT. Functional tumor volumes were manually delineated on PET images by one of the observers (and checked by the other observer) (13), as well as using semi- or fully automatic image segmentation tools. A fixed threshold at T50 as suggested by Wu et al. (11), and an adaptive threshold taking into account the background uptake (8), were considered. The adaptive threshold approach was optimized on phantom acquisitions performed on the same PET/CT scanner that was used for the patient acquisitions. The method requires the definition of a manual background region of interest defining the background uptake to compute a first approximation of the tumor-to-background contrast. Both observers were therefore instructed to place this background region of interest in the lungs, at a distance of several centimeters from the boundaries of the tumors. They were, however, free to choose the actual size and position of the region of interest, which led to 2 different results, denoted A1 and A2. Finally, the fuzzy locally adaptive Bayesian (FLAB) algorithm (18,21) was also used. This algorithm allows automatic tumor delineation by computing a probability of belonging to a given class (e.g., tumor or background) for each voxel. This probability is determined by taking into account the voxel intensity with respect to the statistical distributions (characterized by their mean and variance) of the voxels in the various regions of the image, as well as spatial correlation with neighboring voxels. FLAB has demonstrated its ability to accurately differentiate, if necessary, both the overall tumor spatial extent from its surrounding background and the tumor subvolumes with different uptakes (18).
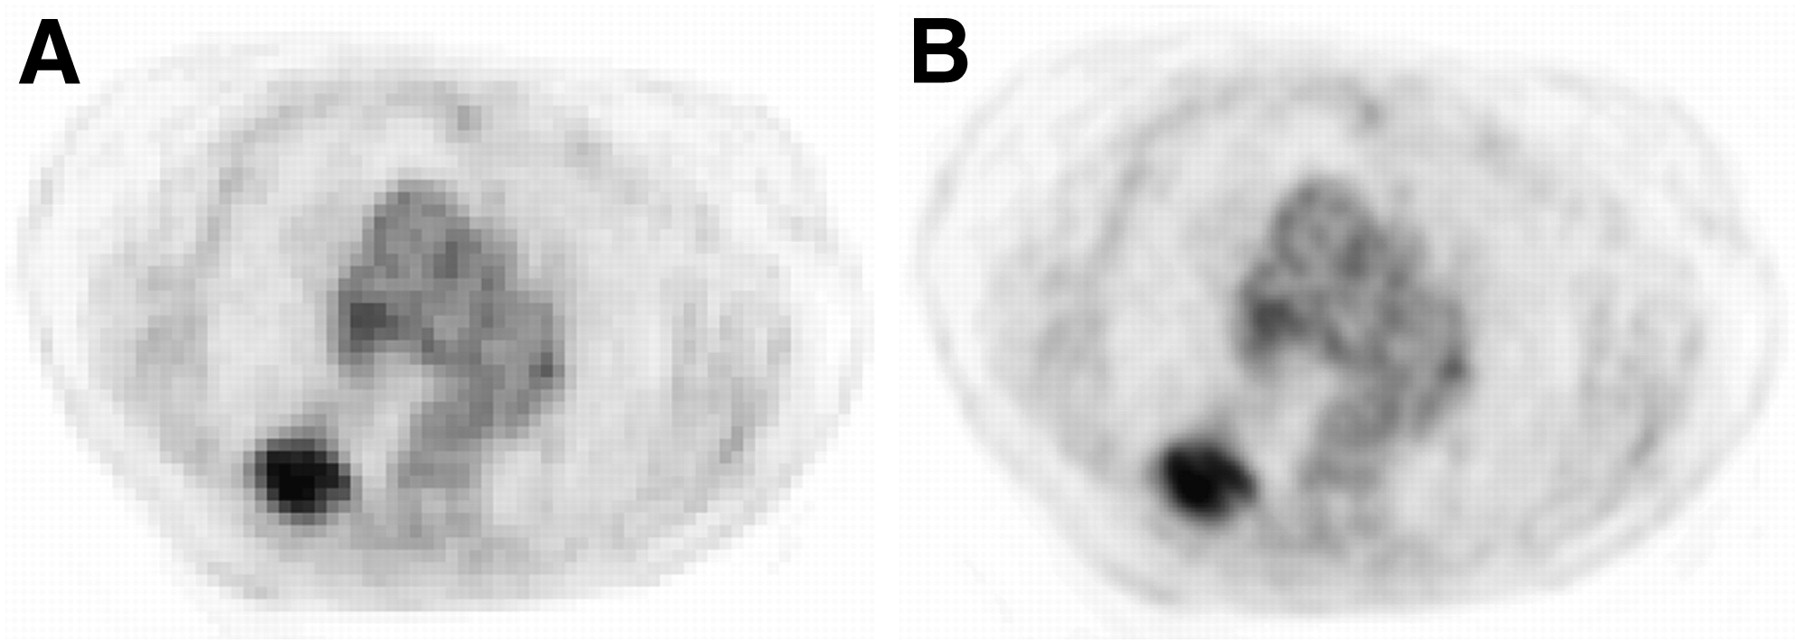
Illustration of up-sampled PET images (central axial slice). Original PET image with voxel size of 5.31 × 5.31 × 5 mm (A) and PET image up-sampled with voxel size equal to CT (0.98 × 0.98 × 5 mm) (B) using cubic B-spline interpolation.
Investigated Parameters and Analysis
First, for the 17 patients for whom macroscopic measurements were available, the maximum diameters were measured as the largest dimension in any orientation, considering the different volume delineations (manual on CT and PET, T50, A1 and A2, and FLAB), and compared with the histopathology reference. We reported both absolute (in cm) and relative (%) errors with respect to the maximum diameter to establish a hierarchy between the different methods. Second, for all patients the anatomic tumor volumes defined on CT images and the MATV obtained by each delineation approach were compared with each other. Delineations on original non–up-sampled PET images were performed to verify that the up-sampling would not bias the results of the various methods. Finally, the 18F-FDG uptake heterogeneity was estimated using the coefficient of variation (COV), defined as the ratio between the SD of the standardized uptake values and the mean standardized uptake value within the delineated MATV. Two different volumes were used to calculate COV. The first was the one obtained using FLAB (COVFLAB), since it was found to be the most accurate with respect to histology measurements, whereas the second was the CT-based volume (COVCT) copied onto the PET images.
Summary statistics are expressed as mean ± SD. Pearson coefficients were used to estimate correlations between parameters. Paired t tests were used to assess the differences between the tumor volume distributions obtained with the various delineation approaches. As most distributions were not normally distributed, they were log-transformed before analysis. All tests were 2-sided, and P values of less than 0.05 were considered statistically significant.
RESULTS
Comparison with Maximum Diameter (Histopathology Reference)
Table 1 shows the maximum measured diameters of the 17 tumors based on either macroscopic examination or PET and CT images. All measured diameters correlated strongly with macroscopic measurements for all delineation approaches considered (r from 0.89 for T50 to 0.99 for FLAB, P < 0.0001) (Figs. 2A–2C). Despite high correlations with maximum diameter for all methodologies as shown in Table 1 and Figure 2, significant differences were observed among the delineations (Figs. 3A and 3B). On the one hand, CT delineation consistently overestimated the maximum diameter of all tumors (+32% ± 37%), with errors up to 3.5 cm (+140%). Manual delineation on PET images led to no significant bias but a high SD (mean error, 8% ± 17%), with maximum errors of −1.5 cm (−17%) and +1.2 cm (+39%). On the other hand, PET automatic delineations mostly led to underestimation of the real diameter. T50 led to the largest underestimation (−15% ± 17%), with errors up to +1.8 cm (+32%) and −2.3 cm (−46%). Adaptive thresholding led to better accuracy, with similar results for both observers (−11% ± 17% and −12% ± 16% for A1 and A2, respectively) and errors up to −2 cm (−40%). FLAB was associated with the most accurate results (−4% ± 8%), with no error above ±0.4 cm (±13%).
Maximum-Diameter Measurements on Pathology and Image Delineations for All 17 Patients
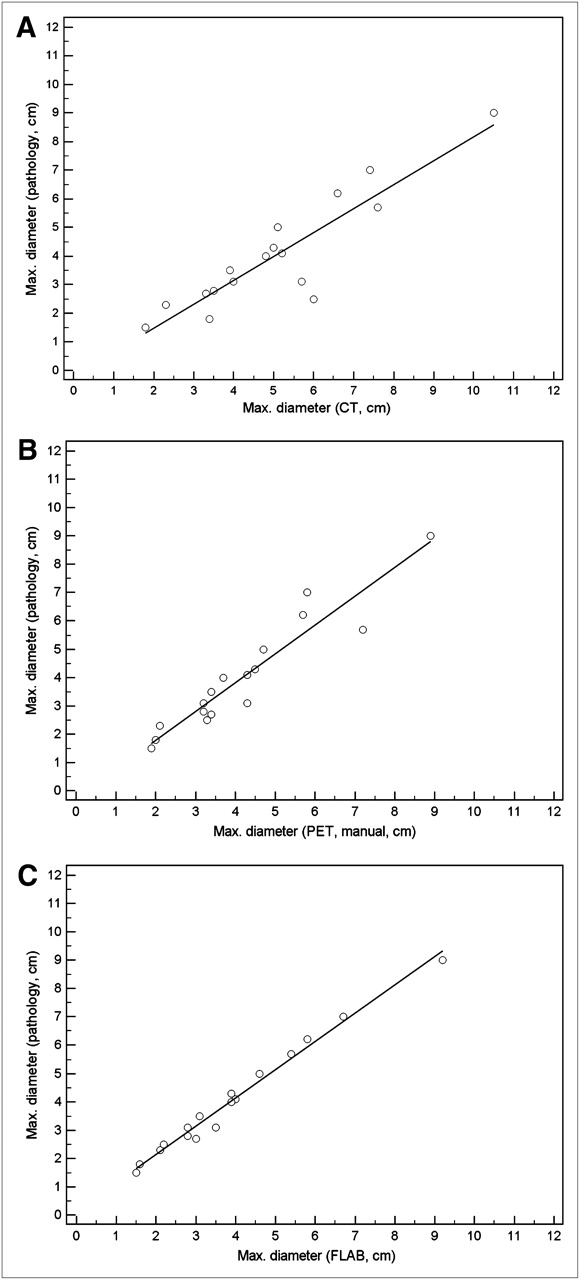
Correlations with manual delineations on CT (A) and PET (B) and with FLAB delineations on PET (C).

Absolute (in cm) differences (A) and relative (%) errors (B) between pathology measurements and image-based delineations.
Comparison of Tumor Volumes
Table 2 shows the tumor volumes for all patients. No significant differences in volume determination on CT were found between the 2 observers (P > 0.08). Therefore, the results for only 1 observer will be considered. No significant difference was observed between volumes obtained on original or up-sampled PET images.
Tumor Volumes Measured on CT and PET Images (n = 25)
Anatomic tumor volumes delineated on CT images were the largest (55 ± 74 cm3) and were significantly different from all volumes defined on PET images (P < 0.0001). In addition, all PET-based methodologies resulted in volumes that were significantly different from one another (P < 0.0001). Among the PET-defined tumor volumes, and consistent with what was observed according to the maximum diameters, the smallest volumes were obtained with T50 (18 ± 25 cm3), followed by the adaptive threshold (23 ± 33 cm3), FLAB (40 ± 71 cm3), and manual (47 ± 76 cm3).
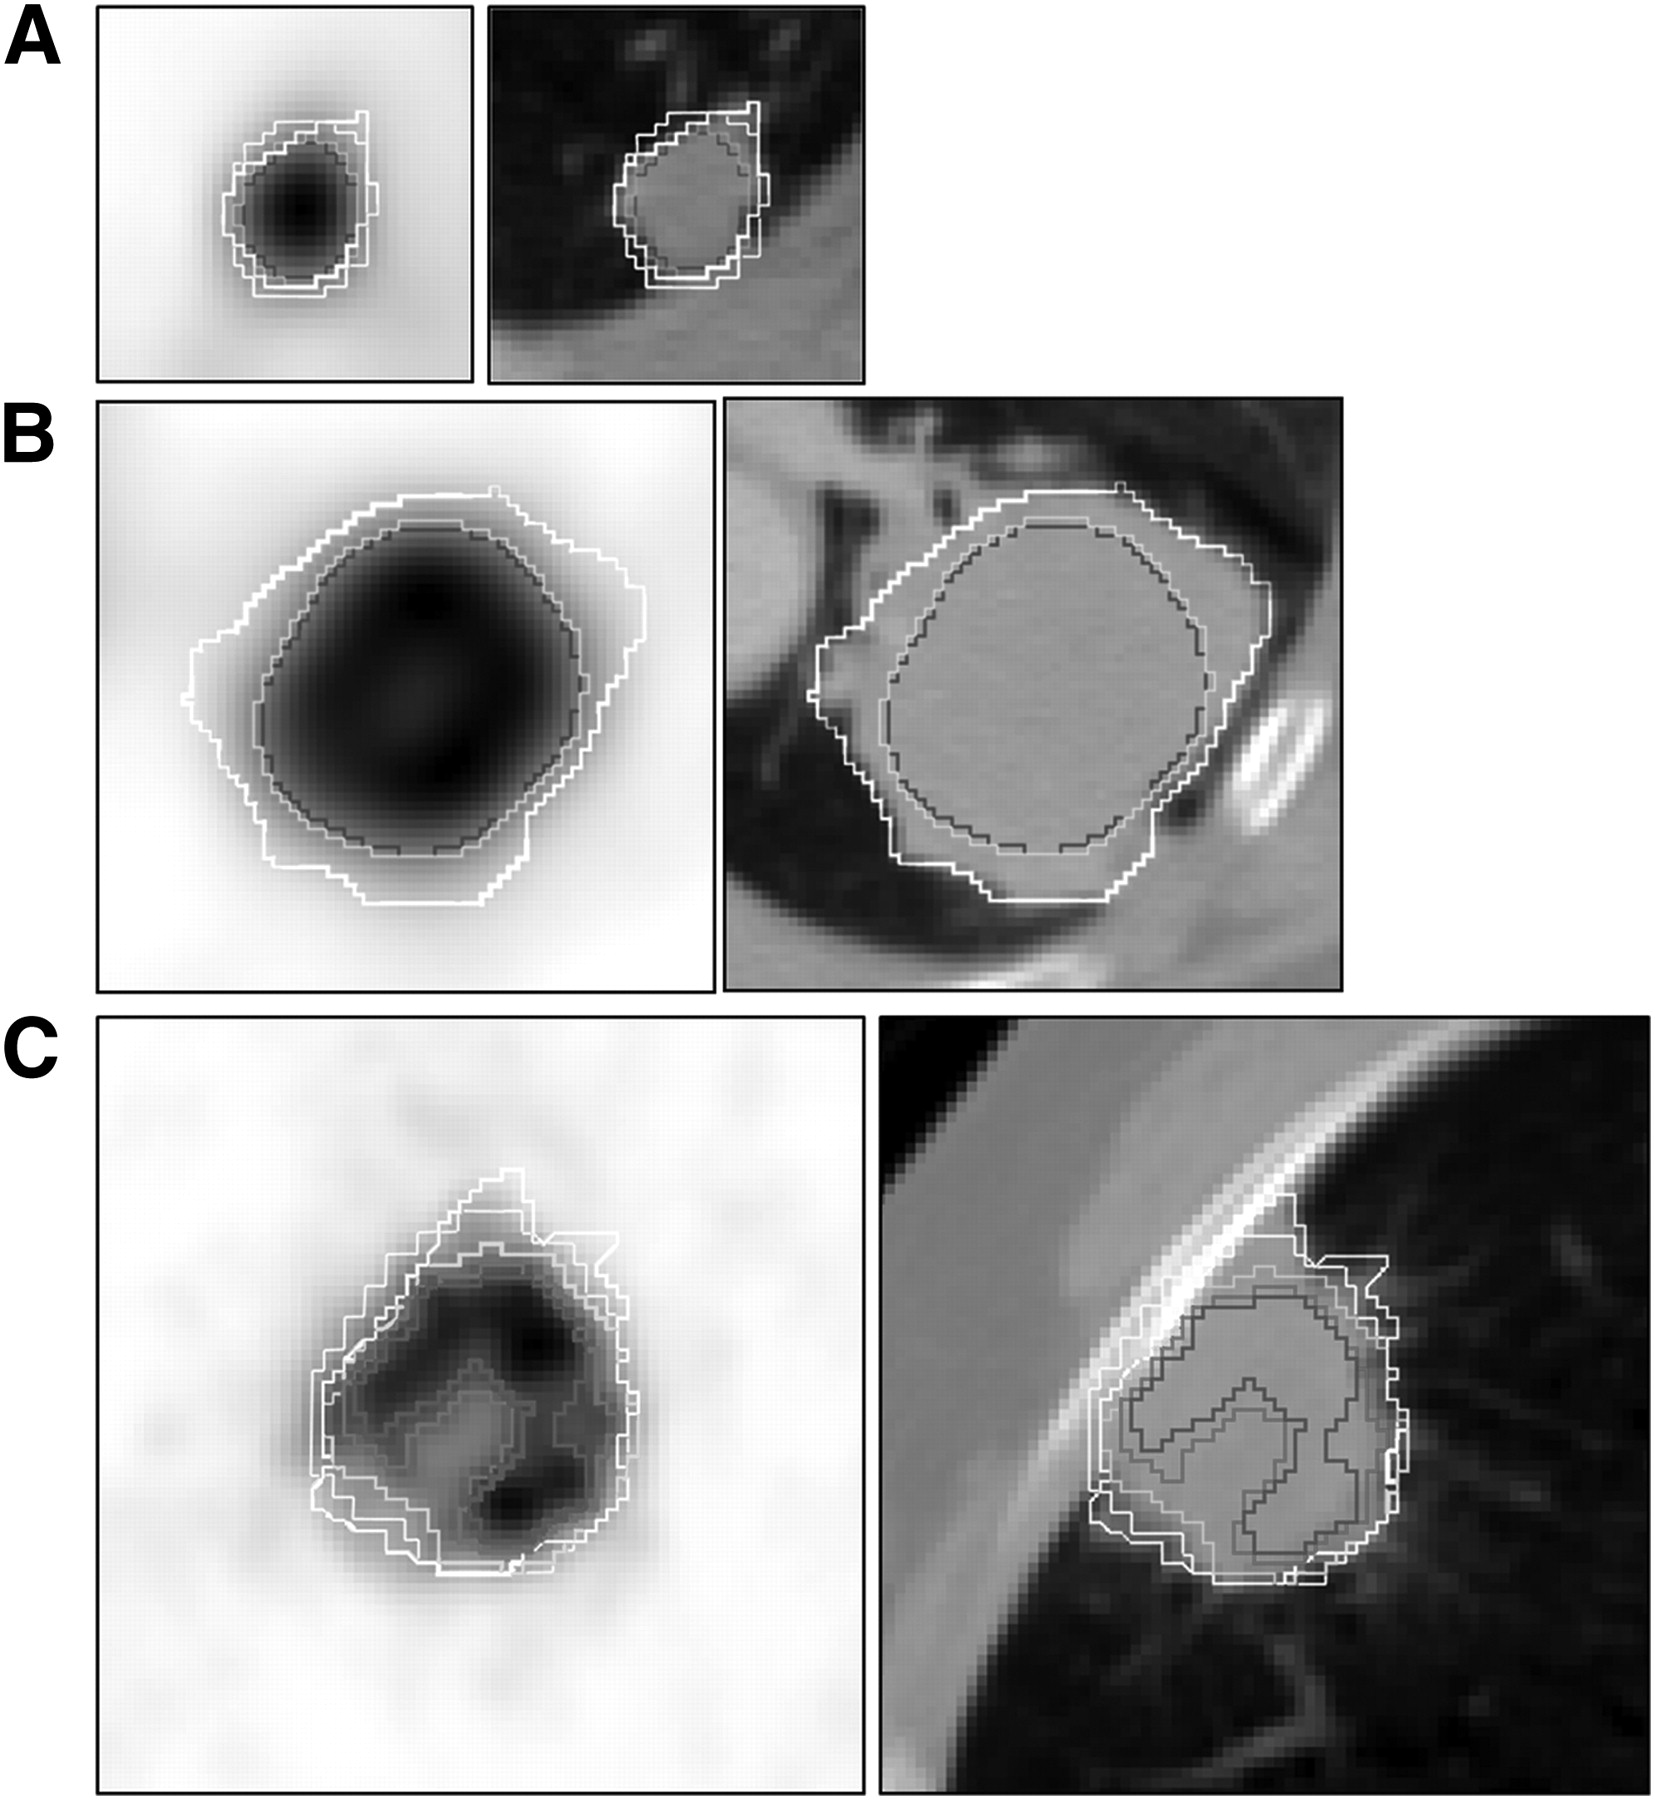
Regarding the overlap in delineated volumes, the larger CT volumes almost systematically enclosed the PET-based volumes, except for 8 cases in which small regions of PET uptake were just outside the anatomic volume, involving small margins comprising only a few voxels. The smallest PET uptake volumes generated with T50 were also almost systematically enclosed within the volumes defined by the adaptive thresholding, which in turn were mostly enclosed within the FLAB-based volumes. Figure 4 illustrates 3 different cases representative of the various situations encountered.

Small lesions (<2 cm in diameter) (A) and larger lesions with moderate (COVFLAB = 0.23) (B) and higher (COVFLAB = 0.30) (C) heterogeneity. For readability, A1 contours are not shown in B and C and manual PET contours are not shown in B as they were similar to FLAB and T50. White = manual on CT; blue = T50; purple = A1; green = FLAB.
Correlation of 18F-FDG Uptake Heterogeneity with Tumor Size and Impact on Delineation
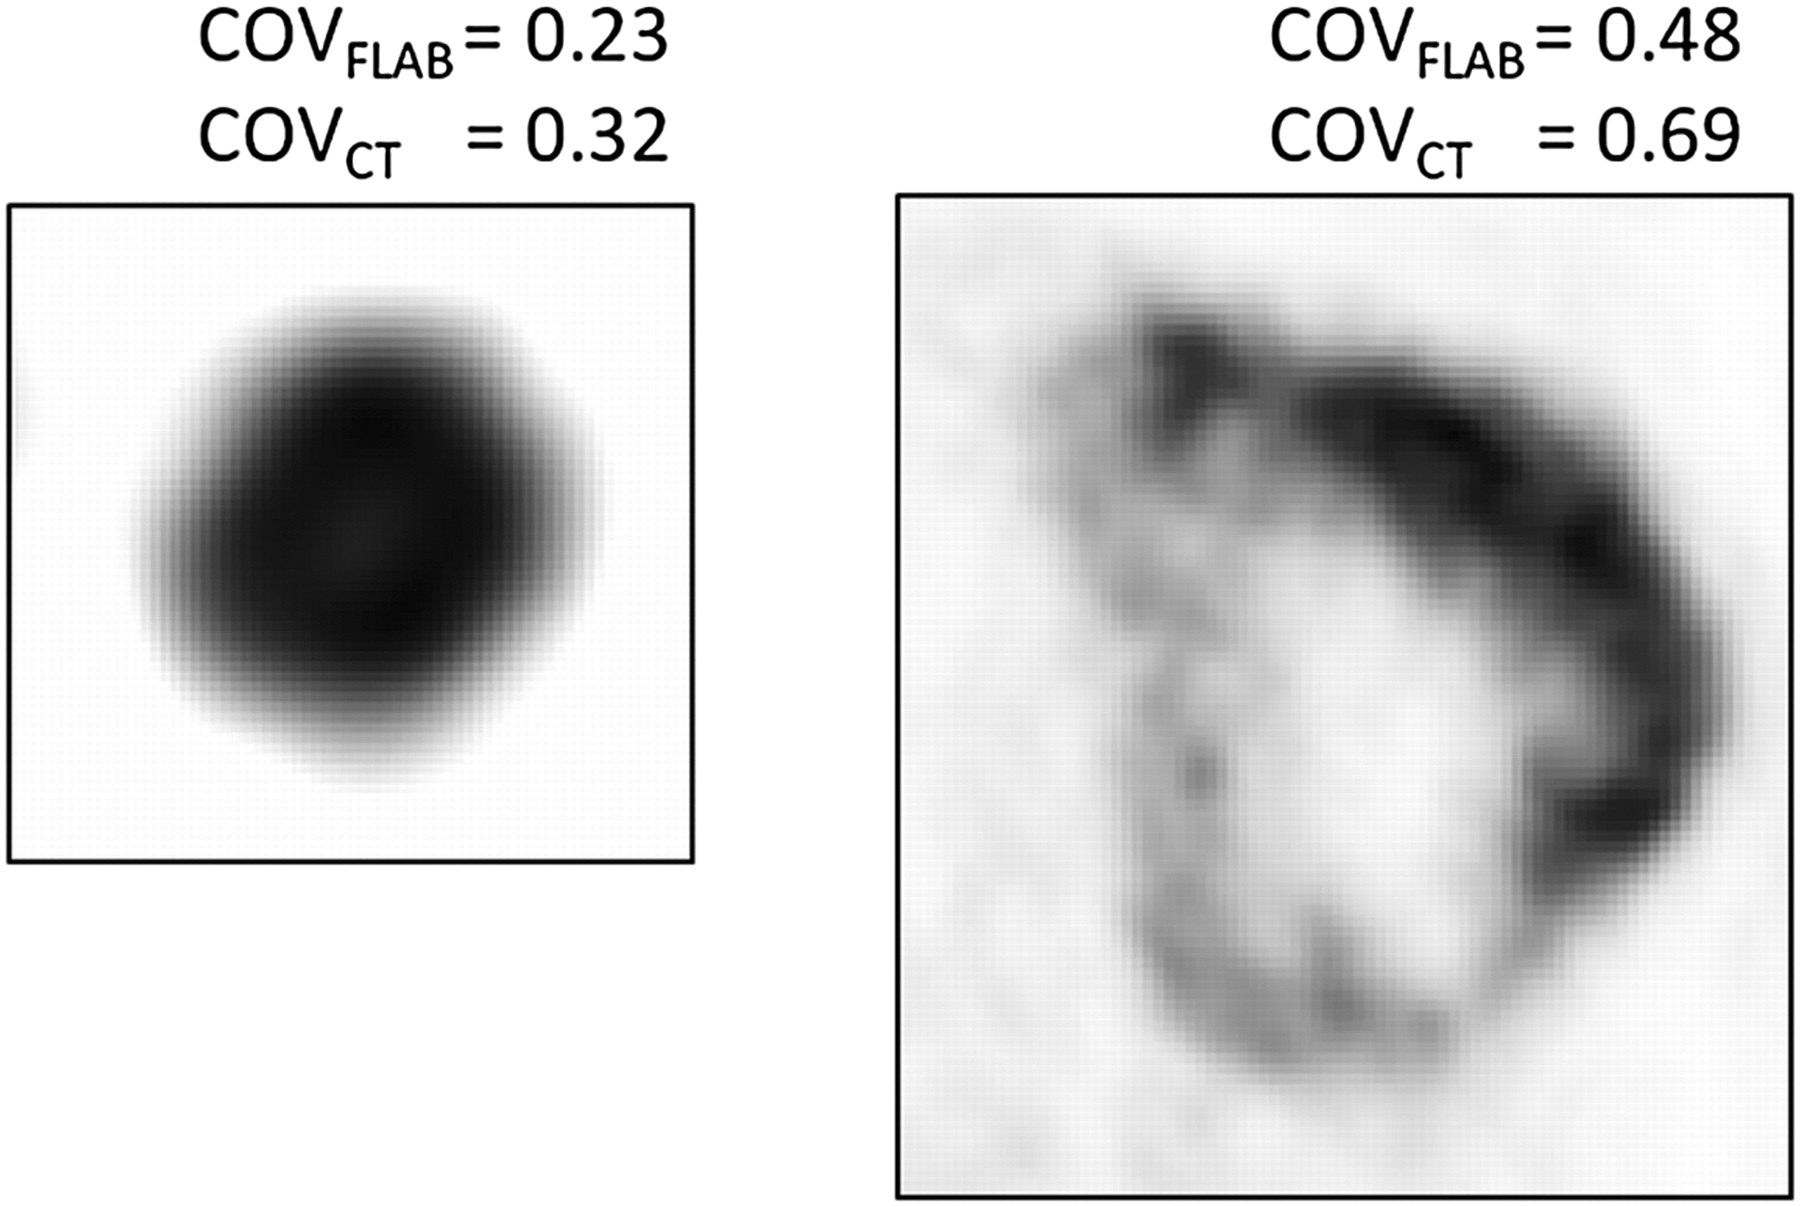
The calculated COVs using the 2 different delineated tumor volumes (COVFLAB and COVCT) correlated strongly (r = 0.98, P < 0.0001). The heterogeneity of PET uptake in these lung tumors was moderate to high, with a mean COVFLAB of 0.26 ± 0.06 and a range of 0.21–0.48. COVCT was higher, with a mean of 0.37 ± 0.08 (range, 0.3–0.6). Twenty-two of 25 tumors were characterized by a COVFLAB of 0.2–0.3 (0.25–0.4 for COVCT), and the 3 most heterogeneous were characterized by a COVFLAB of 0.32, 0.36, and 0.48 (0.46, 0.48, and 0.69, respectively, for COVCT). Figure 5 shows 2 different lesions and their associated COVCT and COVFLAB. A moderate but significant correlation was found between CT volumes and PET heterogeneity, as larger anatomic volumes exhibited higher heterogeneity (r = 0.44 and r = 0.5 for COVCT and COVFLAB, respectively, P < 0.03). A similar correlation was found between MATVs and the corresponding heterogeneity, as larger functional volumes also exhibited significantly higher heterogeneity (r = 0.51 and r = 0.58 for COVCT and COVFLAB, respectively, P < 0.002).

Heterogeneity estimation for 2 tumors.
Tumor size had an impact on the differences observed between the delineation results using the different images and segmentation approaches considered. A moderate (r = 0.44) correlation was observed between anatomic tumor volumes and the differences between FLAB and T50 results (Fig. 6A). The larger the anatomic size of the lesion, the larger were the differences between FLAB and T50 volumes (P = 0.025). Similar nonsignificant trends were observed for differences between adaptive thresholding volumes or manual delineation and FLAB (r < 0.4, P > 0.08). No correlation was found between anatomic tumor size and the differences between CT volumes and all of the PET volumes determined with the different segmentation approaches considered.

Correlation between anatomic volume (A) or uptake heterogeneity (B) and differences between T50 and FLAB volumes.
The impact of PET uptake heterogeneity was more significant than anatomic tumor size on the resulting MATV differences using the PET delineation methodologies considered. As illustrated in Figure 6B, differences between MATV obtained with T50 and FLAB correlated strongly (r < −0.8) with PET heterogeneity (P < 0.0001) estimated either with COVCT or COVFLAB. The higher the heterogeneity within the tumor, the smaller was the MATV obtained with T50 compared with that derived by FLAB. A similar correlation was observed for the differences between FLAB and A1 (r < −0.7, P < 0.0001), as well as between FLAB and manual delineation (r < 0.6, P < 0.001).
DISCUSSION
Interest in the use of MATV delineation on PET for NSCLC has been growing for several years, especially for radiotherapy applications such as dose redistribution, boosting, and painting, for which MATV is not used in place of anatomic volume but rather as a complement to increase or redistribute dose within the lesion (27–29). These techniques are of interest especially for large tumors characterized by heterogeneous uptake within the MATV. However, the optimal MATV delineation methodology is still subject to debate, especially for these tumor cases.
Our results confirm that large discrepancies can be observed in image-based determination of NSCLC tumor volumes according to the methodology used for tumor delineation. Using morphologic imaging and manual delineation, we saw a large overestimation of tumor volume as previously described by several authors (13). Using a fixed threshold of 50% as recommended by Wu et al. (11), the estimation of the maximum tumor diameter on PET images was not correct. We observed a constant underestimation of the maximum diameter—a finding that differs from those of Wu et al., who reported mostly overestimations of the maximum diameter of the tumor. This difference is most probably related to the size of the tumors considered in the 2 studies. Wu et al. included mostly small tumors (median diameter, 2 cm; range, 1.1–6.5 cm) whereas we considered larger tumors (4 ± 2 cm; range, 1.5–9 cm). The discordant results could be explained by the failure of binary threshold approaches to deal with heterogeneity, which is more present in larger tumors.
On the other hand, we found differences between CT and PET volumes similar to those found by Wu et al. in their subsequent study (13). CT volumes were significantly larger than PET-based volumes in both studies, despite the differences in tumor sizes considered. In our group of patients, we mostly observed that the MATV was completely enclosed in the larger anatomic tumor volumes. Only in a few cases was elevated tracer uptake observed outside the limits of the anatomic tumor, and only a few voxels were involved. This marginal difference may be explained either by imperfect spatial registration between PET and CT or by the impact of respiratory motion.
Using the adaptive thresholding methodology as described by Nestle et al. (8), PET tumor sizes did correlate well with the histopathology-based gold standard, albeit with an underestimation of the maximum diameters in our group of lung tumors. Our results agree with those of Van Baardjwick et al. (4), who previously investigated a slightly different semiautomatic methodology first proposed by Daisne et al. (16).
In the current study, results from the 2 observers using adaptive thresholding were not significantly different, contrary to what was previously observed in the case of esophageal tumors (30,31). However, unlike the rather heterogeneous uptake in the mediastinum surrounding esophageal tumors, the lung uptake is more homogeneous, thus leading to negligible variability in the manually determined background values. Manual delineation was less dependent on the heterogeneity within MATV than were threshold-based methods, leading to satisfactory results with no significant bias (mean error < 10%), although there was a large SD (17%) as some MATV were either largely overestimated (mostly the smaller lesions with lower contrast) or underestimated (some of the most heterogeneous ones with complex shapes). Overall, manual delineation correlated strongly with FLAB (r = 0.96).
Automatic delineation on PET images using FLAB provided the best estimation of tumor diameters, in accordance with our previous evaluation of FLAB performance (18). Other advanced segmentation algorithms able to deal with heterogeneous MATV could potentially yield similar satisfactory results (22,32). In our previous study, FLAB was compared with a fixed threshold at 42%, instead of 50%, but with similar trends in the observed results. Furthermore, in our previous work the segmentation algorithms were applied to the original PET images without up-sampling and therefore with larger voxels. In the present study, resampling was performed for an easier comparison with CT delineations and overlap estimation. This approach resulted in a more accurate estimation of the differences between PET- and CT-based delineation methodologies, without, however, significant differences in the resulting volumes with respect to delineation performed on nonresampled images.
Tracer uptake heterogeneity within the MATV has been recognized as an important factor and a plausible explanation of failed cancer treatments (33). Also in malignancies such as sarcomas, esophageal cancer, cervical cancer, and head and neck cancer, studies have shown that local and regional tracer uptake heterogeneity assessment with PET can predict outcome (34–36). In NSCLC, Nestle et al. has already observed a larger variability between MATV delineations due to spatial tracer uptake heterogeneity, without, however, quantifying this heterogeneity and the associated correlation with the MATV results (8). The impact of heterogeneity on MATV delineation results can be observed and reach statistically significant levels only for objects larger than a few centimeters in diameter, since the limited PET spatial resolution cannot provide accurate imaging of tracer heterogeneity in smaller volumes of interest. These larger tumors are also most frequently encountered in radiotherapy treatment, for which an accurate delineation of the overall MATV may be advantageous, particularly if one considers treatment scenarios involving dose painting or boosting.
Although limited by the small sample of patients and the need to confirm the results in a larger group, our study added several elements to the existing knowledge on the correlation between anatomic tumor size and 18F-FDG PET uptake in NSCLC. Our results suggest that the larger the tumor, the more heterogeneous the 18F-FDG PET uptake is likely to be. This suggestion is in agreement with the expected evolution of NSCLC, since necrosis, hemorrhage, or myxoid changes, known to cause areas of low attenuation on CT images, are more likely to appear in larger tumors. A large, heterogeneous MATV is less likely to be accurately delineated using simple fixed or even adaptive binary threshold methods.
In this study, we used the COV to quantify the heterogeneity of PET tracer uptake within the tumor. This heterogeneity factor does not offer any information on the spatial distribution of the heterogeneity and could potentially result in the same value for very different heterogeneous distributions. However, this simple parameter that provides a global measure of heterogeneity is sufficient for the purposes and objectives targeted in this study, allowing us to observe significant correlations between tracer uptake heterogeneity and differences in the MATV segmentation results, either with COVFLAB or COVCT. The most heterogeneous lesions were characterized by COVFLAB values above 0.3; however, values from 0.2 to 0.3 were distributed in a rather continuous fashion, making it hard to set a threshold value allowing the differentiation of homogeneous from heterogeneous distributions. A more detailed characterization of the spatial distribution of tumor heterogeneity, which was outside the scope of this study, can be obtained using, for instance, local and regional textural features (35).
In studies such as the present one and those published previously within the same context, a common limitation is the lack of respiratory gating. Four-dimensional PET can provide solutions to improve subvolume delineation for dose-painting applications (37). However, in our dataset the large size of the tumors should have reduced the potential impact of respiratory motion on the results. In theory, the MATV could have been overestimated for the smallest lesions by both respiratory motion and partial-volume effects. In practice, in our patients only a small fraction of the lesions (10%–20%) were smaller than 2–3 cm.
Finally, a second limitation of our study was the determination of tumor extent based on the measurement of maximum diameter and not the entire volume. Errors in maximum diameter may translate into significantly larger errors with respect to the entire functional volume, especially when heterogeneous uptake distributions are considered. It is indeed possible to obtain an accurate maximum diameter with inaccurate 3-dimensional delineations, especially for complex shapes. Unfortunately full-volume histopathology datasets, for which protocols and corresponding volume estimations are associated with numerous approximations and inaccuracies, are not available yet for NSCLC. Hence, the maximum diameter measurements can be considered as a satisfactory surrogate and have been used in most clinical studies.
CONCLUSION
Volumes based on CT images were systematically and significantly larger than those based on PET images. In addition, tumor size and PET uptake heterogeneity had a significant impact on the MATV PET delineation results using semi- or fully automatic image segmentation tools. Our results indicate that for a case of large, heterogeneous NSCLC, fixed and adaptive thresholding should not be used for the MATV delineation of 18F-FDG PET uptake. These methods inherently assume homogeneous uptake in both background and MATV and therefore tend to largely underestimate the spatial extent of the functional tumor in such cases. The use of thresholding approaches should be restricted to smaller lesions with sufficient tumor-to-background contrast or for larger tumors exhibiting homogeneous uptake. For an accurate automatic delineation of MATV in NSCLC, advanced image segmentation algorithms able to deal with tracer uptake heterogeneity should be used.
DISCLOSURE STATEMENT
The costs of publication of this article were defrayed in part by the payment of page charges. Therefore, and solely to indicate this fact, this article is hereby marked “advertisement” in accordance with 18 USC section 1734.
Acknowledgments
This work was partly funded by the French National Research Agency under contract ANR-08-ETEC-005-01. No other potential conflict of interest relevant to this article was reported.
Footnotes
Published online Oct. 11, 2011.
- © 2011 by Society of Nuclear Medicine
REFERENCES
- Received for publication May 30, 2011.
- Accepted for publication August 17, 2011.


Jump to section
Related Articles
Cited By...
- Surgical and Oncological Factors Affecting the Successful Engraftment of Patient-derived Xenografts in Pancreatic Ductal Adenocarcinoma
- 18F-FDG PET Uptake Characterization Through Texture Analysis: Investigating the Complementary Nature of Heterogeneity and Functional Tumor Volume in a Multi-Cancer Site Patient Cohort
- Visual Versus Quantitative Assessment of Intratumor 18F-FDG PET Uptake Heterogeneity: Prognostic Value in Non-Small Cell Lung Cancer
- Interobserver Agreement of Qualitative Analysis and Tumor Delineation of 18F-Fluoromisonidazole and 3'-Deoxy-3'-18F-Fluorothymidine PET Images in Lung Cancer
- Tumor Heterogeneity and Permeability as Measured on the CT Component of PET/CT Predict Survival in Patients with Non-Small Cell Lung Cancer
- Comparison Between 18F-FDG PET Image-Derived Indices for Early Prediction of Response to Neoadjuvant Chemotherapy in Breast Cancer