

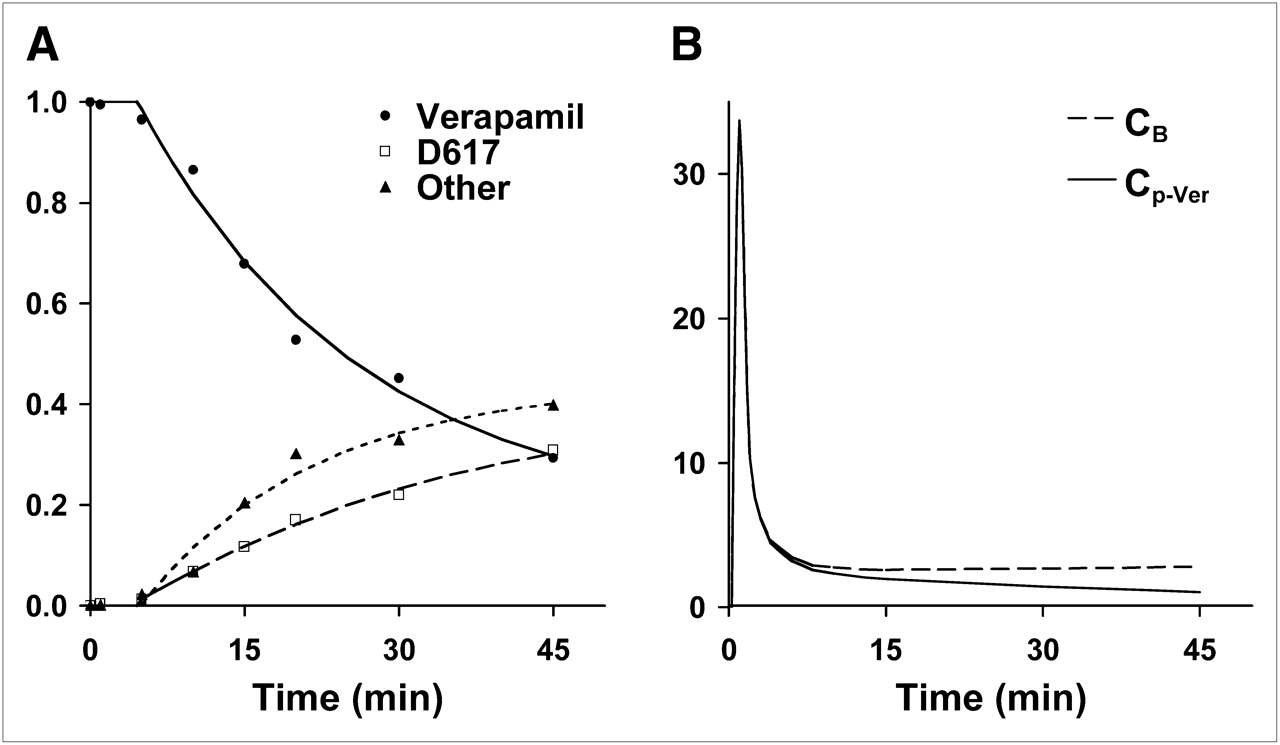
FIGURE 2.

(A) Verapamil in blood declined rapidly to an average of 37% on average at 45 min after injection. In this subject example, exponential washout function (—) fit to verapamil measurements (•) provided fraction of verapamil as a function of time. Metabolites of verapamil in plasma, D617 fraction (▴) and other, polar metabolites (▪) continually rose during imaging study, reaching a combined total metabolite fraction of over 60%. (B) Verapamil model input function, Cp-Ver, is a combination of total blood activity, CB, and the fraction of verapamil determined from plasma metabolite analysis. Similar curves were obtained for all 12 subjects. Mean verapamil fraction at 45 min was 40% (range, 66%−24%), D617 fraction was 30% (range, 49%−17%), and other metabolites were 30% (range, 44%−16%).
In this issue


Related Articles
Cited By...
- Imaging P-Glycoprotein Induction at the Blood-Brain Barrier of a {beta}-Amyloidosis Mouse Model with 11C-Metoclopramide PET
- Synthesis and Characterization of Bodipy-FL-Cyclosporine A as a Substrate for Multidrug Resistance-Linked P-Glycoprotein (ABCB1)
- Impact of P-Glycoprotein Function on the Brain Kinetics of the Weak Substrate 11C-Metoclopramide Assessed with PET Imaging in Humans
- Characterization of P-Glycoprotein Humanized Mice Generated by Chromosome Engineering Technology: Its Utility for Prediction of Drug Distribution to the Brain in Humans
- Assessment of P-Glycoprotein Transport Activity at the Human Blood-Retina Barrier with (R)-11C-Verapamil PET
- Strategies to Inhibit ABCB1- and ABCG2-Mediated Efflux Transport of Erlotinib at the Blood-Brain Barrier: A PET Study on Nonhuman Primates
- Clinical Applications of Simultaneous PET/MR Imaging Using (R)-[11C]-Verapamil with Cyclosporin A: Preliminary Results on a Surrogate Marker of Drug-Resistant Epilepsy
- Imaging the Impact of the P-Glycoprotein (ABCB1) Function on the Brain Kinetics of Metoclopramide
- Modulation of P-glycoprotein at the Human Blood-Brain Barrier by Quinidine or Rifampin Treatment: A Positron Emission Tomography Imaging Study
- Role of (Drug) Transporters in Imaging in Health and Disease
- Activity of P-Glycoprotein, a {beta}-Amyloid Transporter at the Blood-Brain Barrier, Is Compromised in Patients with Mild Alzheimer Disease
- Role of P-Glycoprotein in the Distribution of the HIV Protease Inhibitor Atazanavir in the Brain and Male Genital Tract
- Induction of P-Glycoprotein by Antiretroviral Drugs in Human Brain Microvessel Endothelial Cells
- Transporters and Drug-Drug Interactions: Important Determinants of Drug Disposition and Effects
- Modeling Cyclosporine A Inhibition of the Distribution of a P-Glycoprotein PET Ligand, 11C-Verapamil, into the Maternal Brain and Fetal Liver of the Pregnant Nonhuman Primate: Impact of Tissue Blood Flow and Site of Inhibition
- The controversial role of ABC transporters in clinical oncology
- A Novel Positron Emission Tomography Imaging Protocol Identifies Seizure-Induced Regional Overactivity of P-Glycoprotein at the Blood-Brain Barrier
- Multiagent PET for Risk Characterization in Sarcoma
- A Pilot Study to Assess the Efficacy of Tariquidar to Inhibit P-glycoprotein at the Human Blood-Brain Barrier with (R)-11C-Verapamil and PET