


Abstract
11C-Pittsburgh Compound-B (11C-PIB) and 18F-(2-(1-{6-[(2-[18F]fluoroethyl)(methyl)amino]-2-naphthyl}ethylidene) (18F-FDDNP) have been developed as PET tracers for in vivo imaging of pathology in Alzheimer's disease (AD). The purpose of this study was to directly compare these tracers in patients with AD, patients with mild cognitive impairment (MCI), and healthy controls. Methods: Paired 11C-PIB and 18F-FDDNP scans were acquired in 14 patients with AD, 11 patients with amnestic MCI, and 13 controls. For both tracers, parametric images of binding potential (BPND) were generated. Global cortical BPND was assessed using ANOVA. In addition, regional patterns of BPND were compared between diagnostic groups using ANOVA for repeated measures. Results: Global cortical BPND of 11C-PIB showed higher binding in patients with AD than in controls and patients with MCI. 18F-FDDNP uptake was higher in patients with AD than in controls, but MCI could not be distinguished from AD or from controls. Global BPND values of both tracers were moderately correlated (r = 0.45; P = 0.005). In MCI, BPND of 11C-PIB showed a bimodal distribution, whereas values for 18F-FDDNP were more widespread, with more MCI patients demonstrating increased uptake. Regional 11C-PIB binding showed different patterns across diagnostic groups, as AD patients showed an overall increase in binding, with the lowest binding in the medial temporal lobe. With 18F-FDDNP, patterns were similar across diagnostic groups. For all groups, highest values were observed in the medial temporal lobe. Conclusion: Differences in BPND between patients with AD, patients with MCI, and controls were more pronounced for 11C-PIB. The difference in regional binding, the moderate correlation, and the discrepant findings in MCI suggest that they measure related, but different, characteristics of the disease.
Alzheimer's disease (AD) is a progressive neurodegenerative disorder. The diagnosis of AD during life is based on clinical criteria, which have low sensitivity and specificity in the early stages of the disease (1). Mild cognitive impairment (MCI) is characterized by mild cognitive deficits; at the time of diagnosis, MCI patients do not have dementia, but they have an increased risk of progression to dementia (2). Ongoing developments in AD therapy dictate the need for developing techniques that identify subjects with incipient AD among patients with MCI. In vivo imaging of the pathology underlying AD holds promise for providing such a method.
Neuropathologically, AD is characterized by the accumulation of amyloid-β (Aβ) in senile plaques and hyperphosphorylated τ-protein in neurofibrillary tangles. Neurofibrillary tangles are thought to be present mainly in the medial temporal lobe (MTL) and lateral temporal lobe and, to a lesser extent, in the frontal, parietal, and occipital lobes. Amyloid plaques are more evenly distributed throughout the cortex, with relatively mild involvement of the hippocampal formation (3).
Over the past 2 decades, PET tracers have been developed for in vivo imaging of AD pathology. Of these ligands, 11C-Pittsburgh Compound-B (PIB) (4) and 18F-(2-(1-{6-[(2-[18F]fluoroethyl)(methyl)amino]-2-naphthyl}ethylidene) malononitrile) (18F-FDDNP) (5) have been used most widely.
First results with 11C-PIB showed greater cortical retention in patients with AD than in controls (4,6–8). This finding has been replicated several times in AD studies and has been extended to MCI patients in whom a more bimodal distribution has been described (9–13). It was also possible to distinguish between AD, MCI, and controls using 18F-FDDNP, but presently these findings have not been replicated (5).
Paired studies in the same subjects with validated tracer kinetic models are needed for a meaningful comparison. The aim of the present study was to directly compare global and regional uptake of 11C-PIB and 18F-FDDNP using validated quantitative methods in the same healthy controls and AD and MCI patients.
MATERIALS AND METHODS
Subjects
Fourteen AD patients, 11 amnestic MCI patients, and 13 healthy controls were included in this study. All subjects received a standard dementia screening that included medical history, physical and neurologic examinations, screening laboratory tests, brain MRI, and extensive neuropsychological testing. Among the neuropsychologic tests were the Mini Mental State Examination (MMSE) (14) and the Dutch version (15) of the Ray Auditory Verbal Learning Test (RAVLT) (16), a test specifically for episodic memory. Clinical diagnosis was established by the consensus of members of a multidisciplinary team, without knowledge of the PET results. All AD patients met criteria proposed by the National Institute of Neurological and Communicative Disorders and Stroke and the Alzheimer's Disease and Related Disorders Association (17) for “probable AD.” Seven of the 14 AD patients were taking acetylcholine esterase inhibitors. Two AD patients used psychotropic medication (1 used a benzodiazepine and 1 a selective serotonin reuptake inhibitor). MCI patients met the Petersen criteria (2) based on subjective and objective cognitive impairment, predominantly affecting memory, in the absence of dementia or significant functional loss. Two patients with MCI used psychotropic medication (1 used a benzodiazepine and 1 a selective serotonin reuptake inhibitor). Controls were recruited through advertisements in newspapers and underwent the same diagnostic procedures; none of the controls used psychotropic medication.
Exclusion criteria were a history of major psychiatric or neurologic (other than AD) illness and the use of nonsteroidal antiinflammatory drugs, because these have been reported to compete with 18F-FDDNP for binding to Aβ fibrils in vitro and to Aβ plaques ex vivo (18). Additional exclusion criteria for controls were subjective memory complaints or clinically significant abnormalities on the MRI (as determined by a neuroradiologist). Written informed consent was obtained from all subjects after a complete written and verbal description of the study. The study was approved by the Medical Ethics Review Committee of the VU University Medical Centre.
PET
PET scans were obtained on an ECAT EXACT HR+ scanner (Siemens/CTI) equipped with a neuroinsert to reduce the contribution of scattered photons. This scanner enables the acquisition of 63 transaxial planes over a 15.5-cm axial field of view, thus allowing the whole brain to be imaged in 1 bed position. The properties of this scanner have been reported elsewhere (19). All subjects received a venous cannula for tracer injection. First, a 10-min transmission scan was acquired in 2-dimensional acquisition mode using 3 retractable rotating line sources. This scan was used to correct the subsequent emission scan for photon attenuation. Next, a dynamic emission scan in 3-dimensional acquisition mode was started simultaneously with the intravenous injection of 11C-PIB (351 ± 82 MBq), synthesized according to a modified procedure of Wilson et al. (20), with a specific activity of 41 ± 22 GBq/μmol using an infusion pump (Med-Rad; Beek) at a rate of 0.8 mL/s, followed by a flush of 42 mL of saline at 2.0 mL/s. This scan consisted of 23 frames increasing progressively in duration (1 × 15, 3 × 5, 3 × 10, 2 × 30, 3 × 60, 2 × 150, 2 × 300, 7 × 600 s), for a total frame duration of 90 min. Finally, after a resting period of at least 1 h to allow for decay of 11C, exactly the same procedure was repeated but now using an injection of 18F-FDDNP (177 ± 14 MBq) (21), with a specific activity of 86 ± 51 GBq/μmol. Patient motion was restricted by an immobilization device and monitored by laser beams that checked the position of the patient's head.
MRI
All subjects underwent structural MRI using a 1.5-T Sonata scanner (Siemens). The scan protocol included a coronal T1-weighted 3-dimensional magnetization-prepared rapid-acquisition gradient echo (MPRAGE) (slice thickness, 1.5 mm; 160 slices; matrix size, 256 × 256; voxel size, 1 × 1 × 1.5 mm; echo time, 3.97 ms; repetition time, 2,700 ms; inversion time, 950 ms; flip angle, 8°), which was used for coregistration and region-of-interest (ROI) definition.
Image and Data Analysis
All PET sinograms were corrected for dead time, tissue attenuation using the transmission scan, decay, scatter, and randoms and were reconstructed using a standard filtered backprojection algorithm and a Hanning filter with a cutoff at 0.5 times the Nyquist frequency. A zoom factor of 2 and a matrix size of 256 × 256 × 63 were used, resulting in a voxel size of 1.2 × 1.2 × 2.4 mm and a spatial resolution of approximately 7-mm full width at half-maximum at the center of the field of view. Images were then transferred to workstations (Sun Microsystems) for further analysis.
MR images were aligned to corresponding PET images using a mutual-information algorithm. Data were further analyzed using PVE-lab, a software program that uses a probability map based on 35 delineated ROIs that have been validated previously (22). No correction for partial-volume effects was applied to the PET data.
ROIs were projected onto 11C-PIB and 18F-FDDNP parametric images of binding potential (BPND). These parametric images were generated by applying a 2-step basis-function implementation of the simplified reference tissue model, with cerebellar gray matter as the reference tissue (RPM2) (23), to the full dynamic 90-min PET data. RPM2, a fully quantitative method for assessing the data, was identified as the parametric method of choice because it provided the best results for both tracers (24,25). The outcome measure BPND is a quantitative measure of specific binding. It reflects the concentration of specifically bound tracer relative to the concentration of free and nonspecifically bound tracer in tissue under equilibrium (26). For regional analyses, BPND of frontal (volume-weighted average of orbital frontal, medial inferior frontal, and superior frontal), parietal, and temporal (volume-weighted average of superior temporal and medial inferior temporal) cortices and MTL (volume-weighted average of enthorinal cortex and hippocampus) and posterior cingulate was used. In addition, a global cortical ROI was defined, based on the volume-weighted average of all these regions. Cerebellar gray matter was chosen as the reference tissue because of its (histopathologic) lack of Congo red– and thioflavin-S–positive plaques (27,28).
Statistics
Data are presented as mean ± SD, unless otherwise stated. Differences between groups were assessed using ANOVA with post hoc LSD tests and age as a covariate. Associations between 11C-PIB and 18F-FDDNP were assessed using the Pearson correlation coefficient. The regional binding pattern of both 11C-PIB and 18F-FDDNP between subject groups was assessed using ANOVA for repeated measures with diagnosis as a between-subjects factor, brain region as a within-subjects factor, and age as a covariate. Separate models were run with 11C-PIB and 18F-FDDNP as dependent variables. A P value below 0.05 was considered significant.
RESULTS
11C-PIB and 18F-FDDNP studies were performed on the same day, except for 1 AD patient, 3 MCI patients, and 2 healthy controls, who were scanned with an average interval of 3 wk because of radiosynthesis failure. The 3 groups were similar with respect to age and sex (Table 1). MMSE scores were available for all subjects. AD patients had lower MMSE scores than did controls and MCI patients. MMSE scores between the latter 2 groups did not differ. The Dutch version of the RAVLT was performed in all subjects, except for 3 AD patients.
Demographic and Clinical Characteristics According to Diagnostic Group
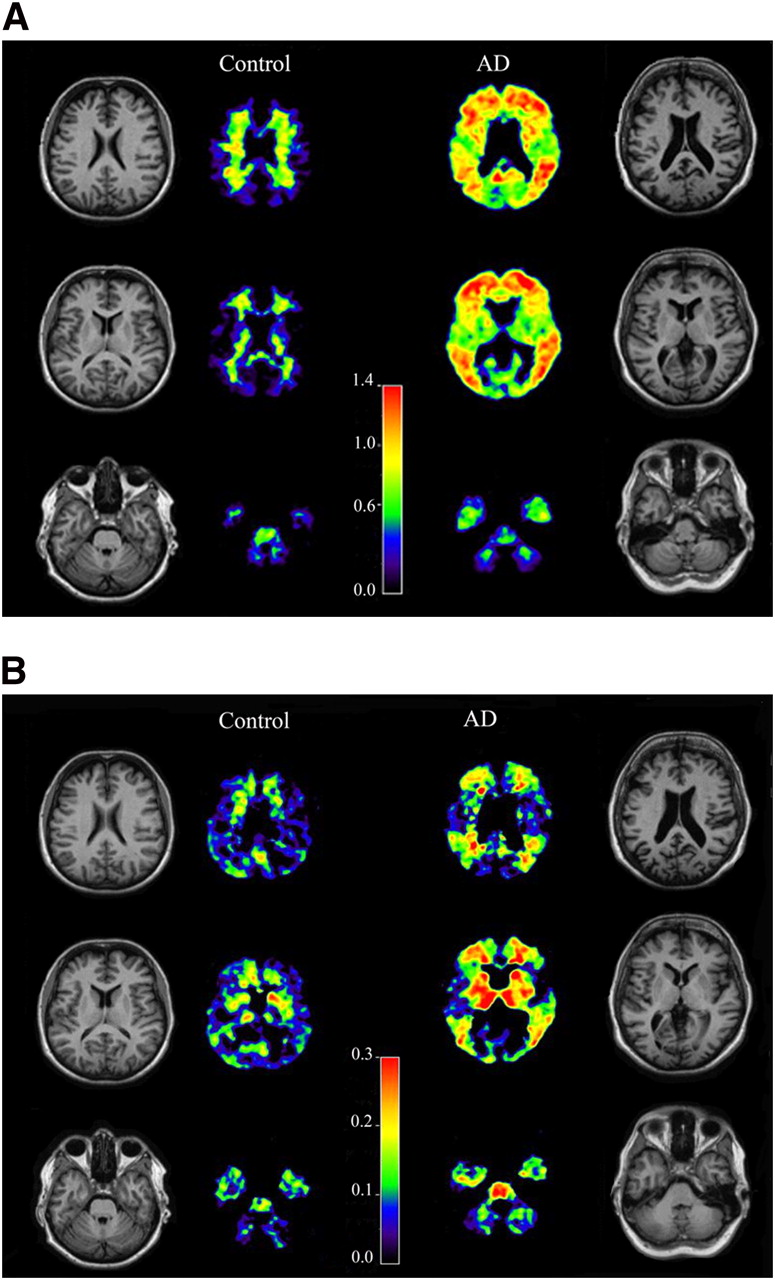
Visual inspection of the PET images (Fig. 1) confirmed the known high cortical 11C-PIB binding in AD, with predominantly white matter uptake in controls. The specific component of 18F-FDDNP was less distinct, and high binding was observed in the striatum and thalamus. The latter regions were not part of the average global cortical region.

Examples of parametric 11C-PIB (A) and 18F-FDDNP (B) BPND images in healthy control and AD patient. 11C-PIB and 18F-FDDNP scans were acquired in same subjects. In each panel, control is on the left and AD patient is on the right. High level of 18F-FDDNP binding in subcortical structures suggests nonspecific binding.
Average global cortical BPND for 11C-PIB was 0.85 ± 0.10 in patients with AD, 0.28 ± 0.29 in patients with MCI, and 0.11 ± 0.15 in controls (Fig. 2A). ANOVA, with an adjustment for age, showed a significant difference between groups (P < 0.0001). Post hoc LSD tests showed higher 11C-PIB binding in AD patients than in controls and MCI patients (both P < 0.0001). Furthermore, 11C-PIB binding in MCI patients differed from that in controls (P = 0.03). In AD, average 18F-FDDNP global cortical BPND was approximately 9-fold lower than average 11C-PIB global cortical BPND. Values were 0.09 ± 0.02 in AD patients, 0.08 ± 0.05 in MCI patients, and 0.05 ± 0.03 in controls (Fig. 2B). ANOVA with adjustment for age showed a difference between groups (P = 0.04). Post hoc LSD testing showed higher global 18F-FDDNP BPND in AD patients than in controls (P = 0.01), but 18F-FDDNP BPND in MCI patients could not be distinguished from that in either AD patients (P = 0.54) or controls (P = 0.07). 11C-PIB BPND in MCI patients appeared to be bimodal, with values similar to those in either AD patients or controls. In contrast, 18F-FDDNP BPND values for MCI patients were quite dispersed; some MCI patients had lower values than most controls and others even had higher values than did AD patients. Across diagnostic groups, there was a moderate correlation of BPND values between the 2 tracers (r = 0.45; P = 0.005; Fig. 3). Within diagnostic groups, however, there was no significant correlation (AD, r = −0.18; MCI, r = 0.34; controls, r = 0.42; all, P > 0.15). This discrepancy in binding between tracers within subjects is best demonstrated by 3 MCI patients, who, compared with the controls, displayed relatively high 18F-FDDNP uptake but similar 11C-PIB binding (Fig. 3).

Scatter plots of global cortical 11C-PIB BPND (A) and global cortical 18F-FDDNP BPND (B), by diagnostic group. Horizontal lines between symbols represent mean values. Scale is 6-fold lower in B than in A. Differences between groups were assessed using ANOVA (adjusted for age, post hoc LSD correction). □ = controls; ▵ = MCI; ○ = AD. *P < 0.05. **P < 0.0001.
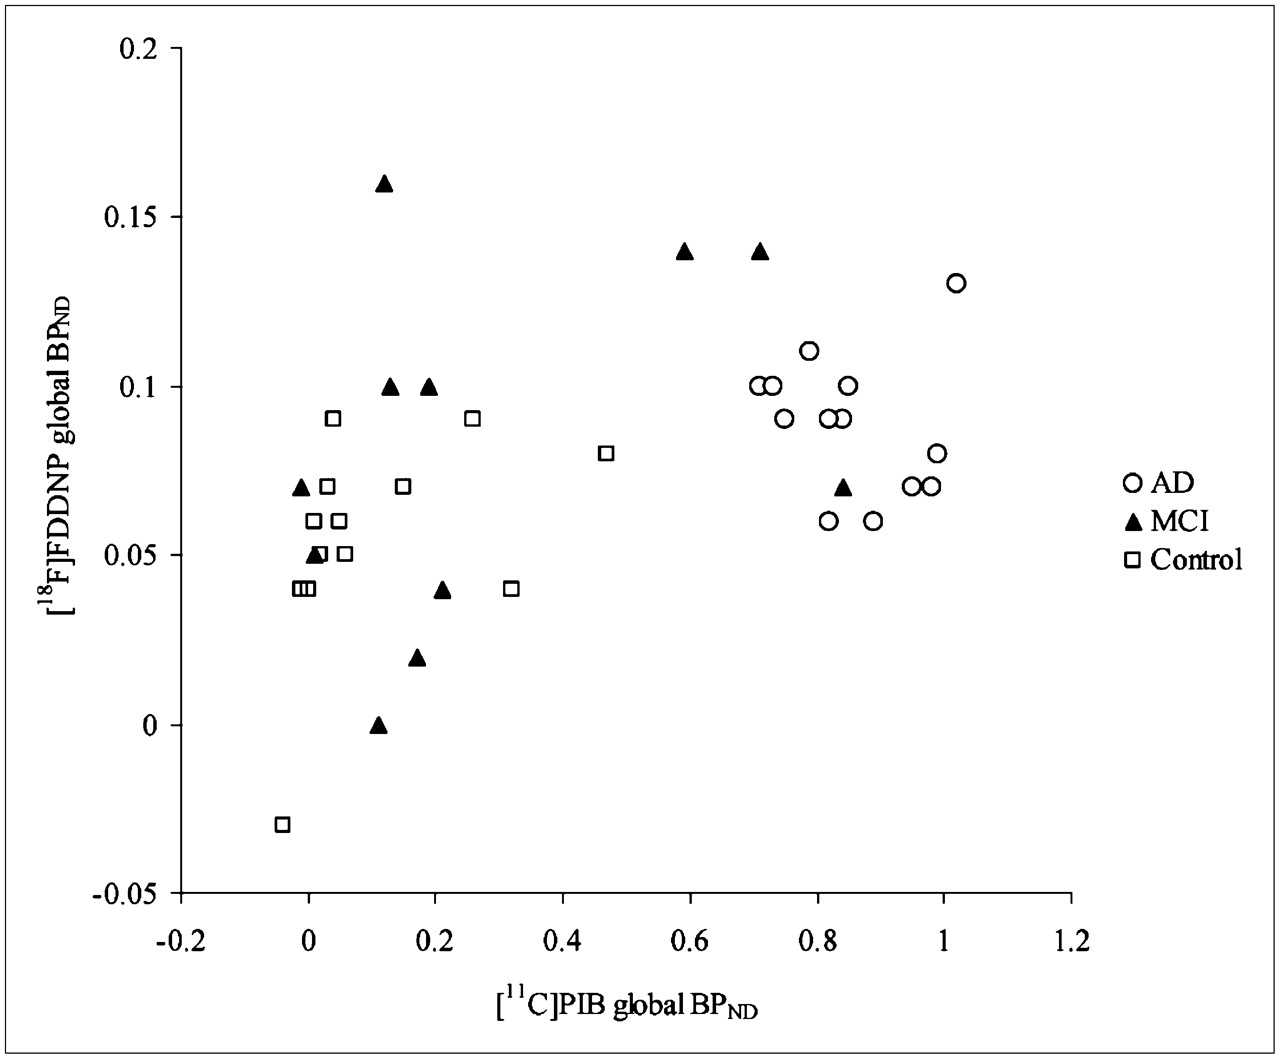
Correlation between 11C-PIB BPND and 18F-FDDNP BPND. Across diagnostic groups, there was moderate correlation between BPND values of the 2 tracers (r = 0.45; P = 0.005, Pearson correlation). Discrepancy in binding between tracers within subjects is best demonstrated by the 3 MCI patients at top of figure. Compared with controls, these 3 MCI patients displayed high 18F-FDDNP uptake but similar 11C-PIB binding.
There was a strong correlation between 11C-PIB and MMSE scores across diagnostic groups (r = −0.75; P < 0.0001). 18F-FDDNP showed a moderate correlation with MMSE (r = −0.39; P = 0.02) across groups. Furthermore, there was a strong correlation across diagnostic groups between 11C-PIB and the Dutch version of the RAVLT (r = −0.63; P < 0.0001). 18F-FDDNP showed a reasonably good correlation with the Dutch version of the RAVLT (r = −0.47; P < 0.01). Subsequently, regional binding patterns were investigated (Table 2; Fig. 4). In the case of 11C-PIB, ANOVA for repeated measures showed a significant main effect of diagnostic group (P < 0.0001) and brain region (P = 0.02). Moreover, an interaction between diagnostic group and brain region (P < 0.0001) was found, indicating different regional binding patterns between diagnostic groups. In controls, 11C-PIB binding was equal in all regions. Patients with AD, and to a lesser extent patients with MCI, showed markedly increased 11C-PIB binding in all regions, except in MTL, where binding was relatively low, compared with the uptake in the other regions (Fig. 4A). For 18F-FDDNP, there was a main effect of diagnostic group (P = 0.05) and region (P = 0.001). No interaction was found, indicating that regional differences were similar across diagnostic groups. AD patients, compared with controls, displayed an overall increase in binding, with MCI patients in between. Highest binding was seen in the (medial) temporal lobe and lower binding in the frontal, parietal, and posterior cingulate areas, with comparable patterns for the 3 diagnostic groups (Fig. 4B).
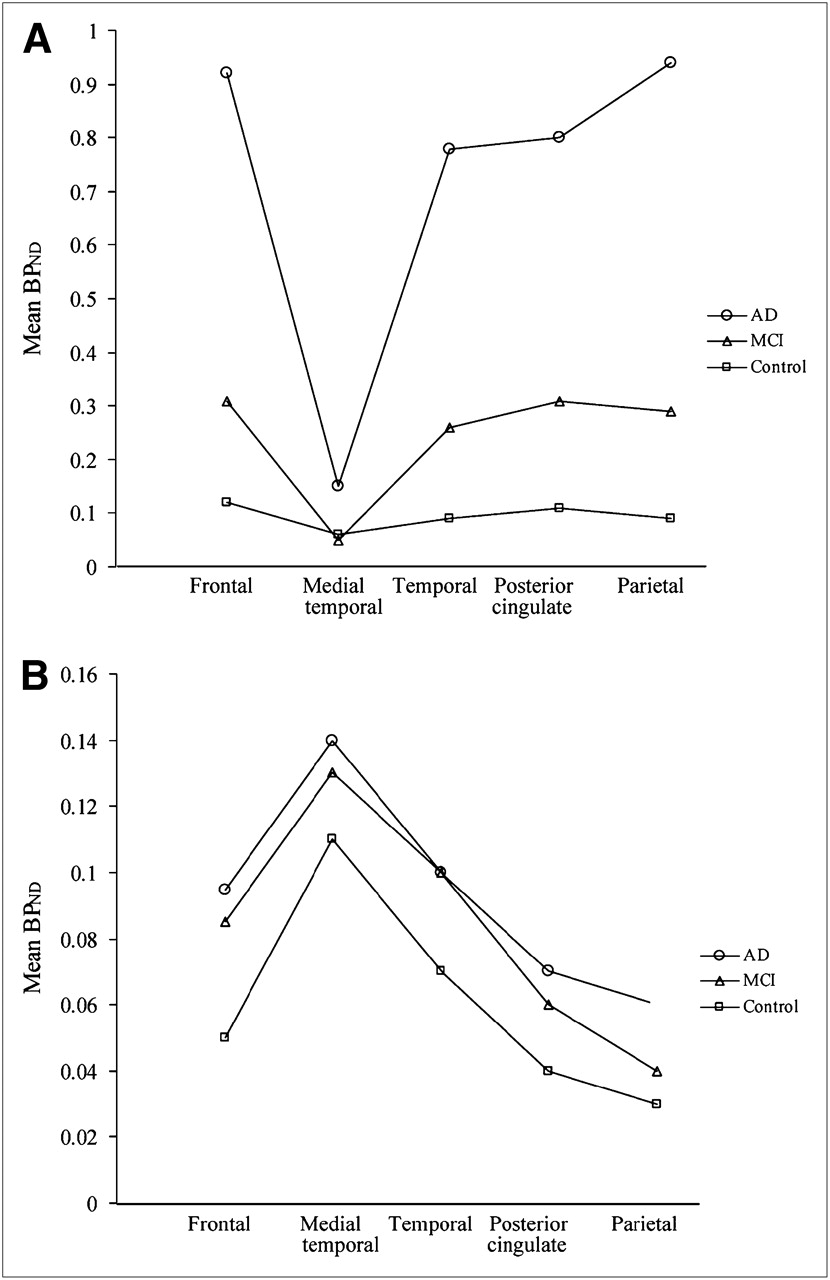
Regional binding pattern of both 11C-PIB (A) and 18F-FDDNP (B) between subject groups. Binding was assessed using ANOVA for repeated measures adjusted for age with diagnosis as between-subjects factor and brain region as within-subjects factor. Separate models were run with 11C-PIB and 18F-FDDNP as dependent variables. A P value below 0.05 was considered significant. Regional 11C-PIB binding pattern had significant main effect in subject group (P < 0.0001) and brain region (P = 0.02) and an interaction between subject group and brain region (P < 0.0001). Regional 18F-FDDNP binding pattern had significant main effect in subject group (P = 0.05) and brain region (P = 0.001), but without interaction.
Regional 11C-PIB and 18F-FDDNP Binding (BPND) Data by Diagnostic Group
DISCUSSION
This study directly compared global cortical and regional binding of 11C-PIB and 18F-FDDNP in the same AD and MCI patients and controls. Marked differences were revealed between the 2 tracers: global cortical binding of both tracers was only moderately correlated, binding in MCI patients varied between tracers, and regional binding patterns of both tracers differed substantially. These results all suggest that both tracers bind to different aspects of the neuropathology underlying cognitive decline associated with dementia.
Assessment of global cortical binding showed that both tracers were able to distinguish AD patients from controls on a group level. However, the specific binding of 11C-PIB in AD patients was substantially higher than that of 18F-FDDNP. Moreover, all AD patients displayed increased global cortical 11C-PIB binding without overlap with controls. In contrast, global cortical 18F-FDDNP binding in AD patients showed substantial overlap with that in controls. This overlap is probably due to a higher level of nonspecific binding (binding other than to amyloid or tangles) in both groups, leading to a lower specific-to-nonspecific binding ratio. Consequently, at a group level differentiation is possible. However, identification of increased uptake in individual cases may prove to be difficult with 18F-FDDNP, but is possible with 11C-PIB. These results suggest that the accuracy of 18F-FDDNP as a differential diagnostic tool for detection of Alzheimer pathology in individual subjects will be lower than that of 11C-PIB.
For both tracers, MCI patients showed average binding intermediate between AD patients and controls. 11C-PIB binding in MCI patients was similar to that demonstrated in either controls or AD patients. This bimodal distribution of 11C-PIB binding in MCI patients is consistent with results from other studies (10–13). With 18F-FDDNP, the distribution of binding was more widespread. A larger number of MCI patients displayed increased global cortical 18F-FDDNP uptake, in some patients even exceeding that demonstrated in AD patients. In the only other report on 18F-FDDNP in MCI (5), MCI patients as a group showed intermediate 18F-FDDNP binding, and all patients displayed lower binding than that shown in AD patients with the highest binding, a finding that is somewhat discrepant with the present results and is probably due to patient selection.
Regional binding showed different patterns between the 2 tracers. For 11C-PIB, there was a difference in regional binding patterns between diagnostic groups. AD patients, compared with healthy controls, showed increased binding in all brain regions, with the smallest increase in the MTL. For 18F-FDDNP, regional binding patterns were comparable between diagnostic groups. AD patients, compared with controls, displayed an overall increase in binding, with MCI patients in between. For all 3 groups, highest values across brain regions were found in the MTL. The differences in regional binding can be explained by the binding characteristics of 11C-PIB and 18F-FDDNP: the in vivo cortical uptake of 11C-PIB primarily reflects Aβ-related cerebral amyloidosis (29), whereas uptake of 18F-FDDNP results from binding to both amyloid depositions and neurofibrillary tangles (30). The idea of different binding sites for 11C-PIB and 18F-FDDNP as a cause for differences in binding patterns is further supported by a recently published study comparing the 2 tracers in aged and young macaques (31). Relatively low binding of 11C-PIB in the MTL of AD patients is consistent with the low level of amyloid depositions in this region (32). Therefore, the relatively high binding of 18F-FDDNP in MTL suggests that this could be due to in vivo binding to neurofibrillary tangles, which are abundant in MTL. In the present study, 3 MCI patients displayed high 18F-FDDNP binding, and 11C-PIB binding was within the reference range. One can speculate that these MCI patients may have a prodromal dementia other than AD, for instance, a disease of the τ-proteins, contributing to the relatively high 18F-FDDNP uptake. Further studies are needed, however, to substantiate this hypothesis.
In general, the present results are in line with those reported in previous 11C-PIB studies (mostly expressed as distribution volume ratio, which equals BPND + 1) (4,8,11,33). Previously published levels of global and regional binding (also expressed as distribution volume ratio) for 18F-FDDNP were slightly higher for AD (5); AD patients in the present study, however, were on average 10 y younger than those in the previously published study. Therefore, these differences could be due to differences in age, as tangle load has been reported to increase with age (34).
To date, 2 studies have compared both amyloid tracers in human subjects. The first study was performed in 2 different individuals with a hereditary prion disease, still making it difficult to provide an objective comparison of the 2 tracers (35). In a more recent study, Shin et al. (36) presented the first intrasubject comparison of 11C-PIB and 18F-FDDNP in healthy controls and AD subjects. They reported negligible 11C-PIB uptake but strong 18F-FDDNP uptake in the MTL in AD patients, whereas there was significant uptake of both tracers in neocortical areas. Although rather similar in design, there are several important differences in methods between this multitracer study and the present study. AD patients were, on average, 10 y older and had more severe AD with a mean MMSE score of 13. No MCI patients were included, and scans were performed on separate days. The average injected dose of 11C-PIB was similar, whereas the average injected dose of 18F-FDDNP was lower. The total amount of injected 18F-FDDNP (labeled and nonlabeled) and thus the occupation of the number of binding sites, however, were approximately equal. PET data were analyzed using only semiquantitative methods. For 11C-PIB, standardized uptake value ratios (SUVr), which is the target–to–gray matter cerebellar SUVr over the interval 40–60 min after injection, has been used to quantify PET data. Although this method has been validated for visualizing 11C-PIB accumulation (7), it may suffer from bias due to flow effects. Simple tissue ratios using 40- to 60-min data, such as SUVR40–60, have been reported to overestimate specific binding by around 18% compared with a more quantitative model (37). 18F-FDDNP PET data have been quantified using SUVR60–120. Currently, no formal validation of SUVR60–120 has been published for 18F-FDDNP. The use of this nonvalidated analytic method for 18F-FDDNP warrants caution because a relatively small bias can lead to large effects in measured values due to the low specific-to-nonspecific binding ratio of 18F-FDDNP. Despite these essential differences, results were partly in line with each other. Levels of global and regional binding for 11C-PIB agreed well with the present study, for both controls and AD patients. However, levels of 18F-FDDNP binding were substantially higher globally and regionally in AD patients, and levels of 18F-FDDNP binding were substantially higher in the MTL in controls. Although most of the discrepancies found in the results could largely be attributed to differences in patient selection, as tangle load has been reported to increase with age (34) and disease severity (38), potential bias due to the use of nonvalidated analytic methods could also have confounded some of their results.
The main strength of the present study is its unique design, in which dynamic 90-min PET scans with both ligands were performed in the same patients along the spectrum of cognitive decline and on the same day. This design eliminated intersubject differences and thus enabled a balanced comparison.
Because of the longer radioactive decay of the 18F-labeled FDDNP (110 min), compared with 11C-PIB (20 min), the study was set up with 11C-PIB as the first scan. 11C-PIB with high specific activity was injected into tracer amounts (nanograms), leading to a negligible occupancy of 11C-PIB binding sites. In addition, analysis of the 6 patients for whom 11C-PIB and 18F-FDDNP scans were obtained on separate days, compared with 18F-FDDNP binding values of studies performed on a single day, revealed no difference of 18F-FDDNP binding. Therefore, it is highly unlikely that the order of the scans has influenced final results.
CONCLUSION
The regional binding patterns, the moderately correlated global cortical binding, and the findings in MCI patients together imply that 11C-PIB and 18F-FDDNP measure related, but different, aspects of the neuropathology associated with AD. The binding of 18F-FDDNP to pathology other than amyloid may lead to its complementary use with 11C-PIB in the differential diagnosis of dementia. More specially, 18F-FDDNP might be useful in 11C-PIB–negative MCI patients, who could have prodromal dementias other than AD. Inclusion of more subjects, especially MCI patients, and clinical follow-up is needed to substantiate these findings.
Acknowledgments
We thank Anke A. Dijkstra for help with the data analysis, the PET radiochemistry and technology staff of the Division of Nuclear Medicine and PET Research for tracer production and acquisition of PET data, and the technology staff of the Department of Radiology for acquisition of the MRI data. This work was financially supported by the Internationale Stichting Alzheimer Onderzoek (grant 05512), the American Health Assistance Foundation (grant A2005-026), and the FP6 network of excellence DiMI (LSH-2003-1.2.2.-2).
Footnotes
-
COPYRIGHT © 2009 by the Society of Nuclear Medicine, Inc.
References
- Received for publication July 30, 2008.
- Accepted for publication October 30, 2008.


Jump to section
Related Articles
Cited By...
- Distinct disease mechanisms may underlie cognitive decline related to hearing loss in different age groups
- Contribution of genetic and environmental factors to the onset of preclinical Alzheimers disease - a monozygotic twin study
- Optical coherence tomography angiography in preclinical Alzheimers disease
- Assessing Amyloid Pathology in Cognitively Normal Subjects Using 18F-Flutemetamol PET: Comparing Visual Reads and Quantitative Methods
- Comparison of Simplified Parametric Methods for Visual Interpretation of 11C-Pittsburgh Compound-B PET Images
- Longitudinal Amyloid Imaging Using 11C-PiB: Methodologic Considerations
- Novel 18F-Labeled Arylquinoline Derivatives for Noninvasive Imaging of Tau Pathology in Alzheimer Disease
- Target-Specific PET Probes for Neurodegenerative Disorders Related to Dementia
- Molecular imaging in the diagnosis of Alzheimer's disease: visual assessment of [11C]PIB and [18F]FDDNP PET images
- Differential association of [11C]PIB and [18F]FDDNP binding with cognitive impairment
- Preclinical Properties of 18F-AV-45: A PET Agent for A{beta} Plaques in the Brain
- Relationship of Cerebrospinal Fluid Markers to 11C-PiB and 18F-FDDNP Binding
- Phase 1 Study of the Pittsburgh Compound B Derivative 18F-Flutemetamol in Healthy Volunteers and Patients with Probable Alzheimer Disease