


Abstract
The purpose of this study was to investigate the potential relationships between cerebrospinal fluid (CSF) measurements of β-amyloid-1–42 (Aβ1-42) and total tau to 11C-Pittsburgh compound B (11C-PiB) and 2-(1-{6-[(2-18F-fluoroethyl)(methyl)amino]-2-naphthyl}ethylidene) malononitrile (18F-FDDNP) binding as measured using PET. Methods: A total of 37 subjects were included, consisting of 15 patients with Alzheimer disease (AD), 12 patients with mild cognitive impairment, and 10 healthy controls. All subjects underwent a lumbar puncture and PET using both 11C-PiB and 18F-FDDNP. For both PET tracers, parametric images of binding potential were generated. Potential associations of CSF levels of Aβ1-42 and tau with 11C-PiB and 18F-FDDNP binding were assessed using Pearson correlation coefficients and linear regression analyses. Results: For both global 11C-PiB and 18F-FDDNP binding, significant correlations with CSF levels of Aβ1-42 (r = −0.72 and −0.37, respectively) and tau (r = 0.58 and 0.56, respectively) were found across groups (all P < 0.001, except P < 0.05 for correlation between 18F-FDDNP and Aβ1-42). Linear regression analyses showed that, adjusted for regional volume, age, sex, and diagnosis, global 11C-PiB uptake had an inverse association with Aβ1-42 CSF levels (standardized β = −0.50, P < 0.001), whereas there was a positive association between global 18F-FDDNP binding and tau CSF levels (standardized β = 0.62, P < 0.01). Conclusion: The good agreement between these 2 different types of biomarkers (i.e., CSF and PET) provides converging evidence for their validity. The inverse association between 11C-PiB and CSF tau Aβ1-42 confirms that 11C-PiB measures amyloid load in the brain. The positive association between 18F-FDDNP and CSF tau suggests that at least part of the specific signal of 18F-FDDNP in AD patients is due to tangle formation.
At present, there are 2 promising methods for the in vivo assessment of the extent of Alzheimer disease (AD) pathology. One is the use of cerebrospinal fluid (CSF) biomarkers of β-amyloid-1–42 (Aβ1-42) and tau, the other is the imaging of neuropathology associated with AD using PET and 11C-Pittsburgh compound B (11C-PiB) or 2-(1-{6-[(2-18F-fluoroethyl)(methyl)amino]-2-naphthyl}ethylidene) malononitrile (18F-FDDNP) (1,2). Biochemical changes in CSF (decrease of Aβ1-42 and increase of tau) are thought to indirectly reflect the presence of AD pathology (3). Imaging using either 11C-PiB or 18F-FDDNP is thought to provide a more direct reflection of AD pathology in the brain. 11C-PiB was designed to measure the amount of fibrillar Aβ deposits (4,5), which has been confirmed by a postmortem study in AD (6). 18F-FDDNP has been reported to label not only amyloid but also neurofibrillary tangles, which colocalized with conventional immunohistochemistry measures (7,2) and neuropathologically in an AD patient (2). Compared with 11C-PiB, however, limited information is available on in vivo 18F-FDDNP binding in AD patients.
Although it is generally accepted that both types of markers (i.e., CSF and PET) reflect amyloid or tau load, the relationship between these 2 types of biomarkers has not been studied extensively. Only a few studies have investigated the relationship between 11C-PiB and CSF measurements. Studies were performed in groups mainly consisting of healthy controls (8,9) or patients with mild cognitive impairment (MCI) (10,11) and recently in a group consisting solely of AD patients (12). In these studies, an inverse relationship between 11C-PiB and CSF Aβ1-42 levels was found but either no (8) or only a modest (10) relationship between 11C-PiB and CSF tau levels. No studies have been published describing the relationship between 18F-FDDNP binding and CSF biomarker levels.
In our previous study, paired 11C-PiB and 18F-FDDNP studies were performed in AD patients, MCI patients, and healthy controls (13). Both tracers were able to distinguish AD patients from healthy controls at a group level, but specific binding of 11C-PiB in AD patients was substantially higher than that of 18F-FDDNP. The moderate correlation between the global cortical binding of both tracers suggested that they measured related but different aspects of the neuropathology associated with AD. The purpose of the present study was to investigate the potential relationships between CSF measurements of Aβ1-42 and tau and PET measurements using 11C-PiB and 18F-FDDNP.
MATERIALS AND METHODS
Subjects
A total of 15 AD patients, 12 patients with amnestic MCI, and 10 healthy controls, for which paired 11C-PiB, 18F-FDDNP, and CSF data were available, were included (13). Global and regional 11C-PiB and 18F-FDDNP binding of an overlapping sample has been presented before (13). All patients received a standard dementia screening that included medical history, physical and neurologic examinations, laboratory tests, brain MRI, and extensive neuropsychologic testing. Clinical diagnosis was established by consensus in a multidisciplinary team, without knowledge of PET and CSF data. All AD patients met the criteria of the National Institute of Neurological and Communicative Disorders and Stroke–Alzheimer's Disease and Related Disorders Association for probable AD (14). MCI patients met Petersen criteria based on subjective and objective cognitive impairment, predominantly affecting memory, in the absence of dementia or significant functional loss (15). Control subjects were recruited through advertisements in newspapers and underwent the same diagnostic procedures. Exclusion criteria were a history of major psychiatric or neurologic (other than AD) illness and use of nonsteroidal antiinflammatory drugs, as these have been reported to compete with 18F-FDDNP for binding to Aβ fibrils in vitro and to Aβ plaques ex vivo (16). Additional exclusion criteria for controls were subjective memory complaints or clinically significant abnormalities on the MRI scan (as determined by a neuroradiologist). Written informed consent was obtained from all subjects after they had received a complete written and verbal description of the study. The study was approved by the Medical Ethics Review Committee of the VU University Medical Centre, Amsterdam.
PET
PET scans were obtained on an ECAT EXACT HR+ scanner (Siemens/CTI) equipped with a neuroinsert. This scanner enables the acquisition of 63 transaxial planes over a 15.5-cm axial field of view, thus allowing the whole brain to be imaged in a single bed position. The properties of this scanner have been reported previously (17). All subjects received a venous cannula for tracer injection. Patient motion was restricted by the use of a head holder and monitored using laser beams. First, a 10-min transmission scan was obtained in 2-dimensional acquisition mode using 3 retractable rotating line sources to correct the subsequent emission scan for photon attenuation. Next, a dynamic emission scan in 3-dimensional acquisition mode was started simultaneously with the intravenous injection of 11C-PiB (354 ± 74 MBq) with a specific activity of 43 ± 25 GBq/μmol using an infusion pump (Med-Rad; Beek), followed by a flush of saline, at a rate of 0.8 mL/s for the first 5 mL and 2.0 mL/s thereafter. Radiolabeled 11C-PiB was synthesized according to a modification (18) of the procedure described by Wilson et al. (19). The dynamic emission scan consisted of 23 frames, with a progressive increase in frame duration (1 × 15, 3 × 5, 3 × 10, 2 × 30, 3 × 60, 2 × 150, 2 × 300, and 7 × 600 s), for a total duration of 90 min. Finally, after a resting period of at least 1 h to allow for the decay of 11C (i.e., about 2.5 h after the administration of 11C-PiB), the same procedure was repeated but now using an injection of 18F-FDDNP (178 ± 14 MBq) (20) with a specific activity of 76 ± 49GBq/μmol.
MRI
All subjects underwent structural MRI using a 1.5-T scanner (Sonata; Siemens Medical Solutions). The scan protocol included coronal T1-weighted 3-dimensional magnetization-prepared rapid-acquisition gradient echo (slice thickness, 1.5 mm; 160 slices; matrix size, 256 × 256; voxel size, 1 × 1 × 1.5 mm; echo time, 3.97 ms; repetition time, 2,700 ms; inversion time, 950 ms; flip angle, 8°), which was used for coregistration and region-of-interest (ROI) definition.
Image Analysis
All PET sinograms were corrected for dead time, tissue attenuation using the transmission scan, decay, scatter, and randoms and were reconstructed using a standard filtered backprojection algorithm and a Hanning filter with a cutoff at 0.5 times the Nyquist frequency. A zoom factor of 2 and a matrix size of 256 × 256 × 63 were used, resulting in a voxel size of 1.2 × 1.2 × 2.4 mm and a spatial resolution of approximately 7 mm in full width at half maximum at the center of the field of view.
MR images were aligned to corresponding PET images using a mutual information algorithm (21). Data were further analyzed using PVE lab, a software program that uses a previously validated probability map of 35 delineated ROIs (22). No correction for partial-volume effects was applied to the PET data.
ROIs were projected onto 11C-PiB and 18F-FDDNP parametric images of binding potential (BPND). These parametric images were generated by applying a basis function implementation of the 2-step simplified reference tissue model with cerebellar gray matter as reference tissue (RPM2) (23) to the full dynamic 90-min PET data. Recently, RPM2 has been identified as the quantitative method of choice for both tracers (24,25). BPND is a quantitative measure of specific binding, reflecting the concentration of specifically bound tracer relative to the concentration of free and nonspecifically bound tracer in tissue under equilibrium conditions (26). All ROIs, including the cerebellum, and their corresponding gray matter volumes were obtained using PVE lab (22). For regional analyses, the BPND of frontal (volume-weighted average of orbital frontal, medial inferior frontal, and superior frontal), parietal, and temporal (volume-weighted average of superior temporal and medial inferior temporal) cortex; medial temporal lobe (MTL) (volume-weighted average of enthorinal cortex and hippocampus); and posterior cingulate was used. In addition, a global cortical ROI was defined, based on the volume-weighted average of these regions. Cerebellar gray matter was chosen as reference tissue because of its (histopathologic) lack of Congo red and thioflavin-S–positive plaques (27,28).
CSF
CSF was obtained by lumbar puncture (LP) of the L3/L4 or L4/L5 intervertebral space, using a 25-gauge needle, and collected in 10-mL polypropylene tubes. Within 2 h, CSF samples were centrifuged at 1,800g for 10 min at 4°C. A small amount of CSF was used for routine analysis, including total cells (leukocytes and erythrocytes), total protein, and glucose. CSF was separated into aliquots in polypropylene tubes (0.5 or 1 mL) and stored at −80°C until further analysis. CSF Aβ1-42 and tau were measured with Innotest (Innogenetics) sandwich enzyme-linked immunosorbent assay as described previously (29). As the manufacturer does not supply control data, performance of the assays was monitored using pools of surplus CSF specimens. In the study period, multiple specimens with various concentrations, which were included in 7–18 runs, were used for this purpose. The mean coefficients of variation (±SD) obtained were 11.3% ± 4.9% for Aβ1-42 and 9.3% ± 1.5% for tau. Median time from LP to PET was 3 mo (interquartile range, 6 months). Five subjects (2 AD patients, 1 MCI patient, and 2 controls) received their LP more than 12 months apart from (before) the PET scan. After exclusion of these subjects, median time from LP to PET was 2.5 months.
Statistical Analysis
Data are presented as mean ± SD, unless otherwise stated. As CSF biomarker levels were not normally distributed, data were log-transformed. Frequency distributions for sex were compared with χ2 tests. For continuous measures, differences between groups were assessed using ANOVA with post hoc least-significant-difference tests and age as covariate.
For the assessment of relationships between CSF and BPND data, first Pearson correlations were calculated across the entire group. Next, linear regression analyses were performed to adjust for potential confounders using CSF biomarkers as independent and global and regional BPND as dependent variables. Separate analyses were performed for 11C-PiB and 18F-FDDNP. In the first model, the relationship of each CSF biomarker with both PET tracers was adjusted for gray matter ROI volume. In the second model, analyses were additionally adjusted for age, sex, and diagnosis (using dummy variables). In the third model, CSF biomarkers were entered simultaneously, together with the same covariates. This analysis was repeated after exclusion of the 5 subjects with long intervals between LP and PET. Standardized βs are reported to allow comparison of effect sizes. A P value below 0.05 was considered significant.
RESULTS
Demographic and clinical data by patient group are presented in Table 1. The 3 groups were similar with respect to sex. AD patients tended to be younger than MCI patients and controls. AD patients had lower Mini-Mental State Examination scores than control subjects and MCI patients (both P ≤ 0.001). Group differences were found for CSF levels of Aβ1-42 and tau (P ≤ 0.001). In addition, groups differed with respect to global cortical 11C-PiB BPND (P ≤ 0.001). A trend was seen for global cortical 18F-FDDNP BPND (P < 0.10). Figure 1 shows parametric 11C-PiB and 18F-FDDNP BPND images of a typical AD patient and a healthy control.
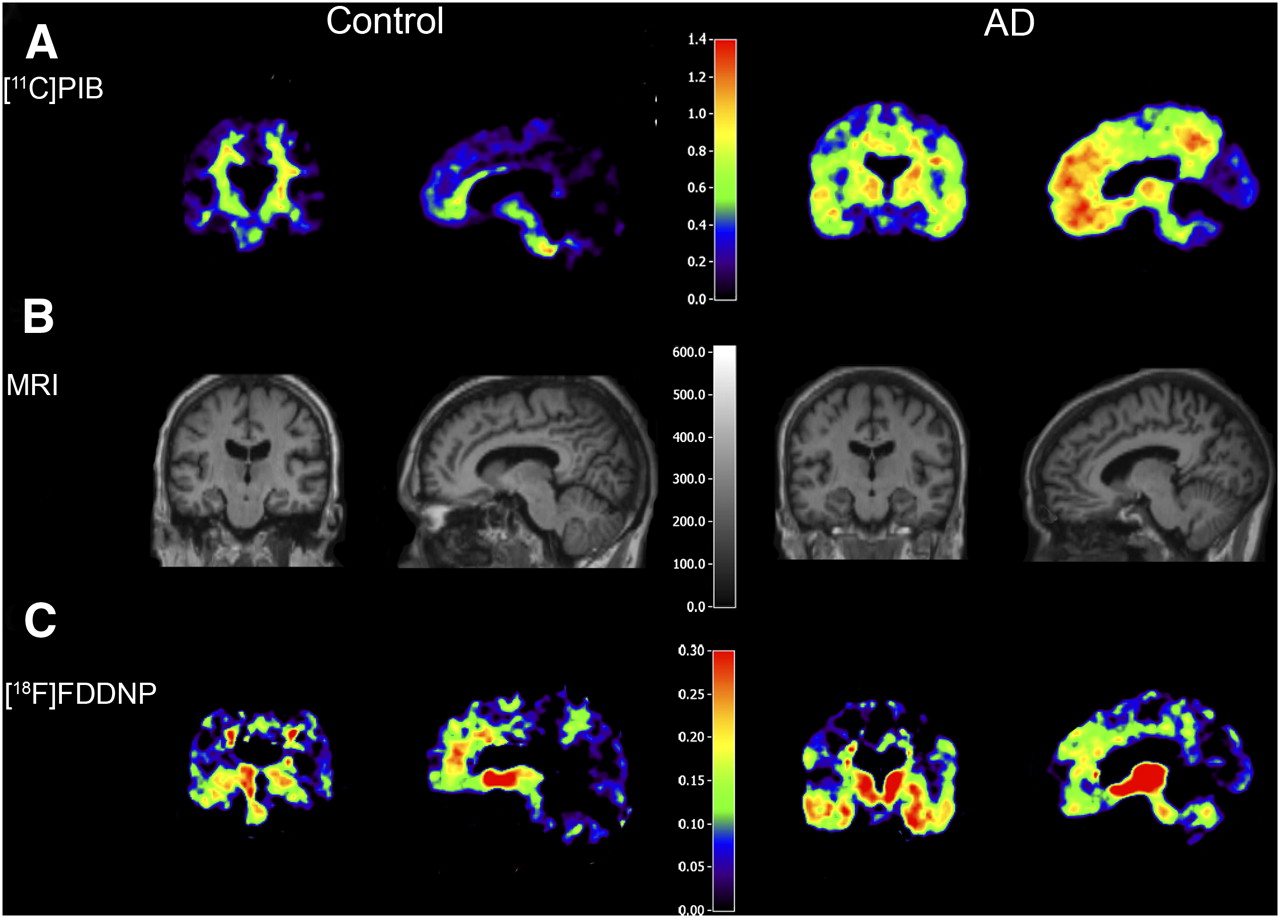
Examples of parametric coronal (left column) and sagittal (right column) 11C-PiB and 18F-FDDNP BPND images in control subject and AD patient with their coregistered MR image. 11C-PiB and 18F-FDDNP scans were obtained in same subjects. Corresponding CSF values for AD patient (60 y) were Aβ1–42, 504 pg/mL, and tau, 837 pg/mL. For the healthy control (61 y), CSF levels were Aβ1–42, 1,123 pg/mL, and tau, 245 pg/mL.
Demographic and Clinical Characteristics of 3 Diagnostic Groups
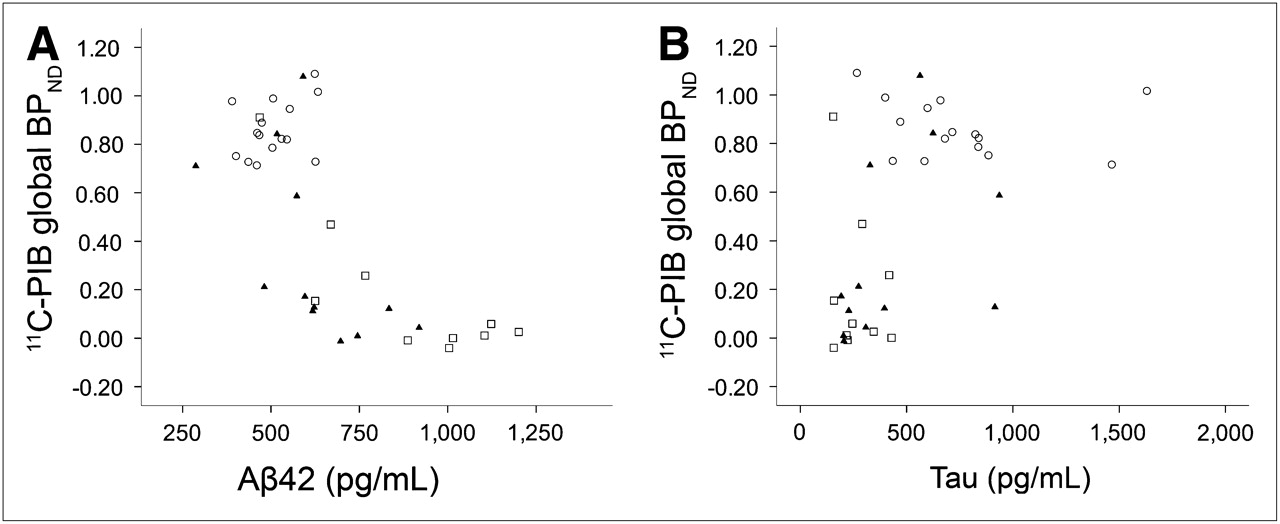
Table 2 lists Pearson correlations between Aβ1-42 and tau levels in CSF and global and regional tracer BPND across all subjects. Lower Aβ1-42 and higher tau levels were associated with higher global 11C-PiB binding (Fig. 2). This was due to higher binding in all cortical regions investigated for Aβ1-42 and in all, except the MTL, for tau. Furthermore, lower Aβ1-42 and higher tau levels were associated with higher global 18F-FDDNP binding (Fig. 3). In this case, lower CSF Aβ1-42 was associated with higher uptake in frontal and parietal cortex, but there were no correlations with other brain regions investigated. Higher CSF levels of tau were associated with higher uptake in all regions, except the MTL.

Scatter plots of 11C-PiB binding (global BPND) against CSF levels of Aβ1–42 (A) and tau (B). ○ are patients with AD, ▴ are patients with MCI, and □ are healthy controls. CSF values are shown as measured, whereas statistical analyses were performed on log-transformed values. Lower CSF levels of Aβ1–42 (A: r = −0.72, P < 0.001) and higher tau levels (B: r = 0.58, P < 0.001) were associated with higher global 11C-PiB binding.

Scatter plots of 18F-FDDNP binding (global BPND) against CSF levels of Aβ1–42 (A) and tau (B). ○ are patients with AD, ▴ are patients with MCI, and □ are healthy controls. CSF values are shown as measured, whereas statistical analyses were performed on log-transformed values. Lower CSF levels of Aβ1–42 (A: r = −0.37, P < 0.05) and higher tau levels (B: r = 0.56, P < 0.001) were associated with higher global 18F-FDDNP binding.
Pearson Correlation Coefficients Between CSF Biomarkers and Tracer BPND
Next, linear regression analyses were performed to adjust for potential confounders. After adjustment for gray matter ROI volume (model 1), associations were observed between both CSF markers (i.e., low CSF Aβ1-42 and high CSF tau) and increased global and regional 11C-PiB binding (Table 3). For 18F-FDDNP binding, associations were found between low CSF Aβ1-42 and increased global, frontal, and parietal binding, with a trend for temporal binding. In addition, associations were found between high CSF tau and increased 18F-FDDNP binding in all regions except for the MTL, where this association displayed only a trend (standardized β = 0.34, P < 0.10).
Linear Regression Analysis Between CSF Biomarkers and Tracer BPND
After additionally adjusting for age, sex, and diagnosis (model 2), an association was observed between CSF Aβ1-42 and global, frontal, temporal, and posterior cingulate 11C-PiB binding, but there was no such association between CSF tau and global or regional 11C-PiB binding. For 18F-FDDNP binding, the opposite pattern was observed (i.e., a positive association with CSF levels of tau but no association with CSF levels of Aβ1-42). For the MTL, no associations were found after correcting for gray matter ROI volume, age, sex, and diagnosis. Nevertheless, the effect size of the association between CSF tau and 18F-FDDNP binding in this region remained comparable (standardized β = 0.33). Results were essentially the same in the third model, in which both CSF biomarkers were entered simultaneously (data not shown). Finally, these analyses were repeated after exclusion of the 5 subjects with intervals between LP and PET of more than 12 mo. Results remained unaltered for associations with 11C-PiB binding (model 2, global binding; CSF Aβ1-42: standardized β = −0.50, P < 0.01; CSF tau: standardized β = 0.19, P = 0.29). For 18F-FDDNP, associations with both CSF Aβ1-42 and tau became even stronger (model 2, global binding; CSF tau standardized β = 0.70, P < 0.01; CSF Aβ1-42: standardized β = −0.42, P = 0.09). Again, results were essentially the same in the third model, in which both CSF biomarkers were entered simultaneously (data not shown).
DISCUSSION
In the present study, relationships between 2 CSF biomarkers (Aβ1-42 and tau) and uptake of 2 PET amyloid tracers (11C-PiB and 18F-FDDNP) were investigated. Adjusted for ROI volume, age, sex, and diagnosis, increased global 11C-PiB binding was specifically related to low CSF levels of Aβ1-42. In contrast, increased global 18F-FDDNP binding was associated with high CSF levels of tau. These results add to the converging evidence that both PET tracers measure different elements of the neuropathology underlying AD.
These results confirm and extend those of previous studies in which an inverse (12,8–10) relationship between CSF Aβ1-42 and 11C-PiB and no (8) or only a modest (10) relationship between CSF tau and 11C-PiB were demonstrated. Those earlier studies, however, were performed in groups consisting mainly of healthy controls (8,9), MCI patients (10), or AD patients (12). In the present study, this relationship was extended to the entire spectrum of cognitive decline, providing further support for the notion that 11C-PiB measures amyloid load in the brain.
No associations between 18F-FDDNP binding and CSF data have been reported. Although it has been previously reported that 18F-FDDNP binds with high affinity to both amyloid plaques and neurofibrillary tangles in vitro (7), a considerably lower sensitivity for binding to amyloid containing structures has been reported recently (30). At present, it is still not clear what the specific signal in AD represents in vivo. In the present data, a positive association between 18F-FDDNP and CSF tau and, after exclusion of 5 subjects with long intervals between PET and CSF sampling, a moderate inverse association with CSF levels of Aβ1-42 were observed. These results suggest that increased binding of 18F-FDDNP in AD patients may indeed be due to tangle formation and, to some extent, plaques. This is in line with a previous study (7) showing 18F-FDDNP autopsy tissue staining to colocalize with conventional histochemistry measures of tangles and plaques.
After exclusion of the 5 subjects with long intervals between PET and LP, a moderate inverse association was found between 18F-FDDNP binding and CSF levels of Aβ1-42, which was not present beforehand. Previously, it was shown that in the case of repeated LP, CSF biomarkers hardly change over time (29). Therefore, these results are unlikely to be caused by changes in CSF. For 18F-FDDNP, an increase in binding over time has been described in subjects with clinical evidence of disease progression (2). Therefore, changes in the substrate for 18F-FDDNP binding are more likely to have contributed to these results. Furthermore, exclusion of relative outliers could also have contributed to the stronger association.
In general, for both tracers associations between regional tracer binding and CSF biomarkers were similar to those for global binding, except for the MTL, in which no associations were found. This finding is remarkable for 18F-FDDNP, because the MTL displayed the highest 18F-FDDNP binding values for all 3 diagnostic groups. The lack of associations in this region may be due to technical reasons. This region, being the volume-weighted average of the entorhinal cortex and hippocampus, was relatively small, making it sensitive to noise. Furthermore, because the MTL atrophy is commonly seen in AD (31), differences in MTL volumes between diagnostic groups may lead to partial-volume effects and thus underestimation of the signal in AD patients. This potentially causes reduced variability in the MTL BPND between diagnostic groups and consequently a lack of association with CSF biomarkers. When linear regression analyses were performed with adjustment for gray matter ROI volume, a trend was found for high CSF levels of tau to be associated with increased 18F-FDDNP binding in the MTL. After additional adjustment for age, sex, and diagnosis, this trend disappeared—although the effect size remained strong—suggesting that indeed partial-volume effects in the MTL have at least partly underestimated tracer binding in this region. However, PET data were not corrected for partial-volume effects. The choice was made not to correct for partial voluming, as potential overcorrection may lead to an artificially high signal. This approach ascertains that any observed increase in binding is real, which is a deliberate conservative approach. But more important, the current status of partial-volume correction (PVC) in amyloid imaging is not clear. For 11C-PiB studies, several PVC methods have been used, most commonly a method developed by Meltzer et al. (32) and an algorithm implemented in the PMOD software package (PMOD Technologies Ltd.). These methods are based on T1-weighted structural MRI scans. However, a study performed by our group (33) showed that accuracy of MRI-based PVC depends greatly on MRI scanner type, scanning sequence, and gray or white matter segmentation algorithm. The results of that study indicate that the accuracy of PVC should be further evaluated before it can be used in patient studies.
CONCLUSION
The main strength of the present study is its unique design: CSF sampling and PET with both ligands in the same subjects along the spectrum of cognitive decline. This design enabled a direct assessment of the relationship between 2 types of biomarkers, both aimed at identifying underlying AD pathology. The inverse association between 11C-PiB and CSF tau Aβ1-42 confirms that 11C-PiB measures amyloid load in the brain. The positive association between 18F-FDDNP and CSF tau suggests that at least part of the specific signal of 18F-FDDNP in AD patients is due to tangle formation. Further research in tauopathies other than AD will be valuable in gaining more insight in the validity of 18F-FDDNP for in vivo imaging of tau pathology. In addition, longitudinal studies are needed to investigate possible increases in 18F-FDDNP binding over time.
Acknowledgments
We thank Anke A. Dijkstra for help with the data analysis, the PET radiochemistry and technology staff of the Division of Nuclear Medicine and PET Research for tracer production and acquisition of PET data, and the technology staff of the Department of Radiology for acquisition of the MRI data. This work was financially supported by the Internationale Stichting Alzheimer Onderzoek (ISAO; grant 05512) and the American Health Assistance Foundation (AHAF; grant A2005-026). The clinical database structure was developed with funding from Stichting Dioraphte.
Footnotes
-
COPYRIGHT © 2009 by the Society of Nuclear Medicine, Inc.
References
- Received for publication March 17, 2009.
- Accepted for publication June 4, 2009.


Jump to section
Related Articles
Cited By...
- Temporal Correlation of CSF and Neuroimaging in the Amyloid-Tau-Neurodegeneration Model of Alzheimer Disease
- Use of amyloid-PET to determine cutpoints for CSF markers: A multicenter study
- Detailed comparison of amyloid PET and CSF biomarkers for identifying early Alzheimer disease
- Longitudinal Change in CSF Biomarkers in Autosomal-Dominant Alzheimer's Disease
- Fluid Biomarkers in Alzheimer Disease
- CSF biomarkers for Alzheimer disease correlate with cortical brain biopsy findings
- Brain Imaging in Alzheimer Disease
- Cerebrospinal fluid biomarkers in the differential diagnosis of Alzheimer's disease from other cortical dementias
- Target-Specific PET Probes for Neurodegenerative Disorders Related to Dementia
- Differential association of [11C]PIB and [18F]FDDNP binding with cognitive impairment